
The Timing Analysis provides a display and measurement tool for logic signals captured using the HCI pods and HCI UART, SPI, I2S and USB data. In addition, the view can include graphical display of Classic Bluetooth, Bluetooth, Low Energy and Wi-Fi packets. The packets are displayed simultaneously, and time synchronized with captured logic signals.
The Timing Analysis View is shown in bottom left corner of WPS main window. In case it was closed, the Timing Analysis View can be open from menu View.
The Timing Analysis displays signals/protocols available to the Main windows. This means you will see only the recorded data for devices in the Wireless and Wired panes selected for analysis and for Bluetooth technologies selected in the Record Options Wireless and Wired tabs. If the data filter changes due to changes in device selection and/or technology selection, the Timing Analysis display will refresh with the next analysis.
Filters applied in the Main windows do not apply to the signals/protocols displayed in the Timing Analysis.
See Connecting for HCI and Logic Capture, and Wired Tab procedures for configuring the HCI pod hardware and the Wireless Protocol Suite software. See Logic Event Capture and Analysis for information on logic capture, recording, and analysis procedures. See UART Capture Configuration for information on capturing UART. See Connecting for USB Capture for information on capturing USB.
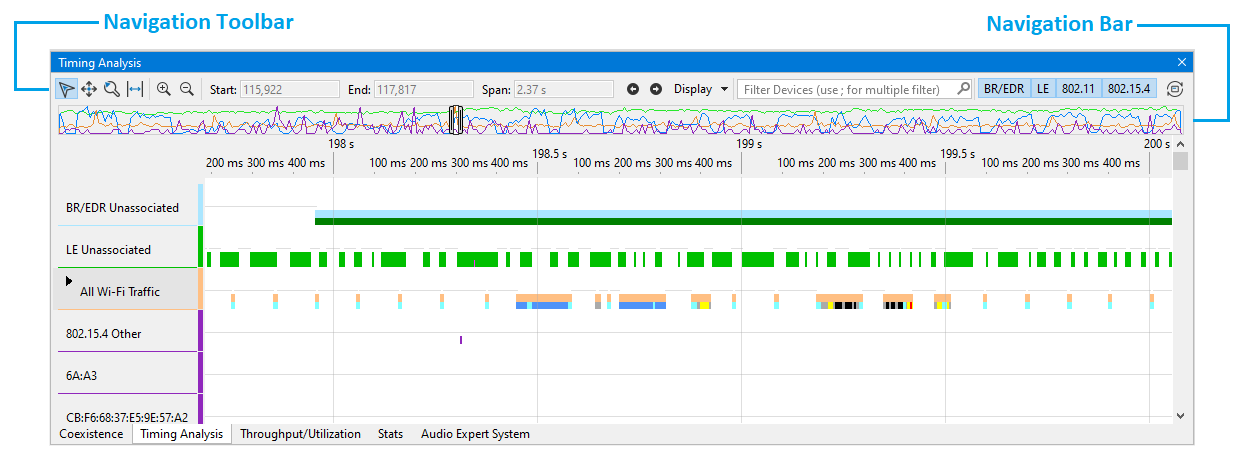
The Timing Analysis window has three major areas:
-
Navigation Toolbar - provides tools for positioning, displaying, filtering and measuring elements in the Timeline View.
-
Timeline View- Displays the logic signal waveform, the packets, and measurements.
-
Navigation Bar - Contains a viewport that represents the range of the Timeline View. Timing cursor timeline locations are represented in the Navigation Bar.
Acknowledgment: The Frontline Logic Analyzer contains features utilizing the Qt open-source library, licensed under LGPL. To obtain the utilized Qt library source code, please contact Technical Support.