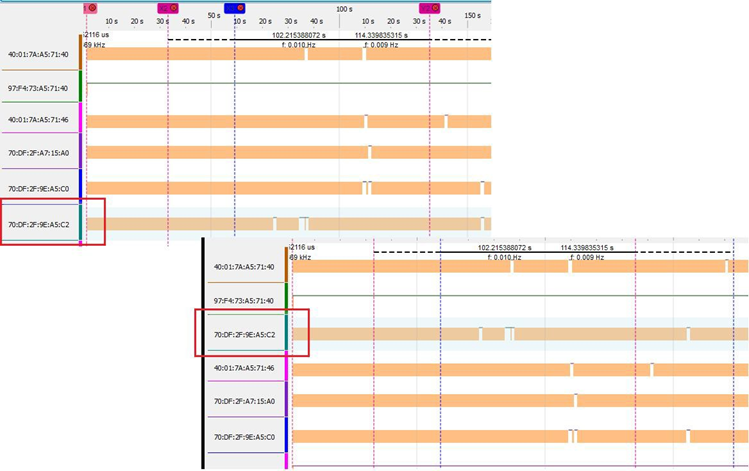
Timeline View displays captured logic signals, Classic Bluetooth, Bluetooth Low Energy, Wi-Fi and HCI packets. The signals and packets are synchronized and displayed on a horizontal time axis. The amount of time displayed in the view is controlled by the Navigation Bar viewport. As the viewport expands, more of the timeline is displayed and the signals and packets will compress. Conversely, as the viewport collapses—gets smaller—less of the timeline displays and the logic signals and packets will expand.
See Timing Analysis Navigation Toolbar for zooming information.
Each signal or packet set displayed in the Timeline View appears on a single row. All logic signals, Bluetooth, Wi-Fi and HCI UART/USB packets available in the Main window’s All Frames tab will appear in the Timeline View from both live capture and a capture file.
Filters applied in the Main windows do not apply to the signals/protocols displayed in the Timing Analysis.
Each Timeline View protocol row contains the packets from a single source device selected for analysis from the Device Database or Wired Devices views. If a Bluetooth device cannot be determined, packets will be placed in an appropriate aggregate row— "BR/EDR Other" or "LE Other". Bluetooth packets have the following characteristics and information:
-
Wireless packet width indicates the in-air duration. HCI packet width is computed, assuming a bus rate of 12 Mbps that is 100% utilized (utilization is always less than 100%, but exact utilization is unknowable, so this method provides a reasonable approximation).
-
Packet type
-
Frame number
Wi-Fi packets have the following characteristics and information:
-
Packet width indicates the in-air duration.
-
Wi-Fi frame type
-
Frame number
-
802.11 Data frame was not acknowledged
Colored outlines:
Where BR/EDR and LE show Role/Side and pre-connection/initiator information as 1st outline level,
802.11 shows frame type/subtype color information as 1st outline level.
BR/EDR, LE, and 802.11 have the 2nd outline color level that shows the frame status whether the frame was retransmitted or has an error.
Refer to Appendix G: Color Coding for Packet Types for specific coding.
Frame color propagation in the Reduced mode:
The frame colors can be seen in the Reduced mode to provide high-level navigation convenience. The error, retransmit, and pre-connection colors are the priority ones which means that those colors will be preferred to show in reduced mode in cases where screen space is limited.
Selection highlight in Reduced mode:
The selected frames displayed in reduced mode are now highlighted so the user can navigate to them from the higher levels of zoom.
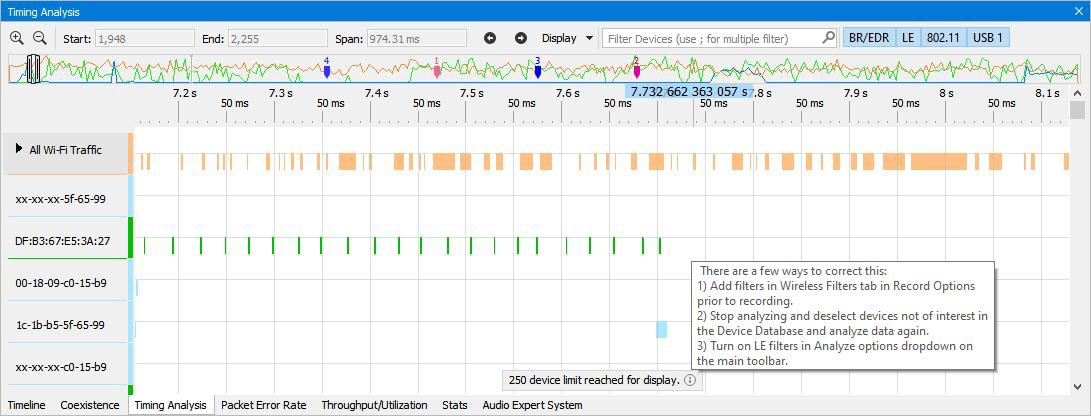
At the top of the Timeline View is a time scale. Its time range is the time span of the viewport. The Timing Analysis view shows 250 devices maximum. Information label with a hint will be shown at the bottom of TA view if there are more devices in analyzed traffic.
Row Grouping Modes
There are two grouping modes for timeline rows available from the Display menu. The ‘Group by Device’ mode is the mode where a row is associated with a single device. This is the default mode for WPS versions prior to 4.25.
The ‘Group by Connection’ is the new mode available in WPS 4.25. In this mode, two device rows can be grouped together if associated devices form a connection. A connection is defined as traffic going between two valid Bluetooth addresses. In most cases, this will be two Bluetooth devices talking to each other, e.g. Central ↔ Peripheral. Also, devices could change addresses but could be determined using the IRK or the central/peripheral relationship. In this case, the connection is defined as traffic going between two devices with a constant IRK or as traffic between central and peripheral devices.
The ‘Group by Connection’ mode is currently available for Bluetooth BR/EDR and Bluetooth LE technologies only. Also, there is currently no support for piconet or mesh group connections.
In the connection mode, each connection is presented with a ‘group’ or ‘root’ row, which can be expanded to display two or more device rows. The group row contains all packets associated with both devices within the connection, i.e. a sum of packets from the first device row and from the second device row. If a device for a packet is not associated with any connection, the packet will be placed in an appropriate aggregate row— "BR/EDR Unassociated" or "LE Unassociated". The header text for the group row mentions names for two devices: top line for Central and bottom line for Peripheral. If neither friendly name nor nickname is available for the device then BD address is displayed.
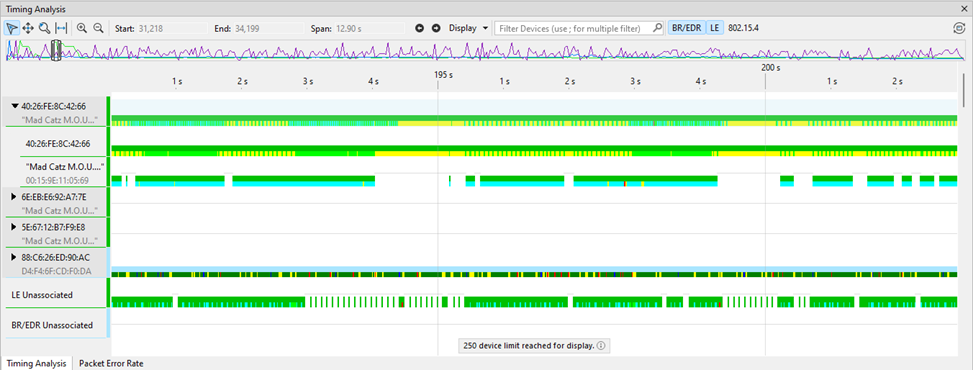
By default, Timing Analysis view will display connections for live captures and for new capture files. Older capture files recorded prior to WPS 4.25 will be loaded and displayed in Device mode by default.
The user can switch between connection mode and device mode at any time.
Row Label
On the left of each row is a row label. There are two label categories: Wired capture (either logic, UART, or USB) and Wireless. The row labels are color coded for easy identification and the color carries through in the signal/packet timeline. Timing Analysis Timeline Row Labels (below) provides details of the label format.
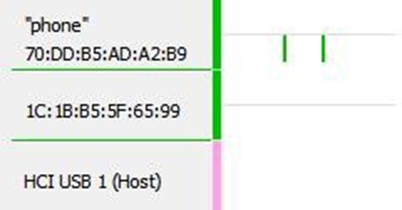
You can add and manage nicknames for the devices and signals. Please call the context menu in the left column next to the device address to open the editing window. The entered nicknames are synchronized with the Device Database panel.
Adding nicknames to group rows is not supported. However, users can still change nicknames for device rows within the connection group.
Timeline
Timing Analysis Timeline Row Labels
|
Category |
Type |
Label |
Source Connector |
|
Wired
|
Logic |
<HCI Pod#> : <Line#> Where: HCI POD 1 (Host) Message direction is from the host to the controller. |
Pod 1 or Pod 2 Digital 1 |
|
Pod 1 or Pod 2 Digital 2 |
|||
|
UART |
Pod 1 |
||
|
HCI POD 1 (Ctlr) Message direction is from the controller to the host. |
|
||
|
HCI POD 2 (Host) Message direction is from the host to the controller. |
Pod 2 |
||
|
HCI POD 2 (Ctlr) Message direction is from the controller to the host. |
|||
|
SPI
|
HCI POD 1 (Host) Message direction is from the host to the controller. |
Pod 1 |
|
|
HCI POD 1 (Ctlr) Message direction is from the controller to the host. |
|||
|
HCI POD 2 (Host) Message direction is from the host to the controller. |
Pod 2 |
||
|
HCI POD 2 (Ctlr) Message direction is from the controller to the host. |
|||
|
USB
|
HCI USB 1 (Host) Message direction is from the host to the controller. |
USB 1
|
|
|
HCI USB 1 (Ctlr) Message direction is from the controller to the host. |
|||
|
HCI USB 2 (Host) Message direction is from the host to the controller. |
USB 2
|
||
|
HCI USB 2 (Ctlr) Message direction is from the controller to the host. |
|||
|
Wireless
|
Bluetooth |
A Bluetooth label is either a BD_ ADDR (full or partial) or, if the address is not known, an aggregate label (“BR/EDR Other” or “LE Other”) |
Antenna
|
|
Wi-Fi |
A Wi-Fi label is either a MAC address (full or partial) or, if the address is not known, an aggregate label “Wi-Fi Other” |
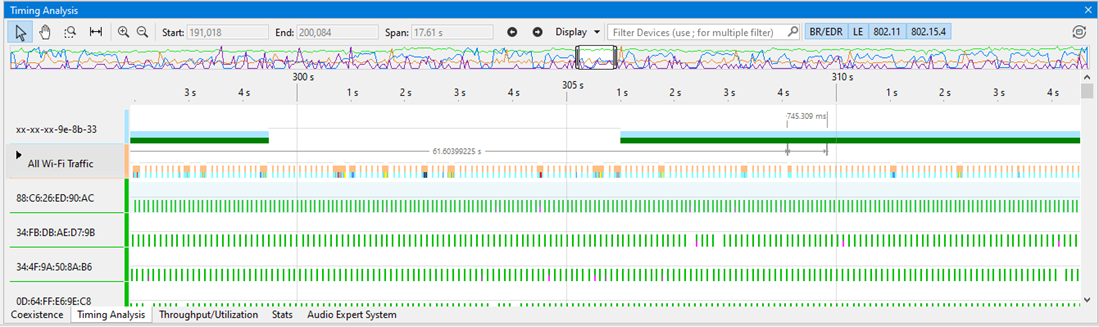
In the Timeline appears a representation of the captured logic signal or HCI UART/USB and Bluetooth or Wi-Fi packets. Synchronization of these timelines provides for a means of accurate timing analysis. The viewport and the zoom tools control the number of signals and packets displayed in the Timeline View. The larger the viewport—zooming out—the more of the captured range that is displayed, and the smaller the signals and packets will appear. As the resolution decreases, logic signals will become smaller and smaller until they become a gray-hash bar.
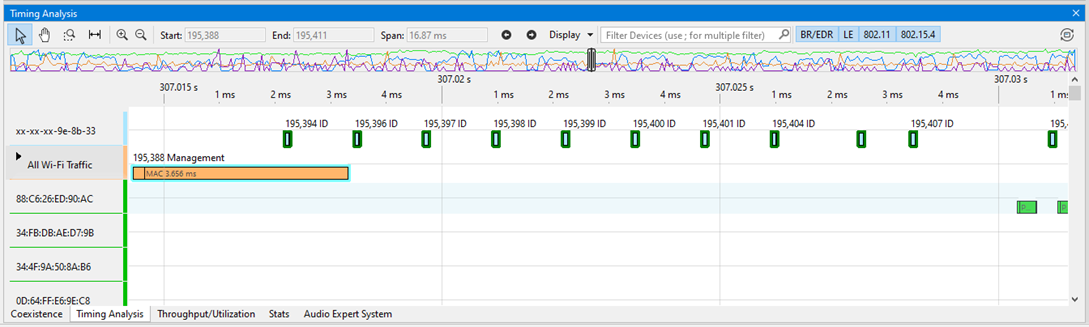
Decreasing the viewport size by zooming in will decrease the time duration covered by the timeline and the signals will appear with greater resolution. Should a logic signal or signal be non-differentiable from adjacent signals or packets, they are displayed as a hash-bar. This ensures that all signals and packets are visible when the timeline displays the complete capture session. The figures below show examples of the same display in hash-bars and zoomed in to show the actual logic signals and packets in the same time frame.
Packet Structure
When the appropriate Zoom-In level is reached, a packet structure appears that meets the specifications of Bluetooth and Wi-Fi technologies.
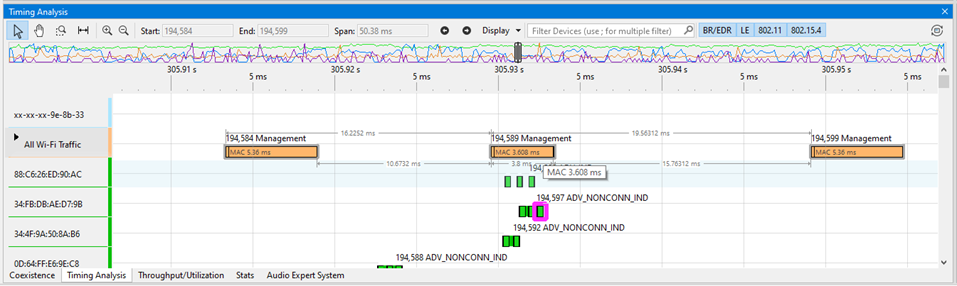
If there is enough space, packet parts are presented with names and durations. You can also hover over each part to check this information in the tooltip.
Sticking measurements only works to the beginning and end of the packet. If you need to check the duration of several parts, use the duration of each part to calculate.
Keyboard and Mouse Controls
Timeline View Keyboard Controls
|
Keys |
Action |
|
Left/Right Arrow |
Moves timeline left/right. Equivalent to moving the viewport. If a packet is selected, then pressing Left or Right Arrow key will move selection to the previous or next packet. |
|
Up/Down Arrow |
Scrolls timeline rows up/down. Equivalent to using the Timeline View scroll bar. |
|
Up/Down Arrow + Ctrl |
Zooms timeline in and out. Equivalent to using the Navigation Toolbar Zoom In/Out buttons or collapsing/expanding the viewport. |
|
Page Up/Down |
Pages the timeline left/right. Paging Up moves the timeline left side over to the right side, that is jumping to the left. Paging Down moves the timeline right side over to the left side, that is jumping to the right. |
|
Home |
Moves the timeline and viewport to the beginning of the capture. |
|
End |
Moves the timeline and viewport to the end of the capture. |
Timeline View Mouse Controls
|
Keys |
Action |
|
Left Click on a Packet |
Selects the packet. |
|
Left Click + Drag |
Left click in the desired location and drag in any direction to create a measurement. |
|
Scroll Wheel |
The mouse wheel can be used to zoom in and out by moving the wheel forward to zoom in and back to zoom out. The zoom is centered at the mouse position. The zooming is centered at the mouse position on the viewport area. |
Logic Signals in Timeline View
A logic signal timeline is shown as a high/low representation of the captured signal. A high level appears beginning at the time when the captured signal transitioned from a low state up through the logic-high threshold voltage. The high state is shown at the row label top edge. The logic low state occurs when the captured logic signal transitions from a high state down through the logic-high threshold voltage. A logic low state is shown at the row label bottom edge. State transition is displayed as instantaneous.
See Timeline Packet Navigation and Selection for navigation modes detailed description.

The high level threshold is determined by the HCI POD LIO LVL voltage. The minimum threshold voltage is 1.65 V DC. Refer to Logic Event Capture Configuration for more information about the threshold level.
Bluetooth, Wi-Fi & HCI Signals in Timeline View
A protocol row in the Timeline View shows the packets associated with a single source device. In the connection mode, the group rows additionally show all packets associated with both connected devices. The devices appearing in the row labels were selected for analysis in the Device Database or Wired Devices views.
The packets for each device appear as color-coded rectangles on the timeline.
Timeline Packet Color Codes
|
Category |
Color |
Description |
|
Bluetooth |
Blue |
Classic Bluetooth |
|
Green |
Bluetooth Low Energy |
|
|
Wi-Fi |
Orange |
Wi-Fi frames. Diagonal pattern means that 802.11 data frame was not acknowledged. |
|
HCI |
Purple |
UART |
|
USB |
||
|
Error |
Red |
Surrounding dashed line. Status errors, e.g. CRC or link errors. |
|
Selected |
Black |
Surrounding line. Selected packet. Can result from selection in Main windows or one of the Timeline views. |
|
802.15.4 |
Violet |
804.15.4. frames |
Packet information appearing on the rectangle is:
-
Packet type - Above the packet rectangle top border. HCI will show packet type and, for HCI ALC and SCO data, the source.
-
Frame number - In the rectangle center.
-
Frame selection - If a dashed yellow line appears surrounding the packet, that packet has been selected in either the Main windows, Coexistence View, Bluetooth Timeline, or Bluetooth Low Energy Timeline.
The length of the rectangle represents the Bluetooth or Wi-Fi packet in-the-air duration or the HCI packet duration.
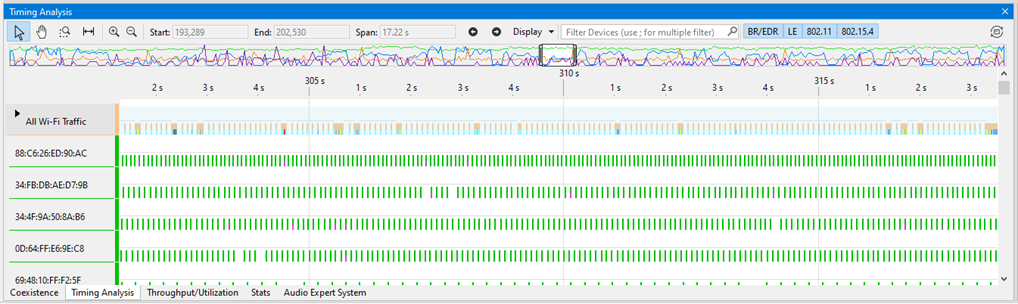
The "All Wi-Fi traffic" row includes all Wi-Fi packets from all addresses available on Timing Analysis. This row can expand/collapse using the arrow icon on the row header. In the expanded state Wi-Fi rows are shown below the “All Wi-Fi Traffic” row. You can drag any devices out of this grouping for easier navigation and analysis. To do that, simply left-click on the device of interest and drag it out to place anywhere in the left column.
Timing Cursors & Measuring in Timeline View
The Timing Analysis view provides a way to quickly see basic timing information by hovering mouse cursor over the timeline. When a user hovers mouse over a packet/signal or over a gap between two adjacent packets/signals, the following information is displayed along with gray dimension and extension lines:
-
The Duration of the packet /signal
-
The Gap between the end of the packet/signal and the beginning of the next packet/signal
-
The Delta between the beginning of the packet/signal and the beginning of the next packet/signal
-
The Gap between the end of the previous packet/signal and the beginning of the packet/signal
-
The Delta between the beginning of the previous packet/signal and the beginning of the packet/signal The following is true: Duration( Current ) + Gap( Current, Next) = Delta( Current, Next);
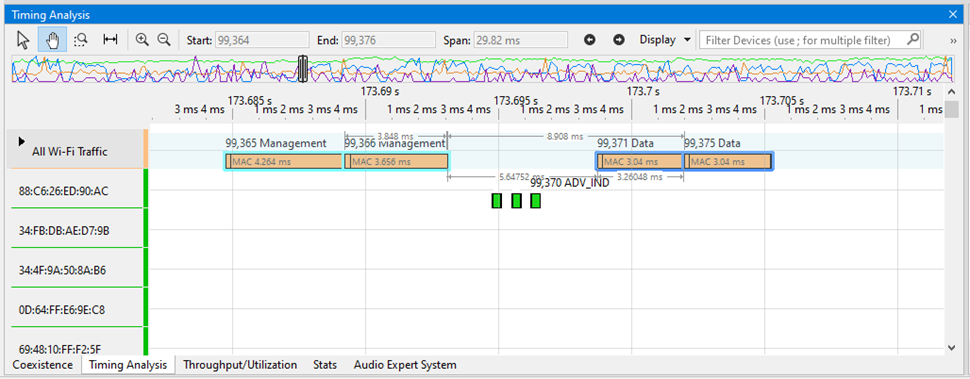

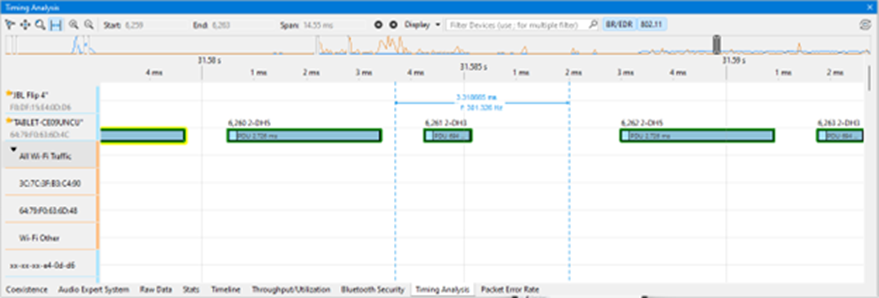
The Timing Analysis view provides a quick and simple method to manually time check in Measurements mode. The time measurements are overwritten when the next one is created but can be pinned by right-clicking to add more measurements. The timing cursors provide a means to measure relative time differences between logic signals, packets, or both, or arbitrary positions on the timeline.
-
Select

-
Click the left mouse button on the desired location or on the desired event.
-
Drag the mouse to the desired location or desired event.
-
Release the left mouse button and the time between cursors is displayed.
-
To add additional measurements, right-click on an existing one and select "Mark Sticky" to fix the current measurement and allow another set of cursors to be placed as desired. The sticky measurement becomes gray.
When the + cursor is near a logic signal transition or a packet right or left edge, a down-pointing triangle appears on the transition. Releasing the mouse when the triangle appears results in the timing cursor snapping to the transition. If there is no snapping triangle, the timing cursor is placed at the location of the + cursor.
Timing cursor X/Y pair tags appear at the top of the time scale and are color coded. Vertical lines extend from the tag through the timeline and the lines are color matched to their tags. Between the tag lines is a white dashed connecting line with the time span of the tag pair above the line, and the frequency of the time span (reciprocal of the time) below the line. If the Y-cursor is placed to the left of the X-cursor the time value will be negative, however, the frequency is the absolute time span reciprocal.
Timing cursors can be moved by positioning the mouse cursor over the timing cursor tag, holding and dragging the tag to a new position. When a cursor pair is selected the cursor tag color changes to white.
Arranging Rows in Timeline View
Resizing
The Timeline View can be scrolled vertically by using the scroll bar on the right side of the view. Additionally, the rows can be rearranged to aid in analysis and measurement. Click and hold the mouse cursor on a row label and drag it to a new position. A white horizontal bar will appear between row labels to indicate where the row you are moving will be dropped when the mouse key is released.
Row moving is not supported within connection groups.
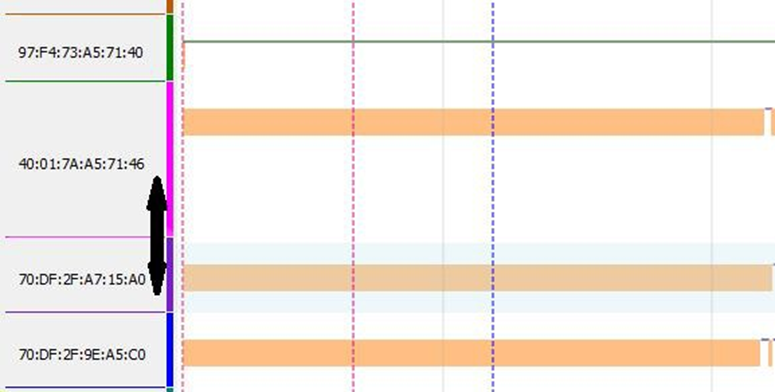
Rows can be resized by dragging the bottom of the row label. The row data also resizes with the row label.
Positioning
Rows can be moved up or down to change the order. Click and hold anywhere in a row label. Drag the mouse cursor up or down the rows over the labels. A line with the same color as the row label that you clicked on will appear. Position the line where you want to move the row and release the mouse key. The row will snap to the new location.