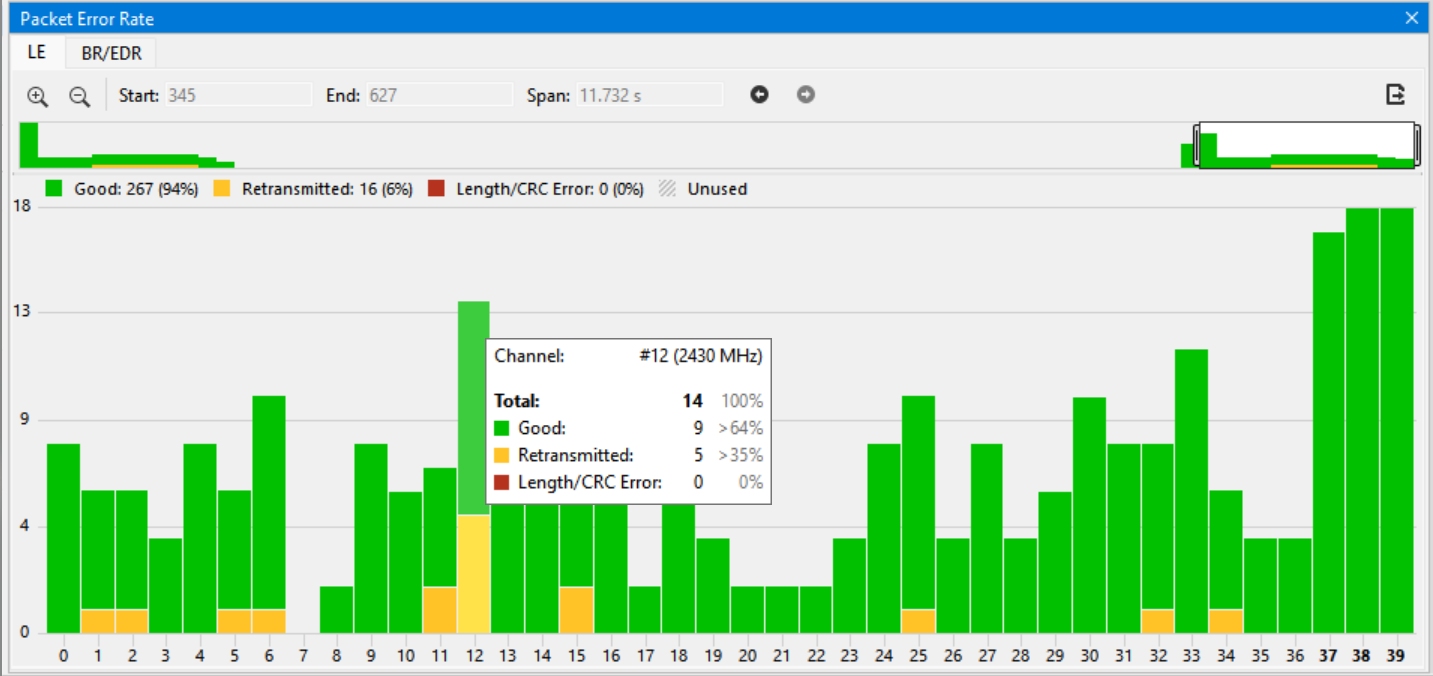
Packet Error Rate Stats assist in detecting bad communication connections. When a high percentage of re- transmits, and/or header/payload errors occur, careful analysis of the statistics indicates whether the two devices under test are experiencing trouble communicating, or the packet sniffer is having difficulty listening.
Generally, if the statistics display either a large number of re-transmits with few errors or an equal number of errors and re-transmits, then the two devices are not communicating clearly. However, if the statistics display a large number of errors and a small number of re-transmits, then the packet sniffer is not receiving the transmissions clearly.
You can access this window from View -> Packet Error Rate
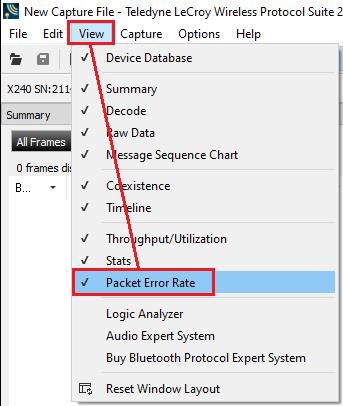
Packet Error Rate Statistics View by Channel
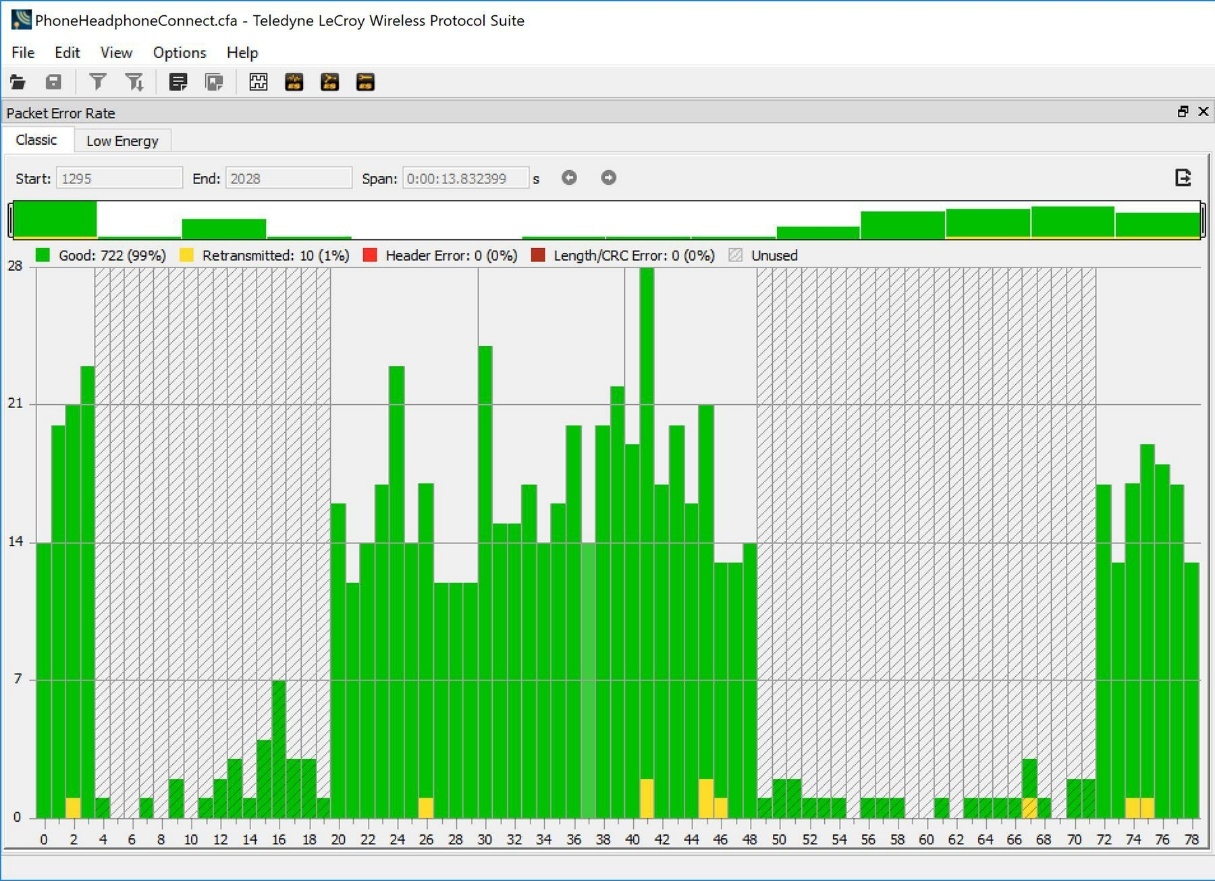
The Packet Error Rate (PER) Stats view provides a dynamic graphical representation of the Packet Error Rate for each channel. The dialog displays a graph for each Classic Bluetooth channel numbered 0 through 78 and for each Bluetooth Low Energy channel numbered 0 through 39. Similarly, a graph for Bluetooth BR/EDR data will show channel 0 through 78. You can scroll on the PER stats View using the mouse wheel. Each scroll step equals 1 bar on the graph. You can zoom on the graph by holding the CTRL key and using the scroll wheel on the mouse.
Each channel is rated:
-
Good
-
Retransmitted
-
Header Error
-
Length/CRC Error
-
Unused (Unused channels are channels omitted from adaptive frequency hopping or channel selection algorithms. The channel map in LMP_SET_AFH or LL_CHANNEL_MAP_IND packets identifies these unused channels.)
Bluetooth Classic Packet Error Rate
Bluetooth Low Energy Packet Error Rate