
The Bluetooth Timeline displays packet information with an emphasis on temporal information and payload throughput. The timelines also provide selected information from Main windows.
The timelines provide a rich set of diverse information about Bluetooth packets, both individually and as a range. Information is conveyed using text, color, graphic size, line type, and position.
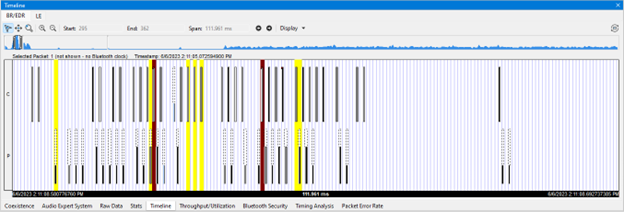
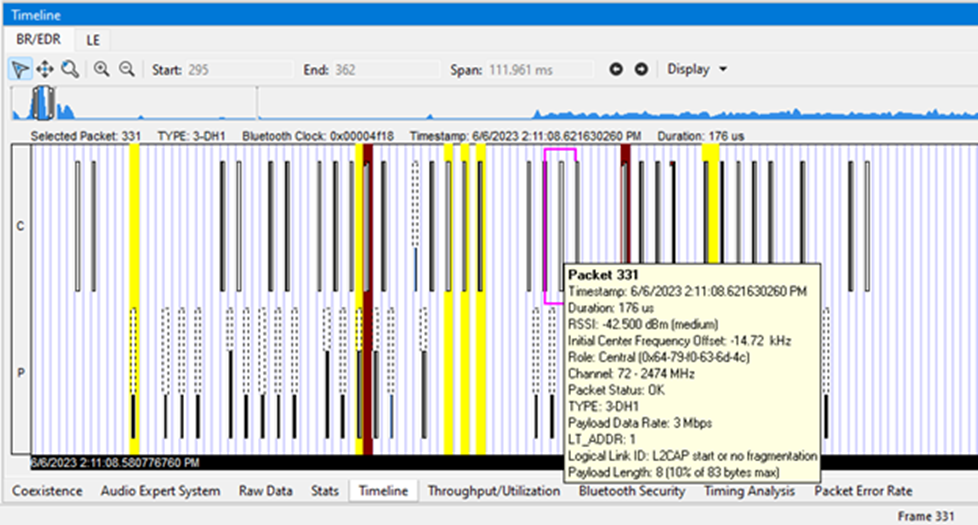
Bluetooth Timeline Packet Depiction
-
The timeline shows Bluetooth packets within a specific period of time.
-
Within each row there are two divisions: C (central) and P (Peripheral). Packets are placed on C or P depending on the data's role.
-
Placing the mouse pointer on a packet displays information about that packet in an information box.
-
Selecting a packet by clicking on it shows information about that packet above the timeline.
-
You can use the arrow keys to move to the next or previous packet. You can select multiple packets by dragging within the timeline or by holding the SHIFT key down while arrowing.
-
Using the mouse scroll wheel scrolls the timeline horizontally. You can also zoom by using a right click (which displays specific magnification values), using the + and - Zoom tools, or by selecting a value from the Zoom menu. Users can also Zoom IN/OUT by holding the CTRL key and scroll wheel on the mouse.
-
Packet height indicates speed (1, 2, or 3 Mb/sec). Packet length indicates duration (for reference, the duration of a slot is 625-µs). Packet height and length together indicate size (speed times duration).
A packet is drawn using the following components:
-
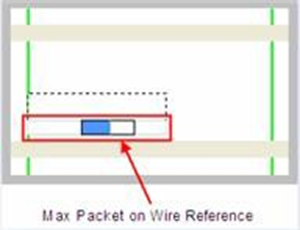
A “max packet on wire reference” rectangle (light solid lines). This indicates the packet in the air with a max payload.
-
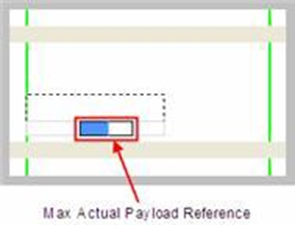
A “max actual payload reference” rectangle (dark solid lines). This indicates a max payload as would be extracted by the receiving device (if the payload in the air contains forward error correction (FEC), it is longer than the actual payload). The position of the beginning of the rectangle indicates where the payload begins in time.
-
An “actual payload” colored sub-rectangle (packet category-specific; blue here). This indicates the actual received payload with FEC (if any) removed. It is the beginning portion of the “max actual payload reference” rectangle. If the actual payload is of max size, the entire “max actual payload reference” rectangle is colored.
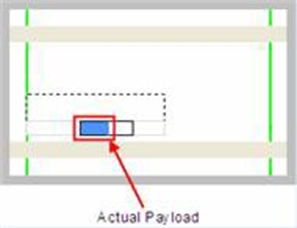
-
An “unused payload reference” sub-rectangle (always white). This indicates the unused portion of a maximum payload. It is the remaining portion of the “max actual payload reference” rectangle. The packet in the air does not leave room for this. It is indicated for reference only.
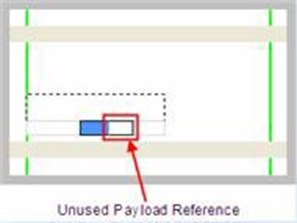
-
A “max speed reference” rectangle (dashed lines). This is used to extend the height to that of a 3 Mb/sec packet and appears only for packets whose speed is less than that. The packet shown here has a speed of 1 Mbit/sec because the height of the other rectangles is 1/3 of the total height.
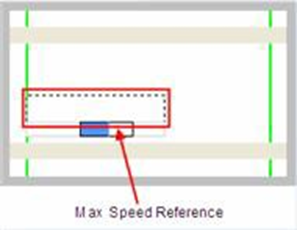
-
The part of the “max packet on wire reference” rectangle (light solid lines) that trails the “max actual payload reference” rectangle (dark solid lines) is partly packet in the air (if the payload on the wire contained FEC) and partly trailer (CRC, etc.). There is always a trailer, so there is always a little space (subject to round off error and pixel granularity) between the ends of the two rectangles.
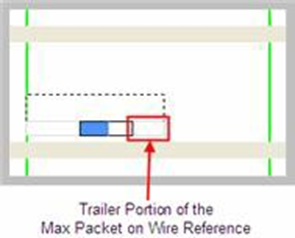
The table below shows how packets are colored.
Packet Type Colors
|
Packet Category |
Packet Types |
Color |
|
ALC |
DM1, DM3, DM5, DH1, 2-DH1, 3-DH1, DH3, 2-DH3, 3-DH3, DH5, 2-DH5, 3-DH5, AUX1 |
Black |
|
SCO |
HV1, HV2, HV3, DV |
Pink |
|
eSCO |
EV3, 2-EV3, 3-EV3, EV4, EV5, 2-EV5, 3-EV5 |
Purple |
|
LMP* |
DM1, DV |
Dark Blue |
|
FHS |
FHS |
Light Blue |
|
NULL |
NULL |
Light Gray |
|
POLL |
POLL |
Light Brown |
|
Filler |
Filler provided by Wireless Protocol Suite software |
Dark Gray |
|
*LMP is a protocol layer that uses either DM1 or DV packets. If a packet has an LMP layer, the LMP color is used instead of the packet type color. |
||
The table below summarizes the various ways in which packet information is presented.
Packet Information Presentation
|
Information |
Text |
Color |
Graphic size |
Position |
|
Packet Type |
X |
|
|
|
|
Packet Category |
|
X |
|
|
|
Protocol |
X |
X |
|
|
|
Time of occurrence |
X |
|
|
X |
|
Source device |
X |
|
|
X |
|
Duration |
|
|
X |
|
|
Size in bytes |
X |
|
X |
|
|
Size as a percent of max size for that packet type |
X |
|
X |
|
|
Speed |
|
|
X |
|
|
Status |
X |
|
X |
|
Timeline Packet Navigation and Selection
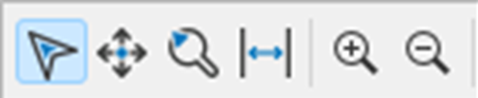
The application provides four distinct Navigation Modes that allow users to interact with the timeline and elements in the view. Each mode has specific functionality, offering flexibility and precise control over timeline navigation and element selection.
The navigation modes are applicable to all time-based views across the application: Bluetooth Classic and LE timelines, Coexistence view, Throughput/Utilization View, Timing Analysis view.
Selection Mode
In Selection mode 
To select a single packet, click on it with the left mouse button.
To select multiple elements, hold the SHIFT key while clicking on each packet or in the direction of the selection which will include packets in between.
Press and drag the left mouse button to draw a selection box, selecting all elements between the start and end points of the drag action.
Pan Mode
Pan Mode 
While in Pan Mode, the mouse pointer changes to an “open hand” shape while hovering over the timeline.
Press and hold the left mouse button anywhere on the timeline, then drag to move the timeline horizontally. The mouse pointer shape will change to a “closed hand” until the left mouse button is released.
Zoom Mode
In Zoom Mode 
While in Zoom mode the mouse pointer changes to a “magnifier” shape while hovering over the timeline.
Press and hold the left mouse button and then drag to designate a time range. The view will zoom into the selected time span upon release, allowing for a detailed view of that section.
Press the Escape key to cancel the current zoom.
Use Ctrl+Z or Ctrl+Y to undo or redo the previous zoom actions.
Measurement Mode (available for Timing Analysis view only)
Measurement Mode 
Press and hold the left mouse button and drag to create a measurement element. This element displays the time difference between the start and end points of the drag.
Measurement can be modified after it is placed.
Switching Between Modes
Users can switch between the available Navigation Modes either through the tool buttons or by using the following keyboard shortcuts for quick mode switching.
ALT + S for Selection Mode
ALT + P for Pan Mode
ALT + Z for Zoom Mode
ALT + M for Measurement Mode
Common Navigation
In addition to the specific Navigation Modes, the application provides various common navigation actions that enhance timeline interaction and allow for efficient control of selection, zooming, and scrolling.
Zoom tools
Zoom tools zoom in 

This makes it possible to zoom in or out for a specific packet or area of the timeline.
Mouse Wheel Zoom
Scrolling the mouse wheel will adjust the zoom level on the timeline, allowing for quick zoom in and zoom out functionality. The zooming is centered at the mouse position on the viewport area.
Horizontal Scrolling with CTRL
Holding the CTRL key while scrolling the mouse wheel will scroll the timeline horizontally, providing fast access to different parts of the timeline without switching modes.
Vertical Scrolling with SHIFT
Holding the SHIFT key while scrolling the mouse wheel will scroll the view vertically.
Home Button
Pressing the Home key will immediately jump the view to the start of the timeline.
End Button
Pressing the End key will immediately jump the view to the end of the timeline.
Arrow Left Key
Pressing the Arrow Left key will select the previous element (if one is selected) or scroll the timeline horizontally to the left if no element is currently selected.
Arrow Right Key
Pressing the Arrow Right key will select the next element (if one is selected) or scroll the timeline horizontally to the right if no element is currently selected.
CTRL + Arrow Left Key
Pressing CTRL + Arrow Left will jump to the previous error packet.
CTRL + Arrow Right Key
Pressing CTRL + Arrow Right will jump to the next error packet.
SHIFT + Arrow Left Key
Pressing SHIFT + Arrow Left will extend the current selection to include the previous packet.
SHIFT + Arrow Right Key
Pressing SHIFT + Arrow Right will extend the current selection to include the next packet.
CTRL + A
Pressing CTRL + A will select all packets on the timeline.
Backspace Key
Pressing the Backspace key will jump the timeline to the currently selected packet.
Escape Key
Pressing the Escape key will hide the currently displayed tooltip.
Arrow Up Key
Pressing the Arrow Up key will zoom in.
Arrow Down Key
Pressing the Arrow Down key will zoom out.
CTRL + Plus
Pressing CTRL + Plus will zoom in.
CTRL + Minus
Pressing CTRL + Minus will zoom out.
Page Up Key
Pressing the Page Up key will scroll the timeline forward.
Page Down Key
Pressing the Page Down key will scroll the timeline backward.
Bluetooth Timeline Visual Elements
The Bluetooth Timeline consists of the following visual elements:
-
The timeline shows Bluetooth packets within a specific period.
-
Within each row, there are two divisions: C (central) and P (Peripheral). Packets are placed on Cor P depending on source of the data within the link.
-
Placing the mouse pointer on a packet displays information about that packet in an information box.
-
Selecting a packet by clicking on it shows information about that packet above the timeline.
-
Packet height indicates speed (1, 2, or 3 Mb/sec). Packet length indicates duration (for reference, the duration of a slot is 625-µs). Packet height and length together indicate size (speed times duration).
-
Rows of Bluetooth Slots: Each slot begins at the left edge of the vertical blue bar. There are two Bluetooth clocks per slot. Each slot represents 0.000625 seconds, or 625 µs.
-
C and P labels: Within each row, central and central packets are indicated on the left side of the row. By default, all possible central devices (there can be up to 7) are put on the P sub-row but checking the Show central LT_ADDR checkbox shows all existing central device sub-rows with numbered labels (some or all of S1, S2, …, S7).
-
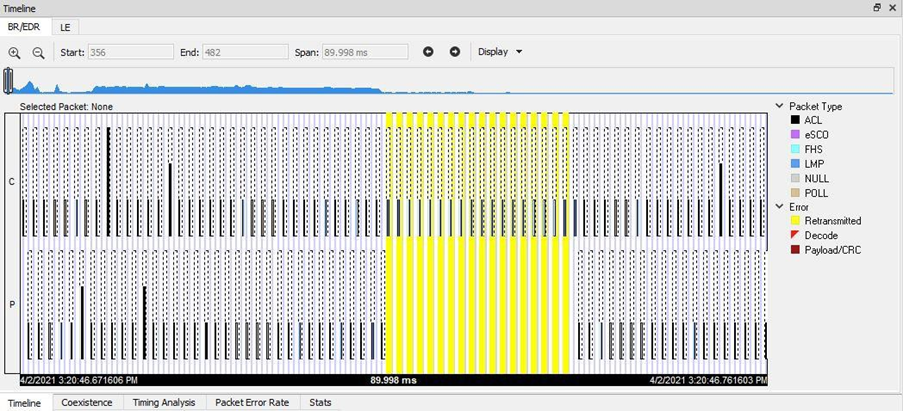
Contents of Status Bar: The packet info line appears just above the timeline and displays information for the currently selected packet(s). If only one packet is selected, this information consists of the packet number, packet type, Bluetooth clock (Bluetooth only), Timestamp, and Duration. Duration is shown as "Unknown" when the selected packet has an error.
If multiple packets are selected, this information consists of the packet range, the Bluetooth clock delta (Bluetooth only), the Timestamp delta, and Span. Span is shown as "Unknown" when the last packet in the selected range has an error since its duration is unknown. A user can use these to verify the average throughput calculations. Selected packets are bounded by a magenta rectangle.
-
Floating Information Window (aka Tooltip): The information window displays when the mouse cursor hovers on a packet (not slot). It persists as long as the mouse cursor stays on the packet or tooltip. For Bluetooth, the tooltip shows the packet number (in bold) and the Baseband layer decode from the decode pane of the Main windows (with the percentage of the Payload Length max added).
Discontinuities are indicated by cross-hatched slots. See Bluetooth Timeline Discontinuities (below).
-
Packet Status: Packet status is indicated by color codes. A yellow slot indicates a re- transmitted packet, a dark red slot indicates a CRC error, and a small red triangle in the upper-left corner of the packet (not the slot) indicates a decode error.
-
Right-Click Menu: The right-click menu provides zooming and tool selection.
-
Graphical Packet Depiction: Each packet within the visible range is graphically depicted. See Bluetooth Timeline Packet Depiction (above).
-
Show Running Average: Selecting this check box shows a running average in the Throughput graph as an orange line.
-
Show central LT_ADDR: Selecting this checkbox displays the Peripheral LT_ADDR in the timeline row labels.
-
The raw timestamp value is calculated by:
Windows: the number of 100-nanosecond intervals since January 1, 1601, 00:00:00 UTC
macOS and Linux: the number of seconds since January 1, 1970, 00:00:00 UTC
Show Legend
The legend can be turned on/off from the Display menu in the toolbar. The settings are saved between sessions.
Bluetooth Timeline Discontinuities
The following figure depicts a discontinuity between two packets.
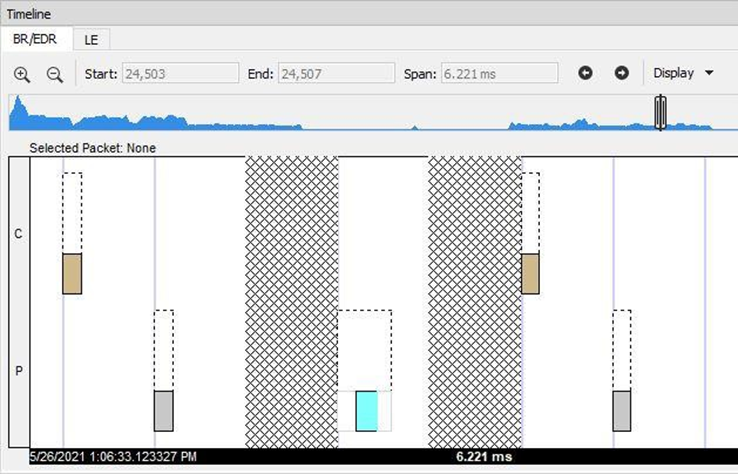
To keep the timeline and the throughput graph manageable, big jumps in the Bluetooth clock are not represented linearly. Instead, they are shown as discontinuities. A discontinuity is said to exist when the Bluetooth clock goes forward more than two (2) seconds or backwards any amount. A discontinuity is indicated by a cross-hatched slot in the timeline and a corresponding vertical dashed line in the throughput graph. The Bluetooth clock can jump forward when capture is paused or when there is a role switch (in a role switch, a different device becomes central, and since each device keeps its own Bluetooth clock, the clock can change radically), and backwards when there is a role switch or clock rollover.
The raw timestamp value is calculated by:
Windows: the number of 100-nanosecond intervals since January 1, 1601, 00:00:00 UTC
macOS and Linux: the number of seconds since January 1, 1970, 00:00:00 UTC
Low Energy (LE) Timeline
The Bluetooth Low Energy Timeline displays packet information with an emphasis on temporal information and payload throughput. The timeline also provides selected information from Summary Pane.
The timeline provides a rich set of diverse information about Low Energy packets, both individually and as a range. Information is conveyed using text, color, packet size, and position.
In computing throughput, packets that have a CRC error are excluded.
Low Energy Timeline Visual Elements
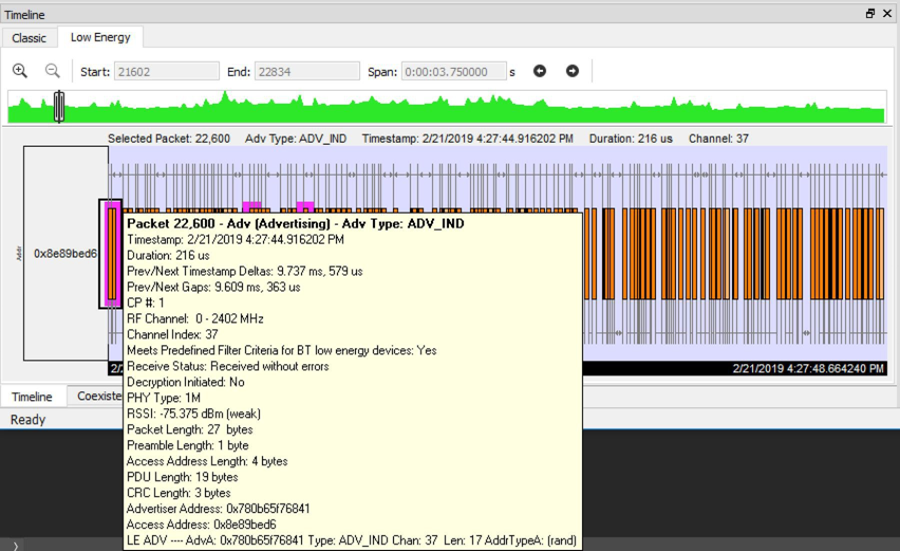
The Low Energy Timeline consists of the following visual elements:
-
Time Markers - Time markers indicated by vertical blue lines are shown at 1.25 ms intervals. The markers are provided to help visualize the timescale and are also useful when using dual-mode chips that do BR/EDR and LE at the same time. Time markers snap to the beginning of the first data packet by default, but they can be snapped to the beginning or end of any packet by right-clicking on a packet and selecting Align Time Marker to Beginning of Packet or Align Time Marker to End of Packet. All other markers will shift relative to that new reference point.
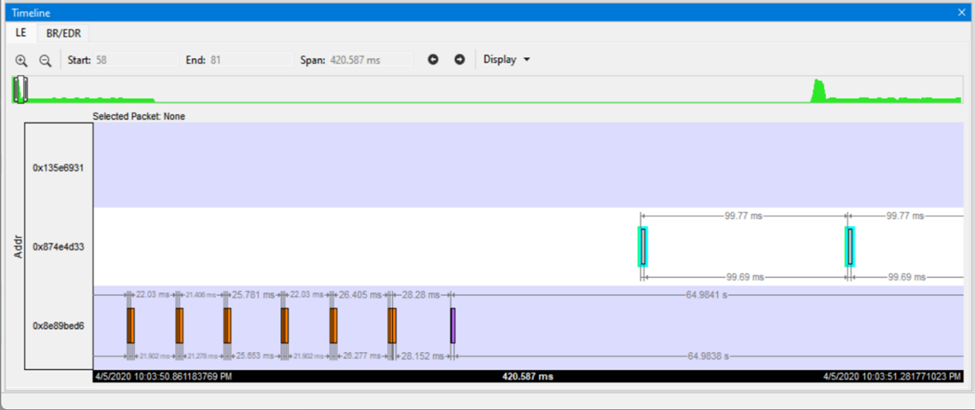
Timestamp - The beginning and ending timestamp for each segment is displayed beneath each segment. When showing multiple segments, the beginning timestamp is the same as the ending timestamp of the previous segment.
In addition to the timestamps, the segment information bar shows the zoom value in the center of the bar.
The raw timestamp value is calculated by:
Windows: the number of 100-nanosecond intervals since January 1, 1601, 00:00:00 UTC
macOS and Linux: the number of seconds since January 1, 1970, 00:00:00 UTC
-
Packet Info Line - The packet info line appears just above the timeline and displays information for the currently selected packet.
-
When you select multiple packets, the info line includes:
o Gap - duration between the end of the first selected packet and the beginning of the last selected packet.
o Timestamp Delta - Duration between the beginnings of the first and last packets selected.
o Span - Duration between the beginning of the first selected packet and the end of the last selected packet
-
Floating Information Window (aka Tooltip) - The information window displays when the mouse cursor hovers on a packet. It persists as long as the mouse cursor stays on the packet.
-
Discontinuities - Discontinuities are indicated by cross-hatched slots. See the Bluetooth Timeline Discontinuities section (above).
-
Packet Status - Packet status is indicated by color codes.
-
Right-Click Menu - The right-click menu provides zooming and time marker alignment.
-
Graphical Packet Depiction - each packet within the visible range is graphically depicted. See the Bluetooth Timeline Packet Depiction (above).
Show Legend: The legend can be turned on/off from the Display menu in the toolbar. The settings are saved between sessions.
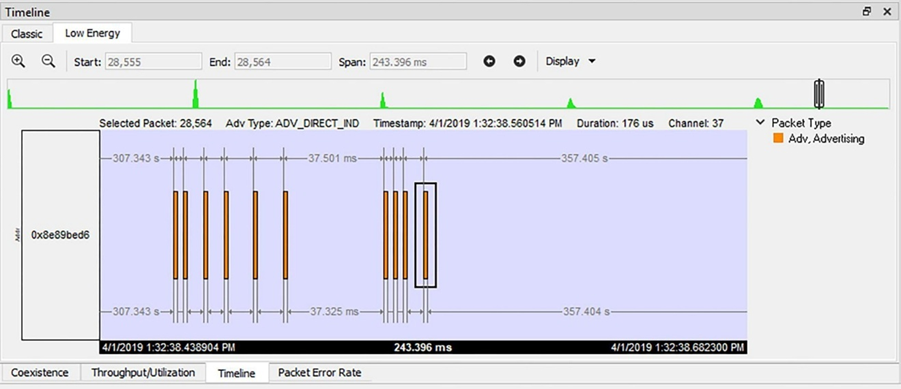
Low Energy Timeline Zooming
In Wireless Protocol Suite, the user can select the icon + and - on the toolbar of view which are located to the left of the inputs start/end/span to zoom in and zoom out. Also, the user can use right-click menu of view. The following menu will pop up to select the amount of time to be displayed.
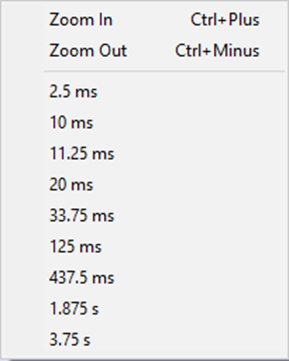
Zoom In/Out can also be achieved by scrolling the mouse wheel.
See Timeline Packet Navigation and Selection (above) for navigation modes detailed description.