
The tools control the display of the Timeline View. Detailed information on how to use the tools is contained in Timing Analysis Timeline View.

Tools Pane Selections
|
Icon |
Selection |
Description |

|
Zoom In |
Clicking on these buttons will zoom the Timeline View in or out. The buttons will turn gray when the timeline display is zoomed to at either its maximum or minimum. |

|
Zoom Out |
|

|
Start Packet Number |
Shows start packets which could be found in shown time range. |

|
End Packet Number |
Shows end packets which could be found in shown time range. |

|
Time Interval |
Displays shown in timeline view time interval. |

|
Move Backward |
Scrolls the viewport across the Navigation Bar. |

|
Move Forward |
Scrolls the viewport across the Navigation Bar. |
|
|
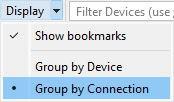
Display menu |
The ‘Show bookmarks’ menu allows user to show/hide bookmarks on Timing Analysis. By default, bookmarks will be shown. The state of menu item does not save between sessions. The Group by Device/Connection menu items allow switching between grouping modes for rows. In Device mode a timeline row displays frames associated with a device. In Connection mode rows are grouped together to display connections. |
|

|
Line addresses/names filtering |
Allows you to filter lines in Timing Analysis by addresses or Nicknames/Friendly names. Addresses delimiters (“:”, “-“) will be ignored. User can input multiple addresses filters using “;”. All filters will be applied using “or”. |

|
Selector |
Allows you to select technologies which will be shown in Timing Analysis view. |