
In general, throughput is the rate of successful message delivery over a communication channel. In this case, we are interested in the rate of successful message delivery over a Bluetooth data channel.
The figure depicts the Throughput display with the Average Throughput and the Payload Throughput for both Classic and Low Energy Bluetooth traffic.
In computing throughput, payload is not counted from Bluetooth packets that have a CRC error (dark red slot) or that are a retransmission (yellow slot).
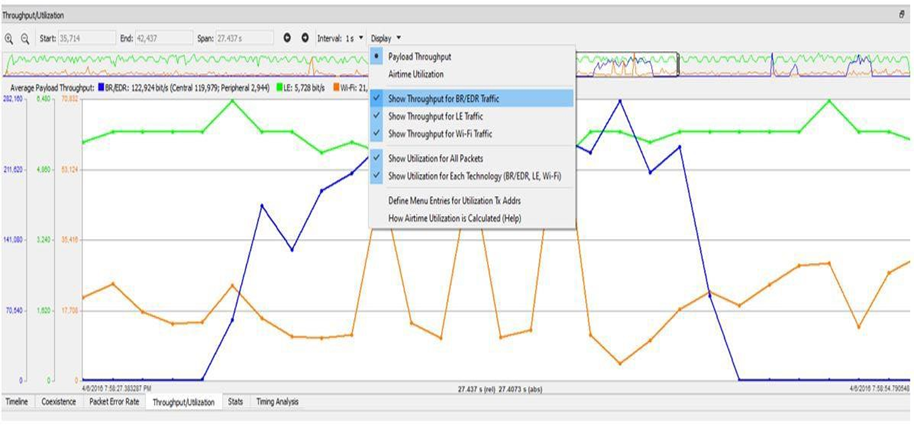
Average Throughput is the total payload over the entire session divided by the total time. Total time is calculated by taking the difference in timestamps between the first and last packet. In Bluetooth, timestamp difference is used instead of Bluetooth clock count because timestamp difference is immune to role switches. However, this can result in inaccuracies when the duration is small enough that a coarse timestamp granularity is significant.
-
Average Throughput is shown as 0 when there is only one packet, because in that case the timestamp difference is 0 and an average cannot be computed.
-
Duration is from the beginning of the first packet to the end of the last packet.
-
Duration for average throughput is from the beginning of first packet to end of last packet. If a single packet is selected, the duration of that packet is used.
-
Average Throughput is shown for all devices, central devices, and central devices. The user can move left or right in the Throughput Pane using the mouse wheel.
The user can also Zoom using the + and - buttons or using the ctrl + mouse scroll wheel just like in other panes.
Airtime Utilization
Airtime Utilization is the percentage of the duration of a data point that is occupied by applicable packets. A packet is “applicable" if it has the specified address or attribute as described below. Bad packets are excluded. Retransmitted packets are included.
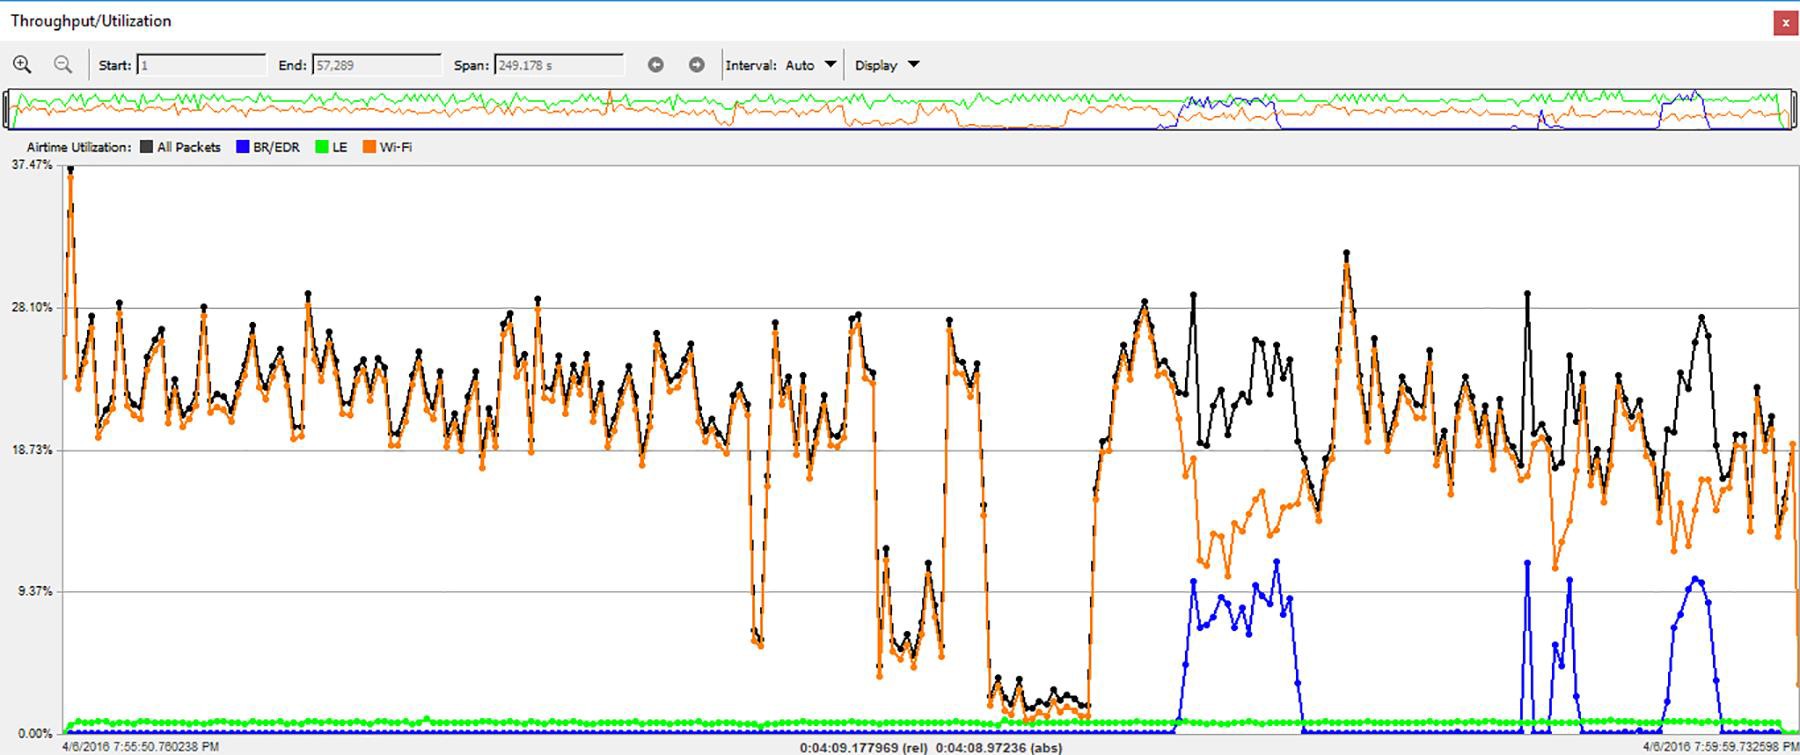
Utilization Graph showing plots for all packets regardless of technology (black), all BR/EDR packets (blue), all LE packets (green), and all Wi-Fi packets (orange). Plots for individual devices can also be shown.
For example, if the data point duration is 1 ms and the total duration of applicable packets within that data point is 200us, the airtime utilization is 200us / 1 ms = 20%. The tooltip of each data point shows both the duration of the data point and the total duration of the applicable packets within that data point.
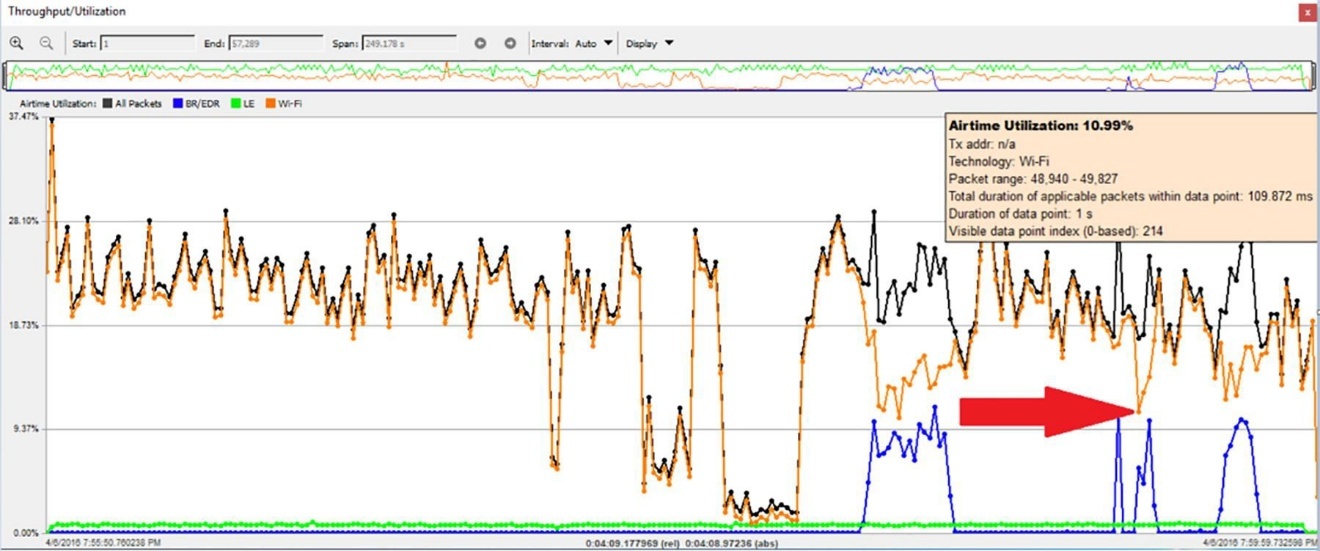
Tooltip displayed when mouse hovered on the data point indicated by the red arrow.
For a single device the airtime utilization cannot exceed 100% since a device sends only one packet at a time. If the data point duration is small enough that it's filled by an applicable packet or a portion of an applicable packet, then the airtime utilization is 100%. For larger data point durations, the airtime utilization will always be less than 100%. To display the airtime utilization for a single device, define a menu entry for it by selecting Define Menu Entries for Utilization Tx Address in the Display menu. Up to 10 such menu entries can be defined. They appear in the Display menu after starting a new live capture or opening a capture file. They persist until removed by the user.
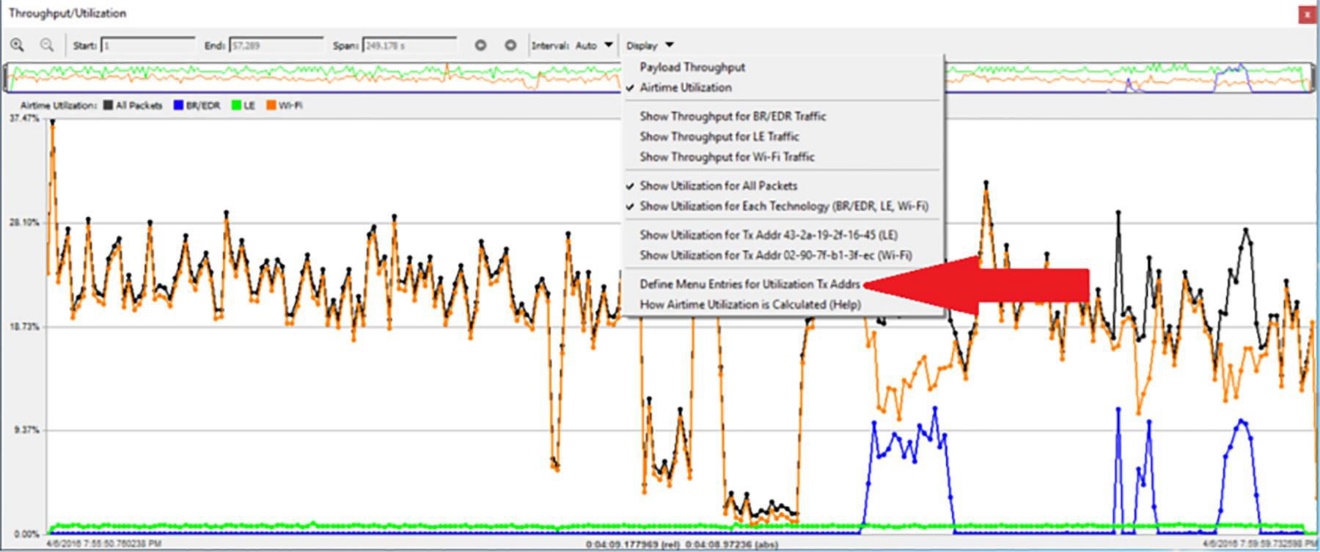
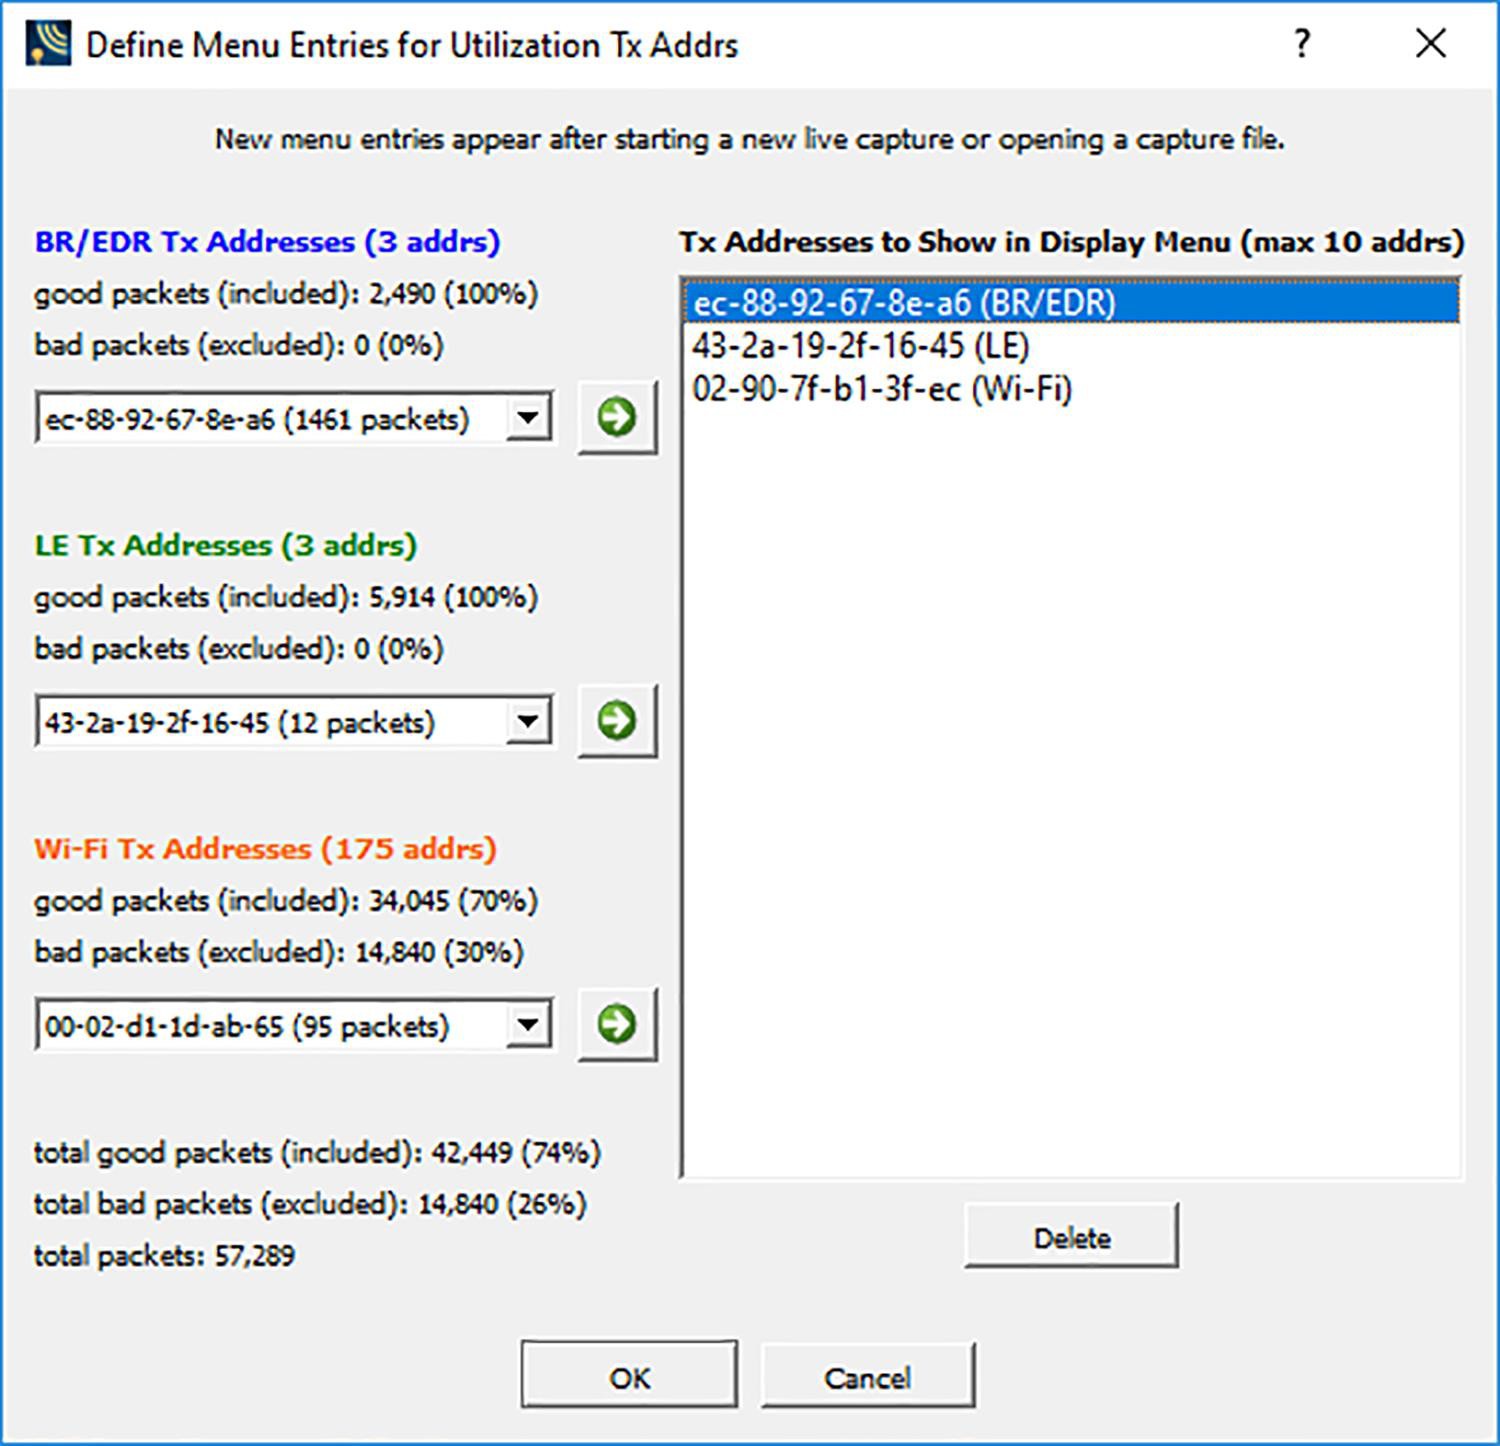
The “Define Menu Entries for Utilization Tx Address” dialog is used to define menu entries to show airtime utilization for individual devices. Here there are two existing entries and a new entry is being added.
For multiple devices, the airtime utilization can exceed 100% since the utilizations of each device are added together. This is the case with the "all packets" and "all packets in each technology" plots, which are displayed by selecting Show Utilization for All Packets and Show Utilization for Each Technology (BR/EDR, LE, Wi-Fi) respectively in the Display menu. The screenshots above show plots for all packets regardless of technology (black), all BR/EDR packets (blue), all LE packets (green), and all Wi-Fi packets (orange). The Tx Addr field in the tooltip is set to “n/a” in all those cases.
The plot for a single device uses the same technology-specific color coding. The Tx Addr field in the tooltip shows the device address.
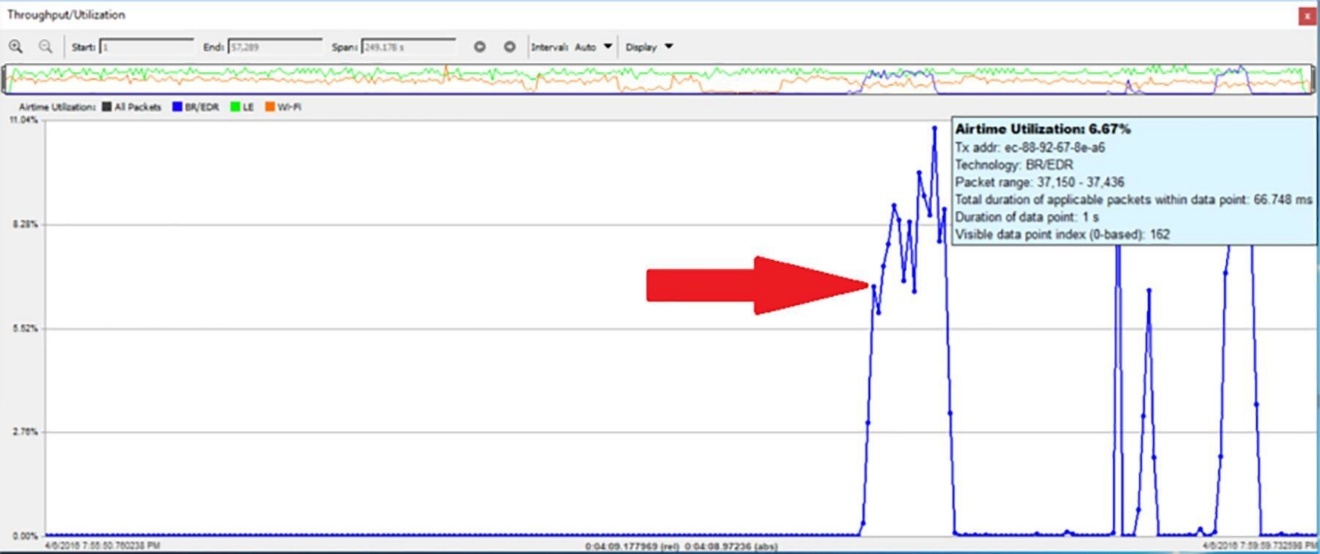
Tooltip displayed for a plot of a single device when mouse hovered on the data point indicated by the red arrow.
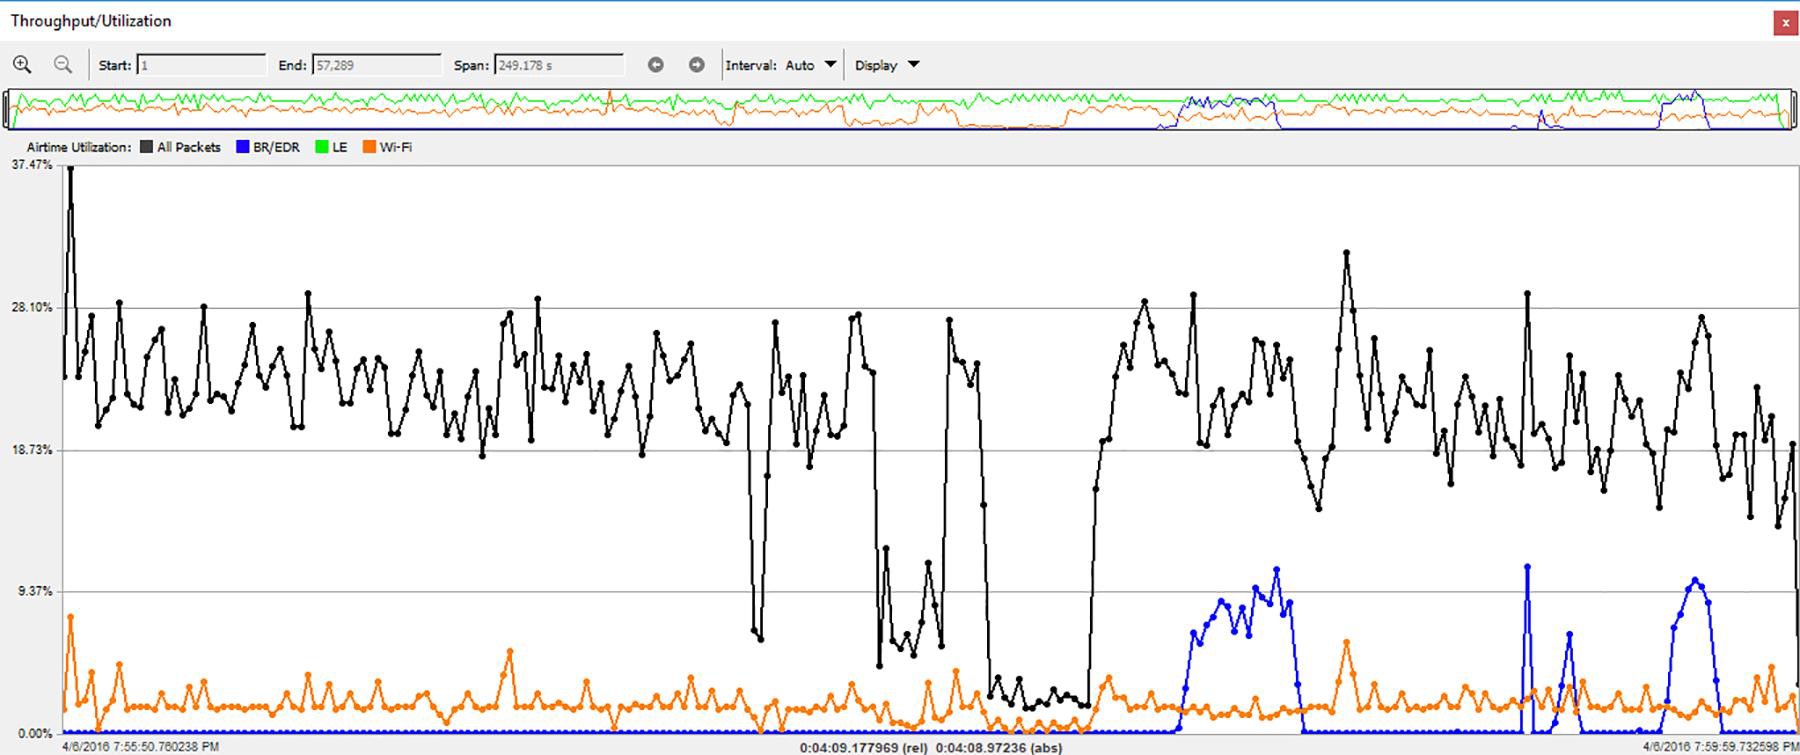
The plot of the same device plus plots for all packets (black) and for a Wi-Fi device (orange). The percentage scale on the y-axis adjusts automatically.
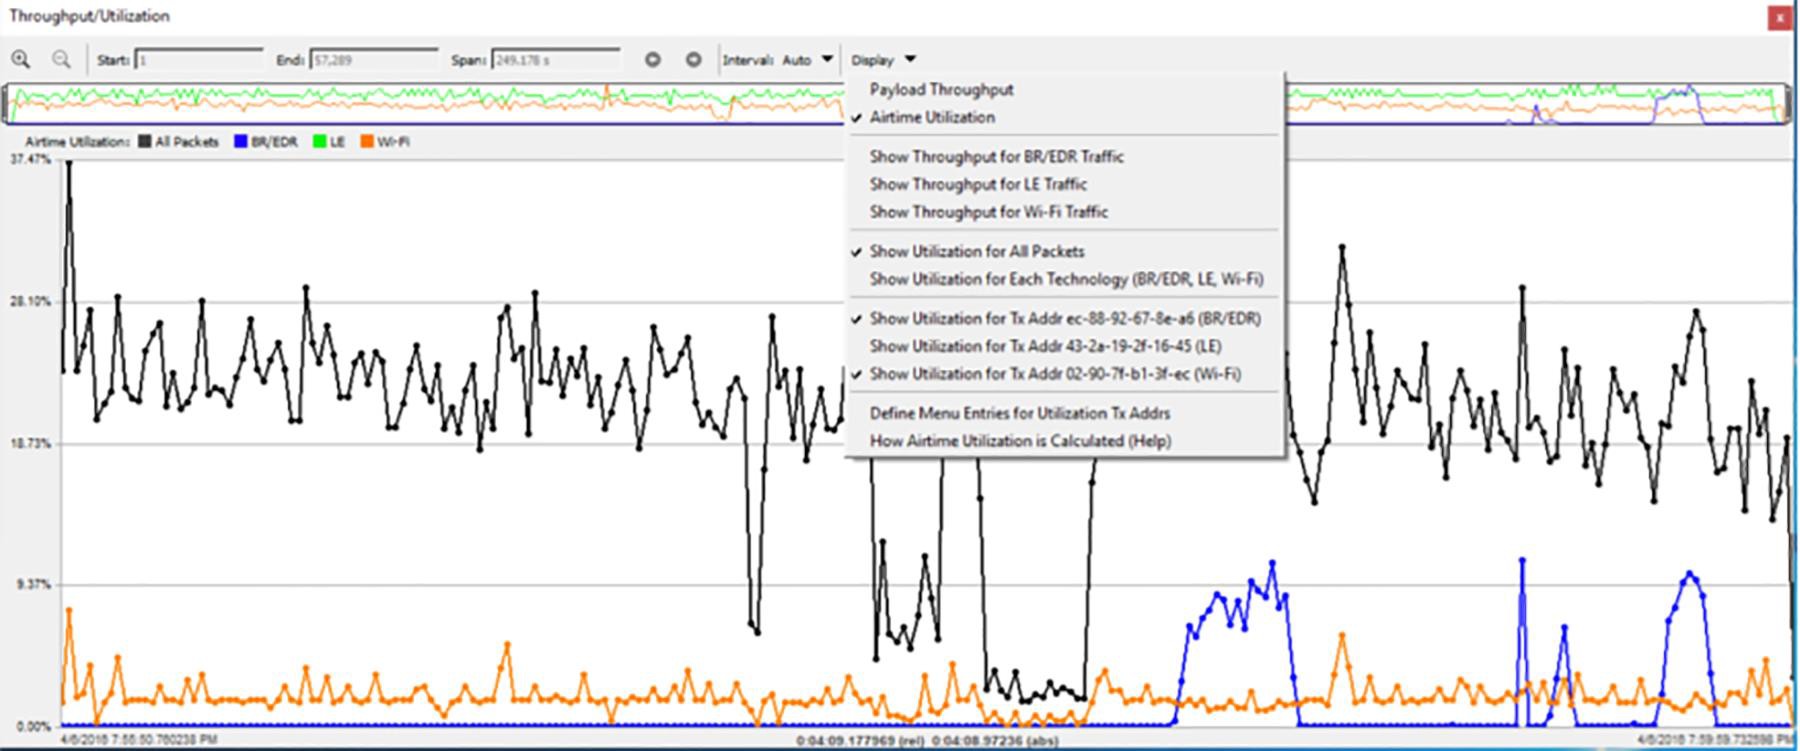
The Display menu selections that produce these plots.