Coexistence 2.4 GHz
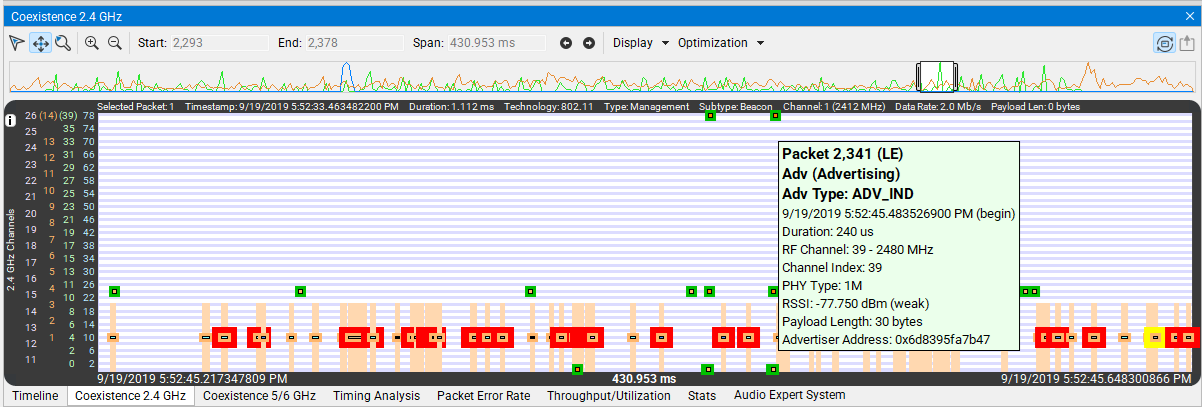
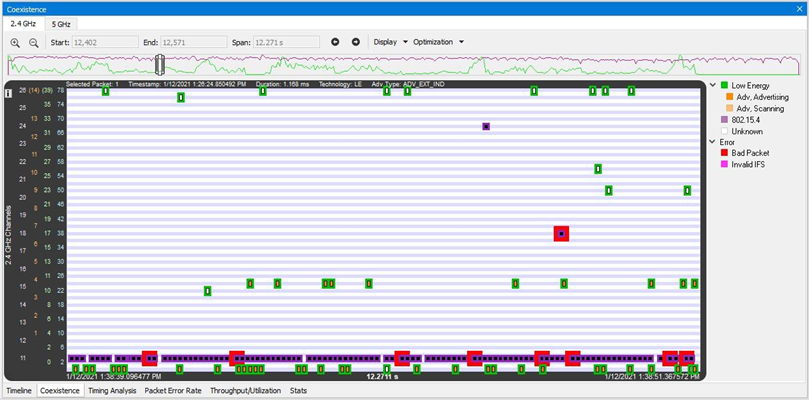
The Coexistence 2.4 GHz View displays Classic Bluetooth, Bluetooth Low Energy, Wi-Fi and 802.15.4 packets in 2.4 GHz band by channel and time. Access this view by clicking its tab above the Status Bar at the bottom of the Main Window.
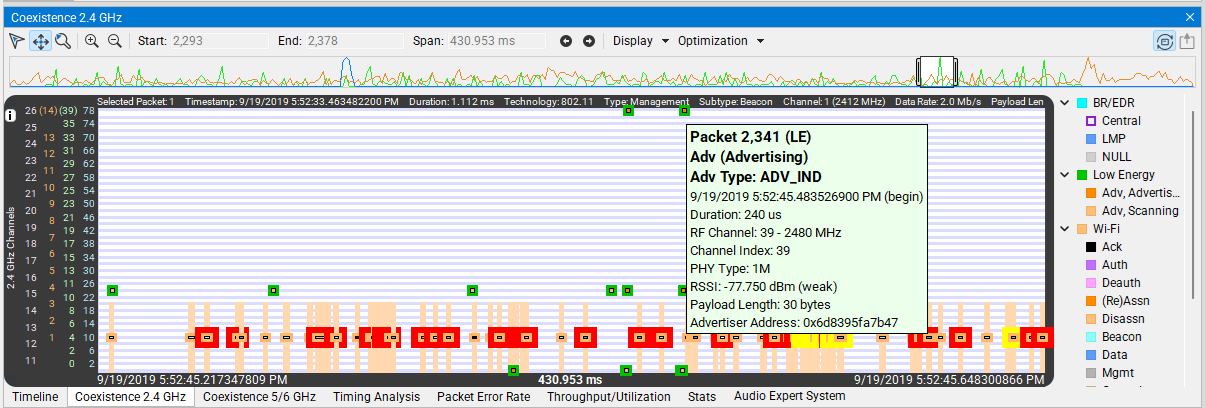
Show Legend: The legend can be turned on/off from the Display menu in the toolbar. The settings are saved between sessions.
Packets
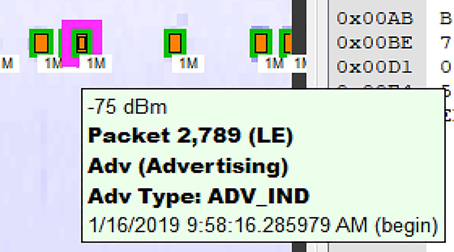
If you select a packet in the Coexistence 2.4 GHz View, you see..
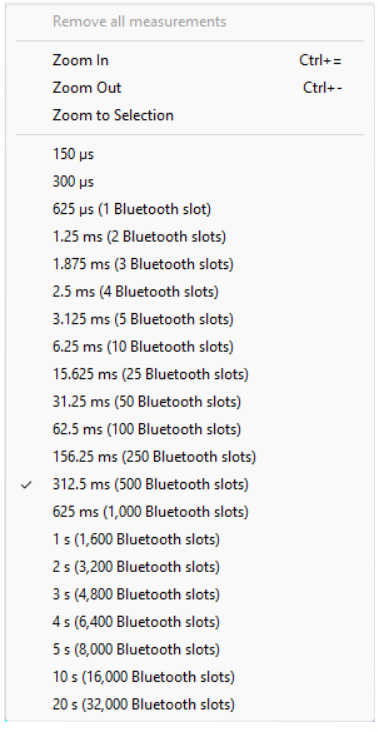
If you right click on a Packet, the following context menu will pop up.
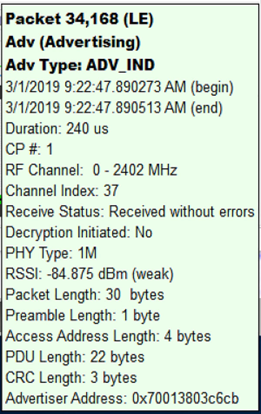
If you select the Show Full Tooltip, you will get details about the Packet.
Zoom In/Out can also be achieved by holding the CTRL key and moving the scroll wheel on the mouse.
Coexistence 2.4 GHz View - Spectrum
Analyzer hardware has the option to sample the 2.4 GHz RF Spectrum at the unit's antenna connector. The Spectrum data represents the Received Signal Strength Indicator (RSSI). Spectrum data is synchronized in time to the captured Bluetooth packets and is displayed in the Coexistence View 2.4 GHz Timeline. The Spectrum power level is shown as a "heat map" behind the timeline packets. The "heat map" appears in shades of blue with darker blues representing higher power levels and lighter blues representing lower power levels (white represents the lowest power level). The darkest shade of blue represents -15dBm and above, while white represents -100 dBm and below.
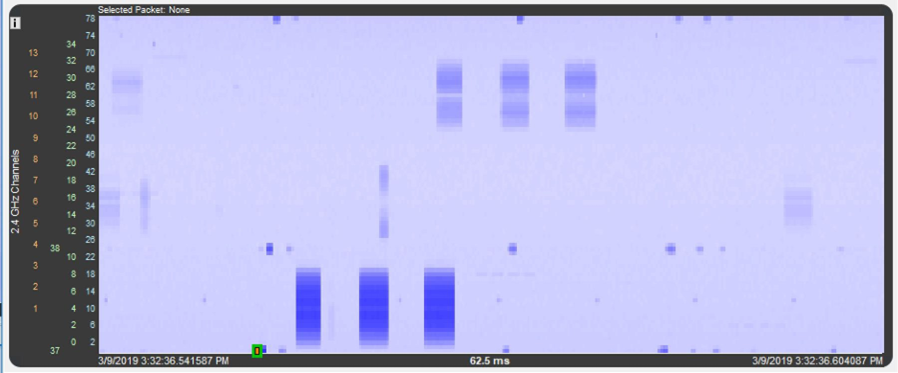
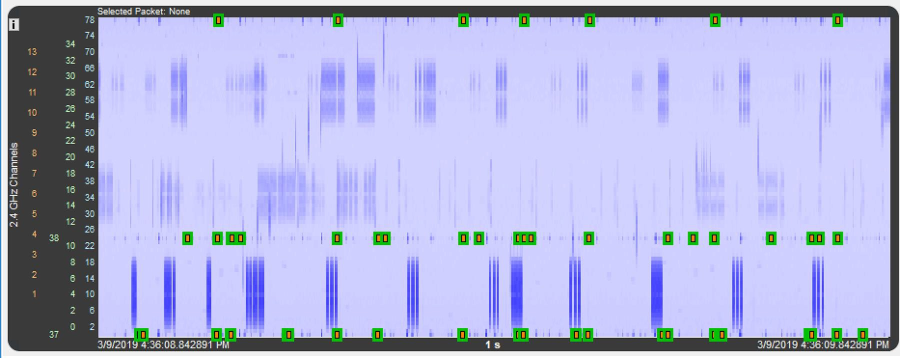
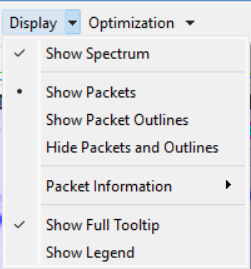
The Spectrum heat map view is controlled from the Spectrum menu in the Display dropdown menu. If Spectrum data is available, the Spectrum heat map is shown with the packets by default. To hide the Spectrum data heat map, uncheck the Show Spectrum option.
When displaying the heat map, the user can control how the packets are displayed. The following table describes the options for packet display. These options are mutually exclusive and they are available only when Show Spectrum is checked.
Spectrum Menu Packet Display Options
|
Option |
Description |
|
Show Packets |
Displays each packet. Tooltips, packet text, and selection boxes are available as usual. |
|
Show Packet Outlines |
Displays an outline of each packet. In this mode the Spectrum data comprising each packet is clearly visible and indicated. Tooltips, packet text, and selection boxes are available as usual. |
|
Hide Packets and Outlines |
Packets and packet outlines are not displayed. Tooltips, packet text, and selection boxes are available as usual. |
Show Legend
The legend can be turned on/off from the Display menu in the toolbar. The settings are saved between sessions.
Coexistence 5/6 GHz View
The Coexistence 5/6 GHz functionality has its own dedicated view, accessible by clicking its tab above the Status Bar at the bottom of the Main Window (it was previously a tab within the Coexistence View group).
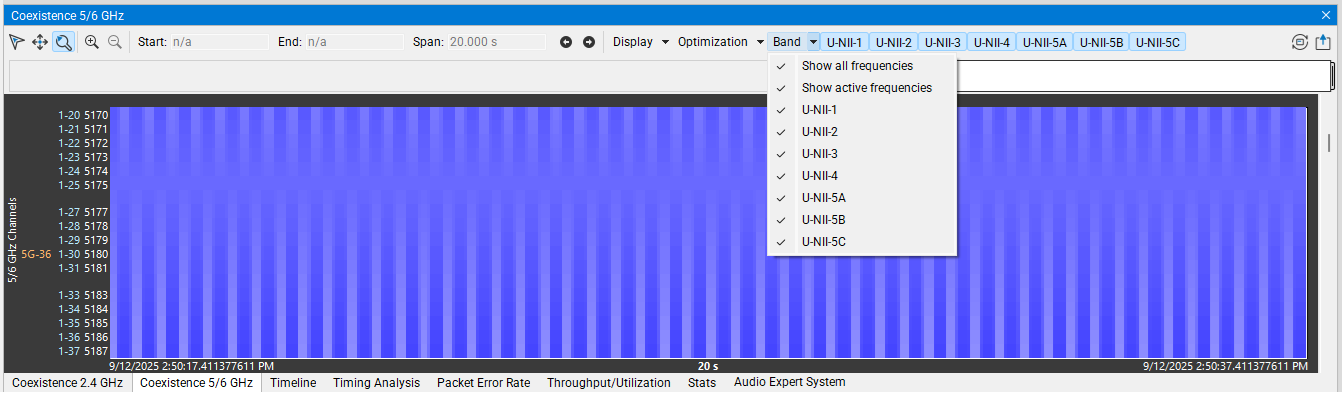
This view displays Wi-Fi 5 GHz and spectrum for U-NII bands 1 through 5. It largely resembles the Coexistence 2.4 GHz View, maintaining the same packet rendering style, consistent navigation, and the available Display and Optimization options:
Major Features:
-
The view is able to render spectrum taken from 7 U-NII bands, spanning 1276 frequency channels. Vertical scrolling is supported for this purpose.
-
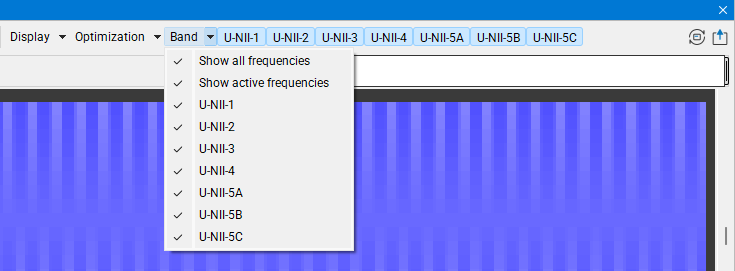
The user may select which bands to display either by using the Band menu or by enabling the corresponding switch on the view’s toolbar: