
Stats View
Introduction
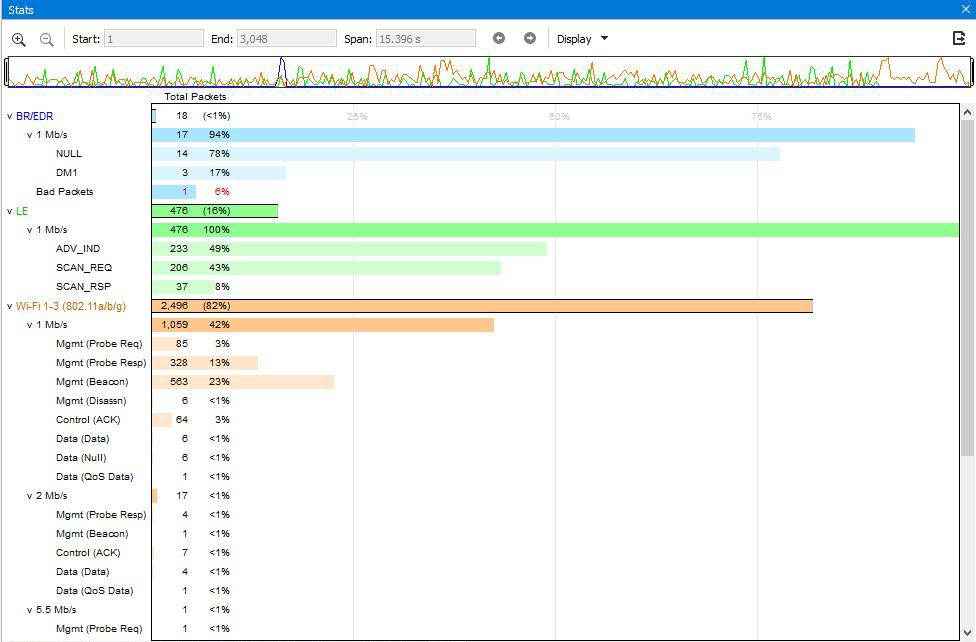
The Stats View is a dockable and scrollable pane that shows packet counts and packet count percentages as both text and a bar graph for each technology and for each data rate, NSS (Number of Spatial Streams), MCS (Modulation Coding Scheme), and packet type within each technology. Retransmits can by optionally indicated...
Technologies
Supported technologies are BR/EDR, LE, Wi-Fi 1-3 (802.11a/b/g), and Wi-Fi 4 (802.11n).
In BR/EDR, LE, and Wi-Fi 1-3, packet types are grouped by data rate. Data rates are shown in ascending order.
In Wi-Fi 4, packet types are grouped by NSS (Number of Spatial Streams) and MCS (Modulation Coding Scheme). In each technology, bad packets are shown on a separate row.
Retransmits
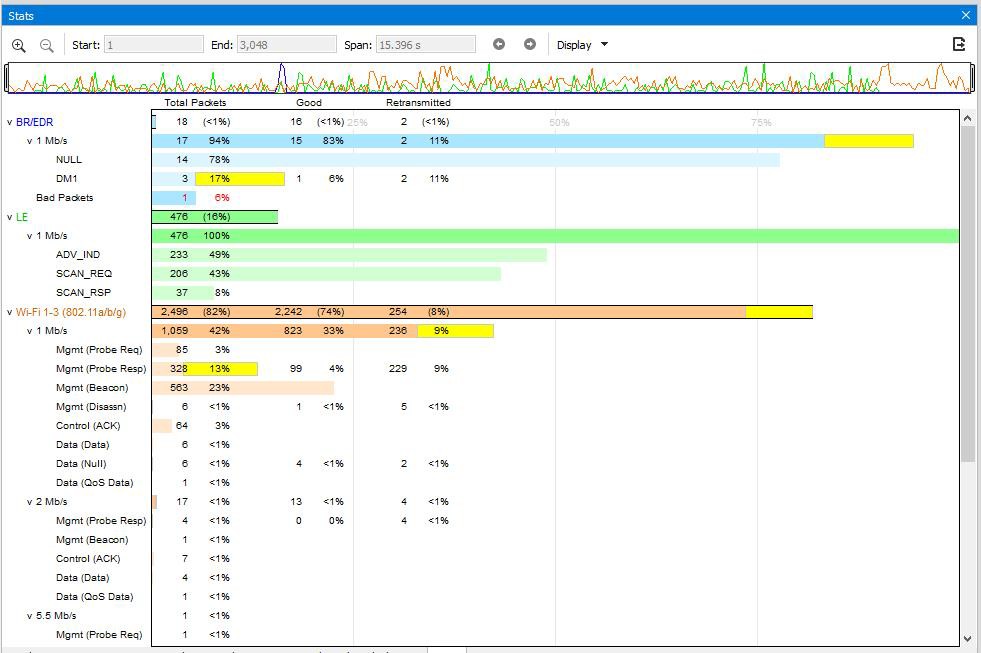
Retransmits are optionally indicated by selecting Indicate Retransmits in the Display menu. When retransmits are being indicated, the overall length of each bar doesn’t change, but the ending portion of it becomes yellow to indicate the percentage of retransmits (if any).
Percentages and Packet Counts
All packet count percentages in parentheses are calculated with respect to all packets in the entire capture. Such percentages are used only in technology rows ("BR/EDR", "LE", "Wi-Fi 1-3", and "Wi-Fi 4").
All other packet count percentages are calculated with respect to all packets in the associated technology.
The packet count of each row is equal to the sum of the packet counts in the rows that are grouped below it at the next indentation level.
The packet count of a Total Packets entry is equal to either the sum of its good packets and retransmitted packets or, in the case of a Bad Packets row, the number of bad packets.
Percentages are shown as rounded whole values except that a value between 0% and 1% exclusive is shown as "<1%", and a value between 99% and 100% exclusive is shown as ">99%". This ensures that "0%" is shown only when the packet count is 0, and that "100%" is shown only when the packet count is all applicable packets.
Since percentages are rounded, a sum of percentages can appear to be wrong. For example, a particular data rate's percentage can be displayed as 47% when the percentages of its packet types are displayed as 30% and 16% if, for example, the unrounded percentages of the packet types are 30.32% and 16.47% which equals 46.79% which rounds to 47%.
Graph Bars
A graph bar consists of either (1) good packets and/or retransmitted packets, or (2) only bad packets in the case of a Bad Packets row.
A Bad Packets bar (1) never indicates retransmits, and (2) is color-coded by technology (blue for BR/EDR, green for LE, and orange for Wi-Fi) and has red text.
All other bars contain good and/or retransmitted packets and have black text. If Indicate Retransmits is selected in the Display menu then each graph bar is color-coded by technology for good packets and has a yellow portion for any retransmits. If Indicate Retransmits is not selected, the entire bar is color-coded by technology.
The length of a bar indicates the total packets percentage, where the percentage is of all packets in the entire capture for a technology row ("BR/EDR", "LE", "Wi-Fi 1-3", and "Wi-Fi 4") and is of all packets in the associated technology for all other rows.
Navigation
As in many other views, Stats View has a Navigation Bar whose slider indicates the displayed time range. The time range can be changed by clicking the zoom buttons, selecting the Zoom In or Zoom Out entries in the right-click menu, selecting the zoom presets in the right-click menu, dragging the Navigation Bar slider to a different position, or dragging either side of the Navigation Bar slider to resize it.
To display a specific packet range in the Stats Graph, select the desired packet range in the Summary pane by clicking on one packet and then shift-clicking on another packet, then select Zoom to Selection in the Stats View’s Display menu.
The Navigation Bar contains a color-coded graph of the entire capture that shows packets per second for BR/EDR, LE, Wi-Fi, and 802.15.4.
Nodes
Except for packet type nodes, which are endpoints, any node can be collapsed or expanded by clicking on the node label or on the icon that precedes the label. To collapse or expand all nodes in one operation, click on Collapse All Nodes or Expand All Nodes respectively in the Display menu.
Statistics can be exported to a csv file using button on the Navigation toolbar.
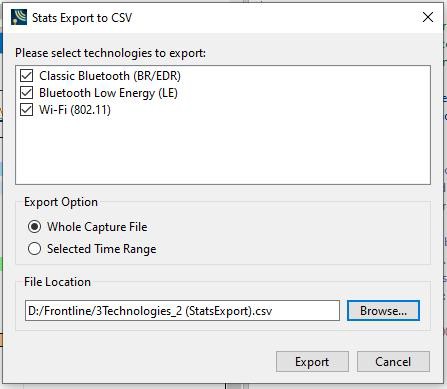
The Stats view export dialog has several options. You can select technologies to export as well as range to export (whole file or range selected with Navigation bar). Choose path and filename to save.