
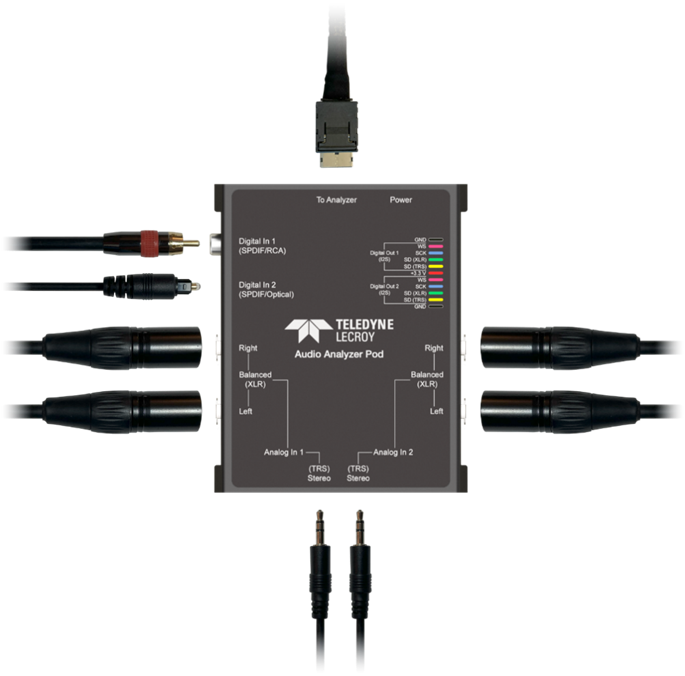
The Frontline Audio Analyzer Pod is designed to interoperate with a preexisting customer audio testing setup. For customers without a preexisting audio setup or who want the analog audio to be added to the over the air (OTA) capture, an Audio Analyzer Pod can be connected to the analyzer’s pod port. This analog audio input board for the analyzer (Figure 1) converts analog audio to digital I2S data with a deterministic system delay that can connect to our analyzer's pod connections. This allows our analyzer, such as the X500, to support up to four mono audio channels per Audio Analyzer Pod (2 stereo I2S channels).
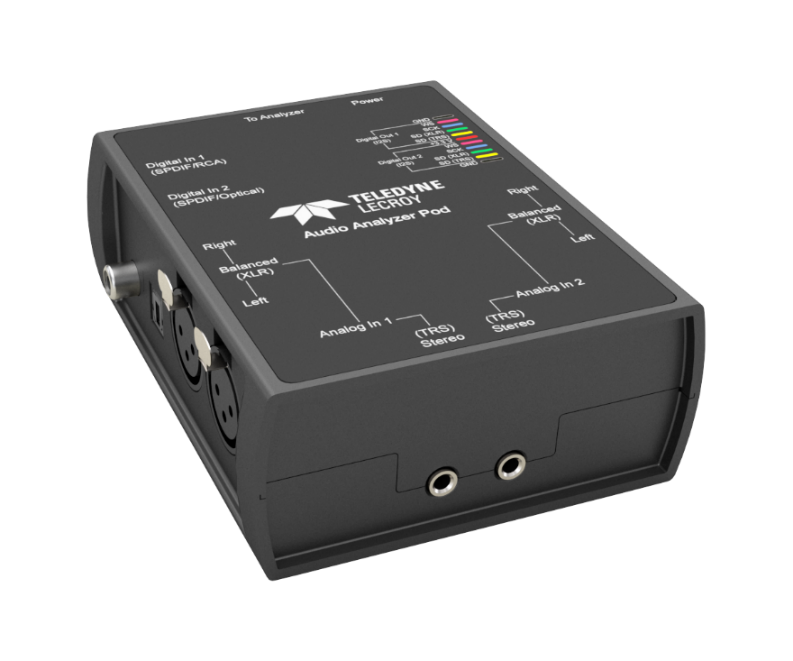
Audio Analyzer Pod Connections
-
With X240, Pod 1 and Pod 2 support both Audio and Logic.
-
With X500(e), Pod 1 and Pod 2 support both Audio and Logic. Pod 3 only supports Logic.
-
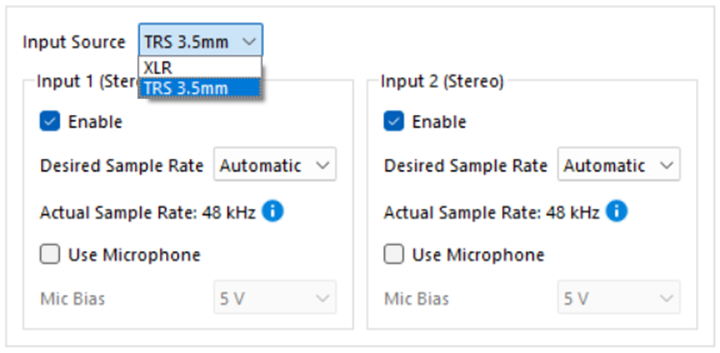
Input selection is for each side of the analyzer that has both XLR and the stereo TRS 3.5 mm jacks (Analog In 1, Analog In 2). Only one type of input can be used at a time. The XLR and TRS 3.5mm inputs cannot be mixed.
Measuring End-to-End System Latency with the Frontline Audio Analyzer Pod
Low latency, synchronized audio playback is critical in video streaming and voice calls where even minor delays cause lip-sync issues, echo, or degraded spatial audio perception. These latencies arise from various sources such as analog-to-digital conversion, codec processing, buffering, and wireless transmission. This use case describes how to measure and analyze end-to-end latency across the entire audio path—from analog input to wireless transmission and final audio output.
To use the Frontline Audio Analyzer Pod to capture the analog system input and output:
-
Choose 3.5mm XLR or TRS connectors for the audio connectors.
-
Connect Input 1 to the analog signal sent to the Bluetooth transmitter.
-
Connect Input 2 to the analog output from the Bluetooth receiver (e.g., headphones).
-
Connect the Audio Analyzer Pod to the analyzer (e.g., X500) via the OCULink port.
-
Configure the inputs in the WPS software:
a. Choose between TRS or XLR.
b. Set desired sample rate and mic bias if needed.
c. Select two audio streams in the Stream Panel.
-
Complete a capture
-
Click “Measure Latency” in the toolbar. The system calculates and logs the latency between the two streams, displaying:
a. Measured latency in milliseconds.
b. Warnings if latency exceeds expected thresholds.
c. Time-synchronized waveform overlays for visual analysis.
Audio Analyzer Pod Settings
Display of Audio Pod Configuration Pane
In WPS, Open the Record Options and select the Wired tab. Check the pod’s checkbox and select the Audio radio button.
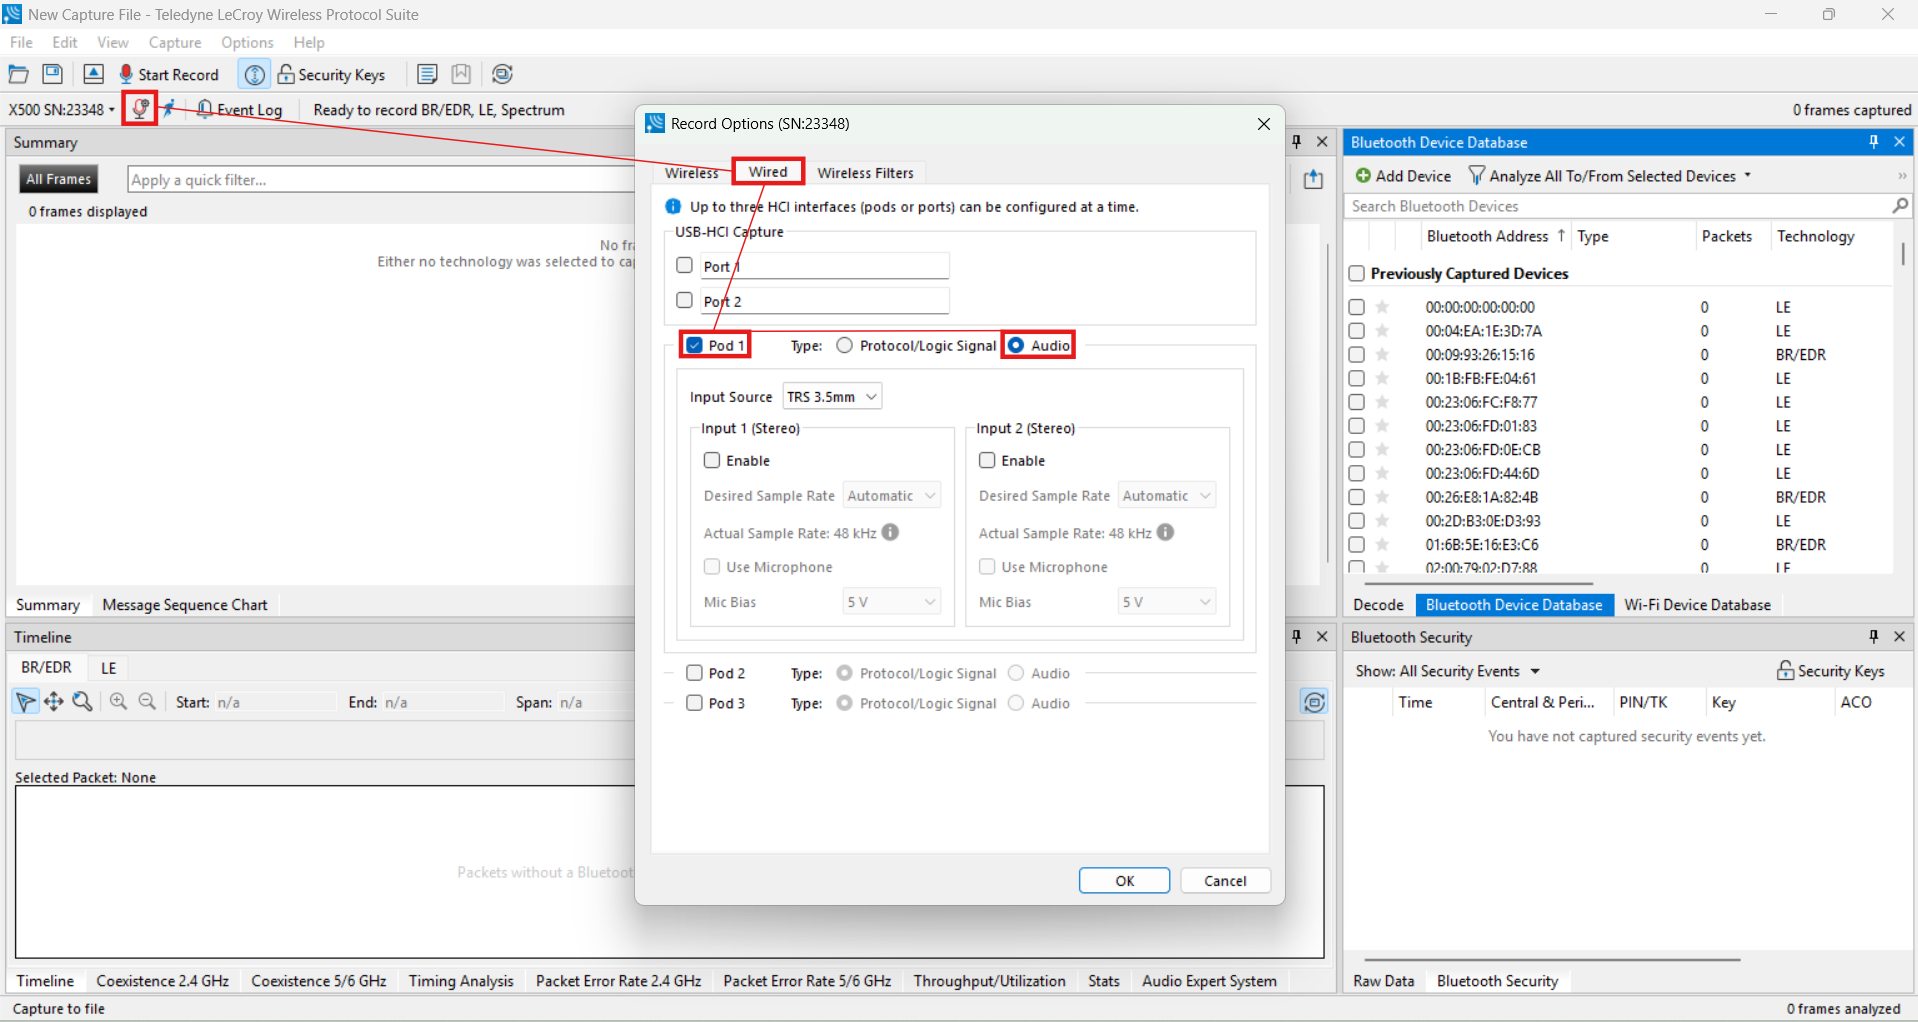
Audio Pod Configuration
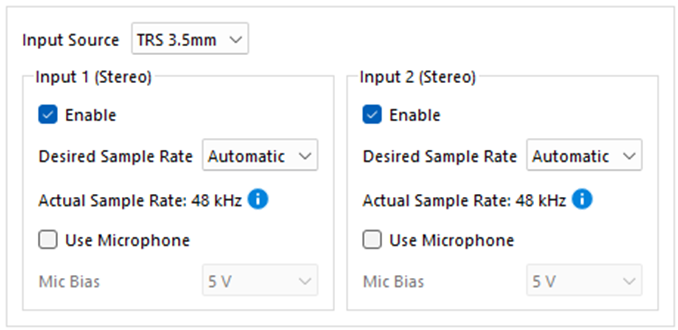
-
Input Source – use this menu to choose XLR or R 3.5mm
-
Desired Sample Rate – use this menu to choose between Automatic, 32 kHz or 48 kHz
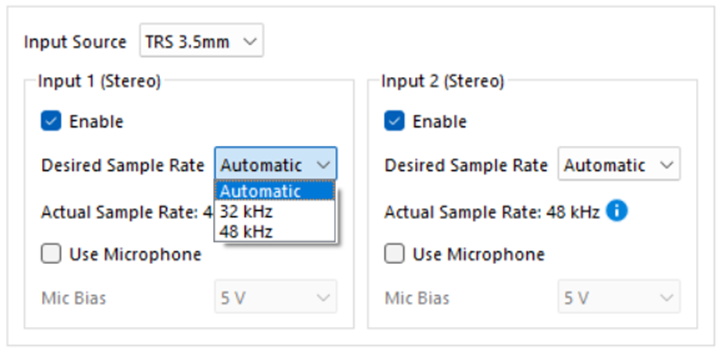
The actual sample rate is determined based on your desired setting and hardware capabilities. The Audio Pod hardware will select the closest available rate to your selection.
-
Mic Bias
To change the Mic Bias voltage, select the “Use Microphone” checkbox.
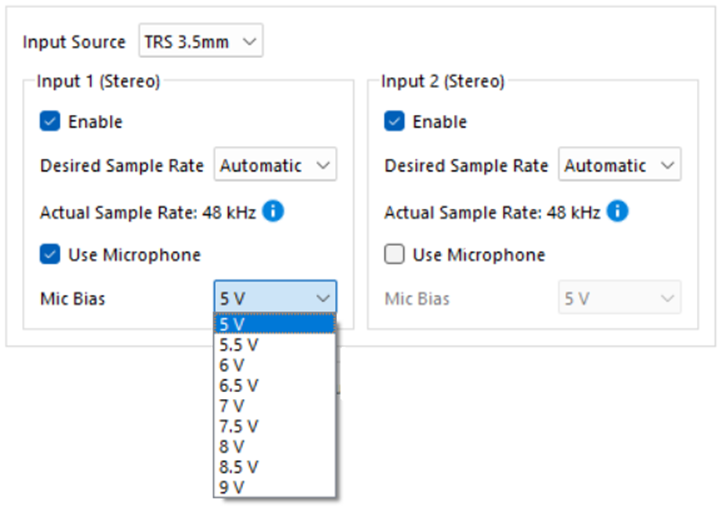
The Audio Analyzer Pod is not available for Wi-Fi or 802.15.4 captures.
Event Type Filters
The Audio Event Table toolbar includes buttons for filtering event types in the table. By default, all filter buttons are visible but disabled. When a specific event type appears, its corresponding button is automatically enabled and checked.
-
Checked state - event type is shown
-
Unchecked state - event type is hidden
Filter states are saved between sessions. Upon restart, the application restores the filter state.

Measuring Stream Latency
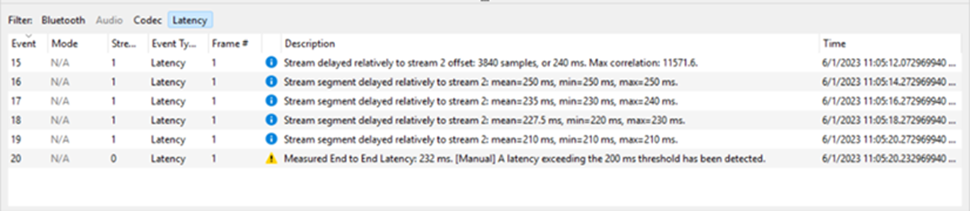
Latency between two selected streams can be measured using the Measure Latency function. To measure latency, select any two streams in the Stream Panel using the checkboxes. When a stream is selected, its checkbox will be checked, and the stream’s border will turn blue. Once two streams are selected, the Measure Latency button on the toolbar becomes available.
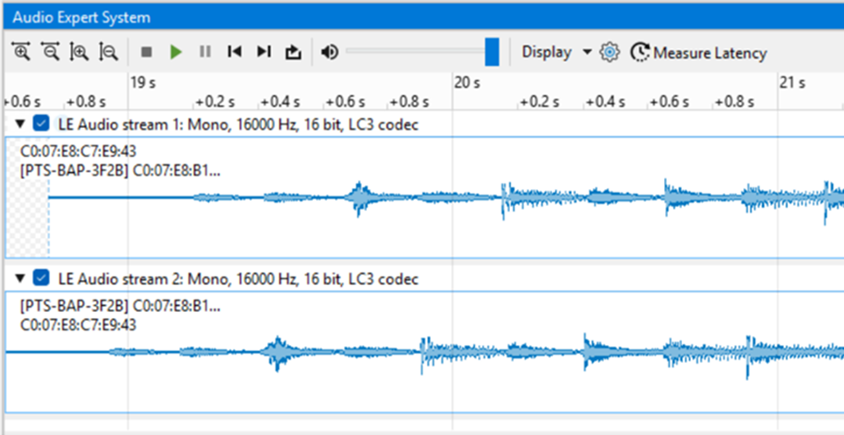
Clicking the Measure Latency button will calculate the latency between selected streams. The result, along with intermediate values, will automatically appear in the Event Log as entries labeled Latency. When a measured latency exceeds the expected values, the corresponding Latency event is labeled as a Warning in the Event Log to indicate a potential timing issue between the streams.
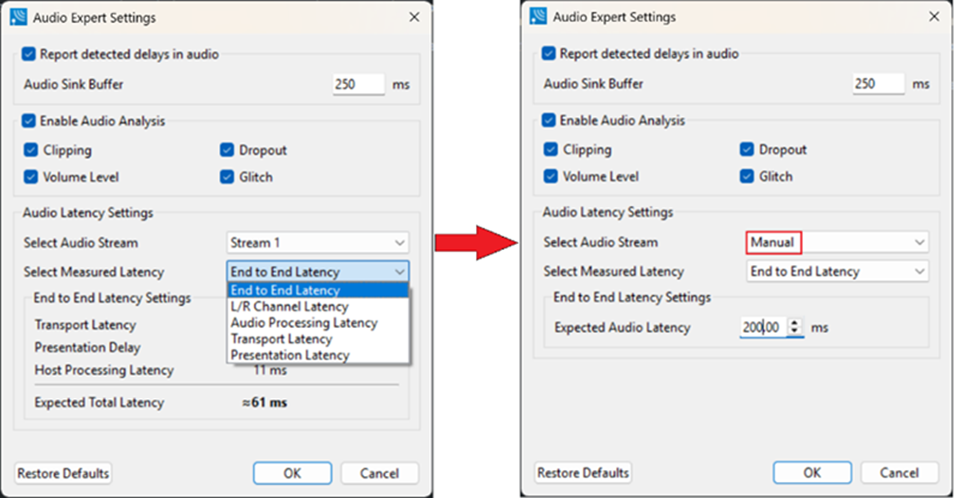
To control the expected latency values, open Audio Analysis and Latency Settings by clicking the gear icon on the toolbar.

Within this menu, the expected latency is specified in milliseconds, and the type of latency to be measured can be selected. Two entry modes are provided: Manual, which allows fixed values to be defined by the user, and Automatic, where latency estimates are derived from OTA packets based on the codec and transmission technology in use.
Logic Analyzer Pod
The Logic Analyzer pod can be used along with Audio Analyzer pod for audio latency measurements. It can capture I2S audio streams which can then be compared with other captured streams for latency measurements. Audio latency measurements are always executed on the left channel when a stereo stream is selected.
Measuring Transport Delay with Logic Analyzer Pod
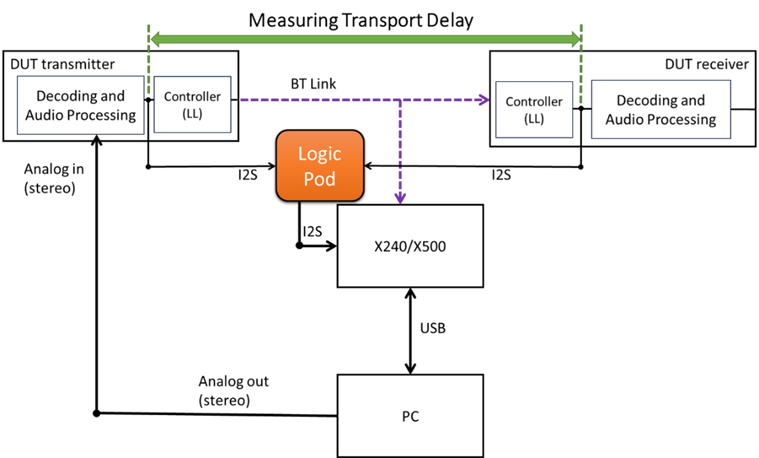
Above figure shows how two Logic Analyzer pods can be used to measure Transport Delay. The I2S input to the transmitter’s Link Layer should be captured on one logic pod and I2S output from the receiver’s Link Layer should be captured on another Logic Analyzer pod.
These two captured I2S streams can then be used for transport latency measurements in Wireless Protocol Suite.
Measuring Presentation delay with Logic Analyzer pod and Audio Pod
To measure Presentation Delay, I2S output of the receiver’s Link Layer can be fed into a Logic Analyzer pod, and the decoded analog output can be fed into Audio pod. You can then capture using Wireless Protocol Suite which will generate two audio streams and the delay between these would be the presentation delay.
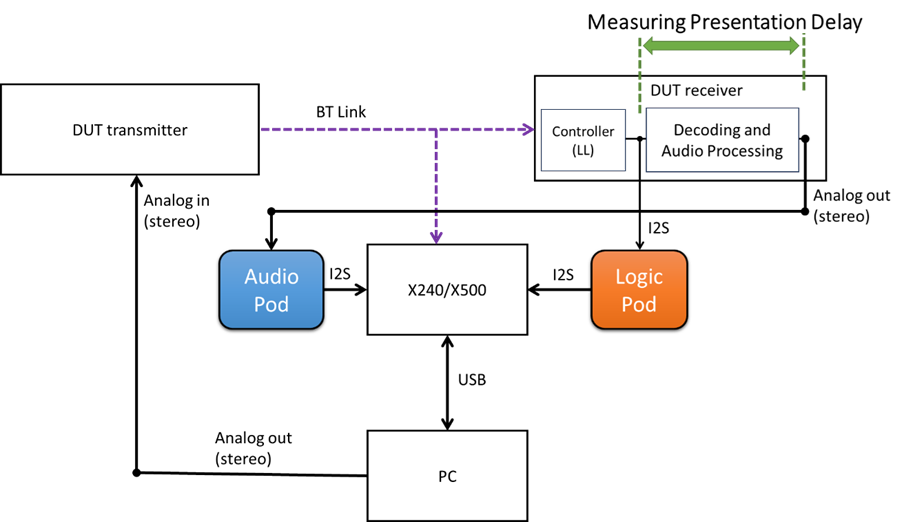
Similarly, Audio Processing delay can be measured at the transmitter end using one Audio pod and one Logic Analyzer pod.
Logic Analyzer Pod Settings
Display of Logic Pod Configuration Pane
In WPS, Open the Record Options and select the Wired tab.
-
Check the pod’s checkbox and select the Logic radio button.
-
Select I2S radio button for HCI capture method.
-
Select the appropriate data lines for BCLK, LRCLK and Data.
-
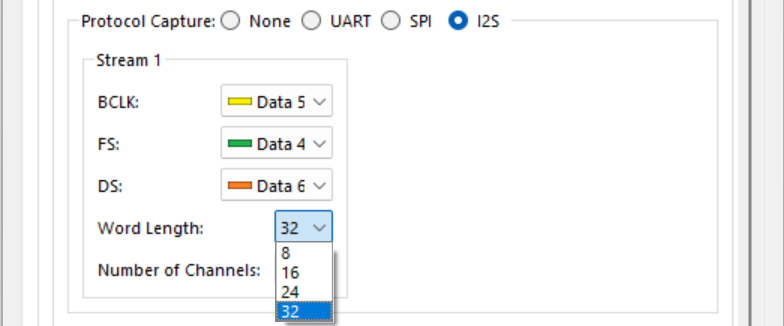
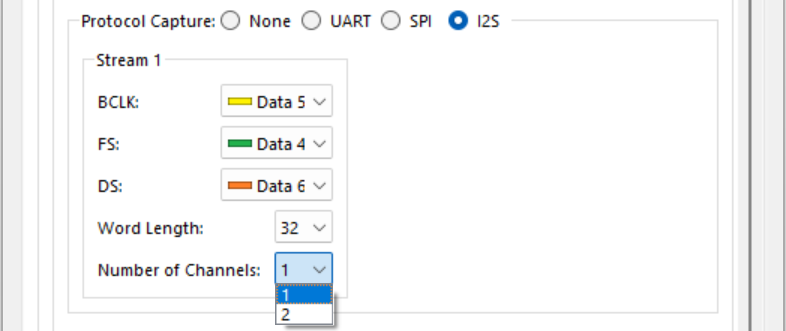
Select the word length and number of channels as per your I2S output and click OK.
Logic pod is now read to capture and once you click the start capture in Wireless Protocol Suite you should see I2S audio data coming in.
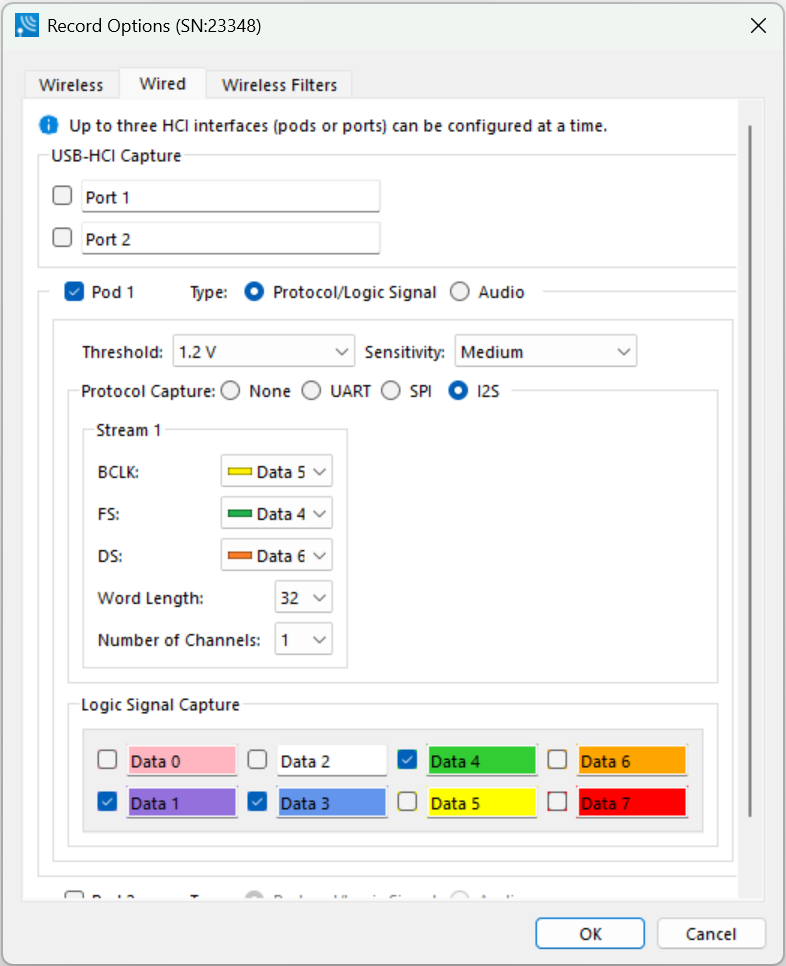
Logic Pod I2S is restricted to only certain lines.
-
BLCK – Pin 5
-
LRCLK – Pin 4
-
Data – Pin 6
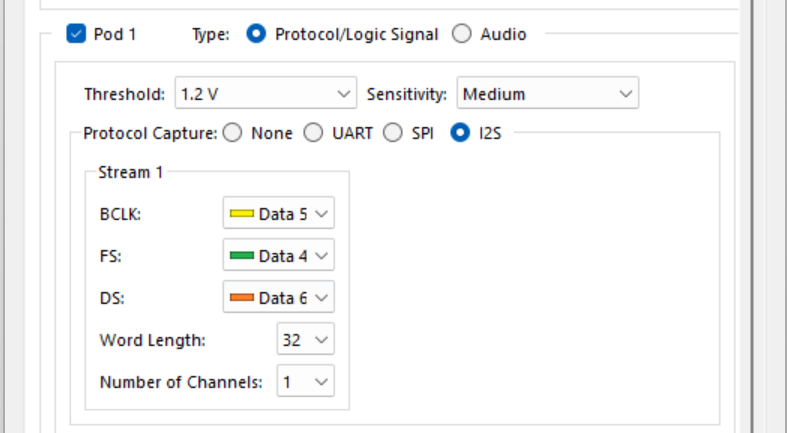
After the Audio Analyzer Pod is selected, the Logic Analyzer Pod’s HCI capture method will always be changed to I2S. For example, if UART is selected for the Logic Pod HCI capture method and data is captured with the Audio Analyzer Pod, when returning to capture with the Logic Analyzer Pod, “UART” will need to be re-selected. The original configuration settings except the HCI capture method are saved.