
The Analysis menu has the following options to view trace files and specify SCSI decoding assignments:
Decoding Assignments
Click on Analysis and select Decoding Assignments to display the Decoding Assignments dialog.
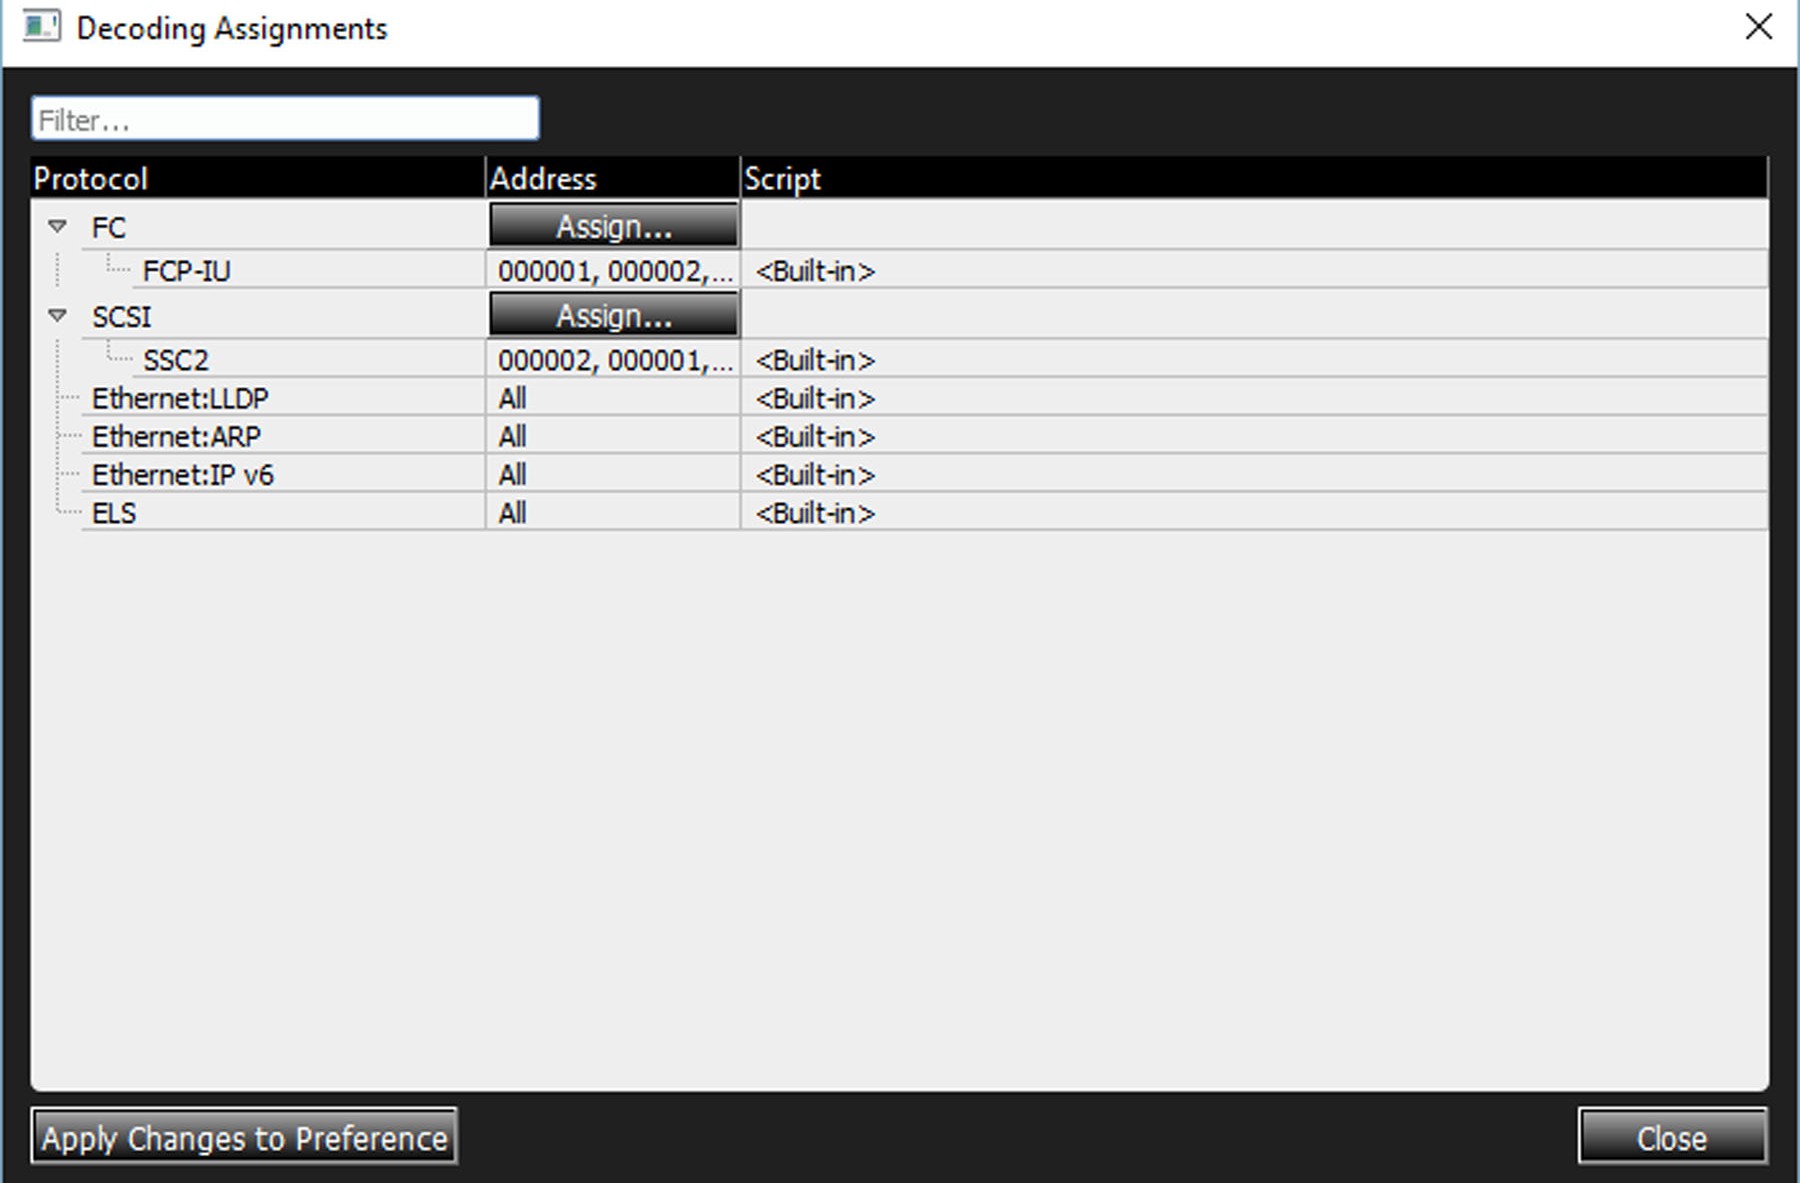
For more on Decoding Assignments see Decoding Assignments.
Spreadsheet View
Click on Analysis and select Spreadsheet View or click the 
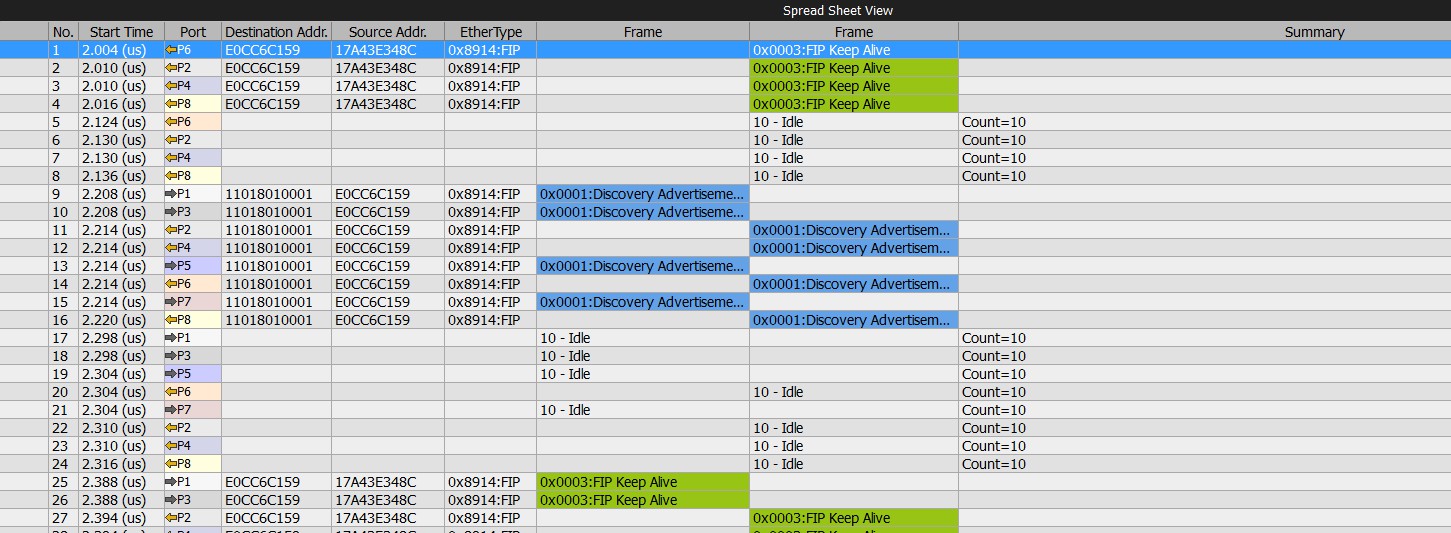
Spreadsheet View displays Protocol Fields and Frames by time. See Spreadsheet View for more information.
Exchange View
In Exchange View the elements of a event are grouped together hierarchically rather than sequentially.
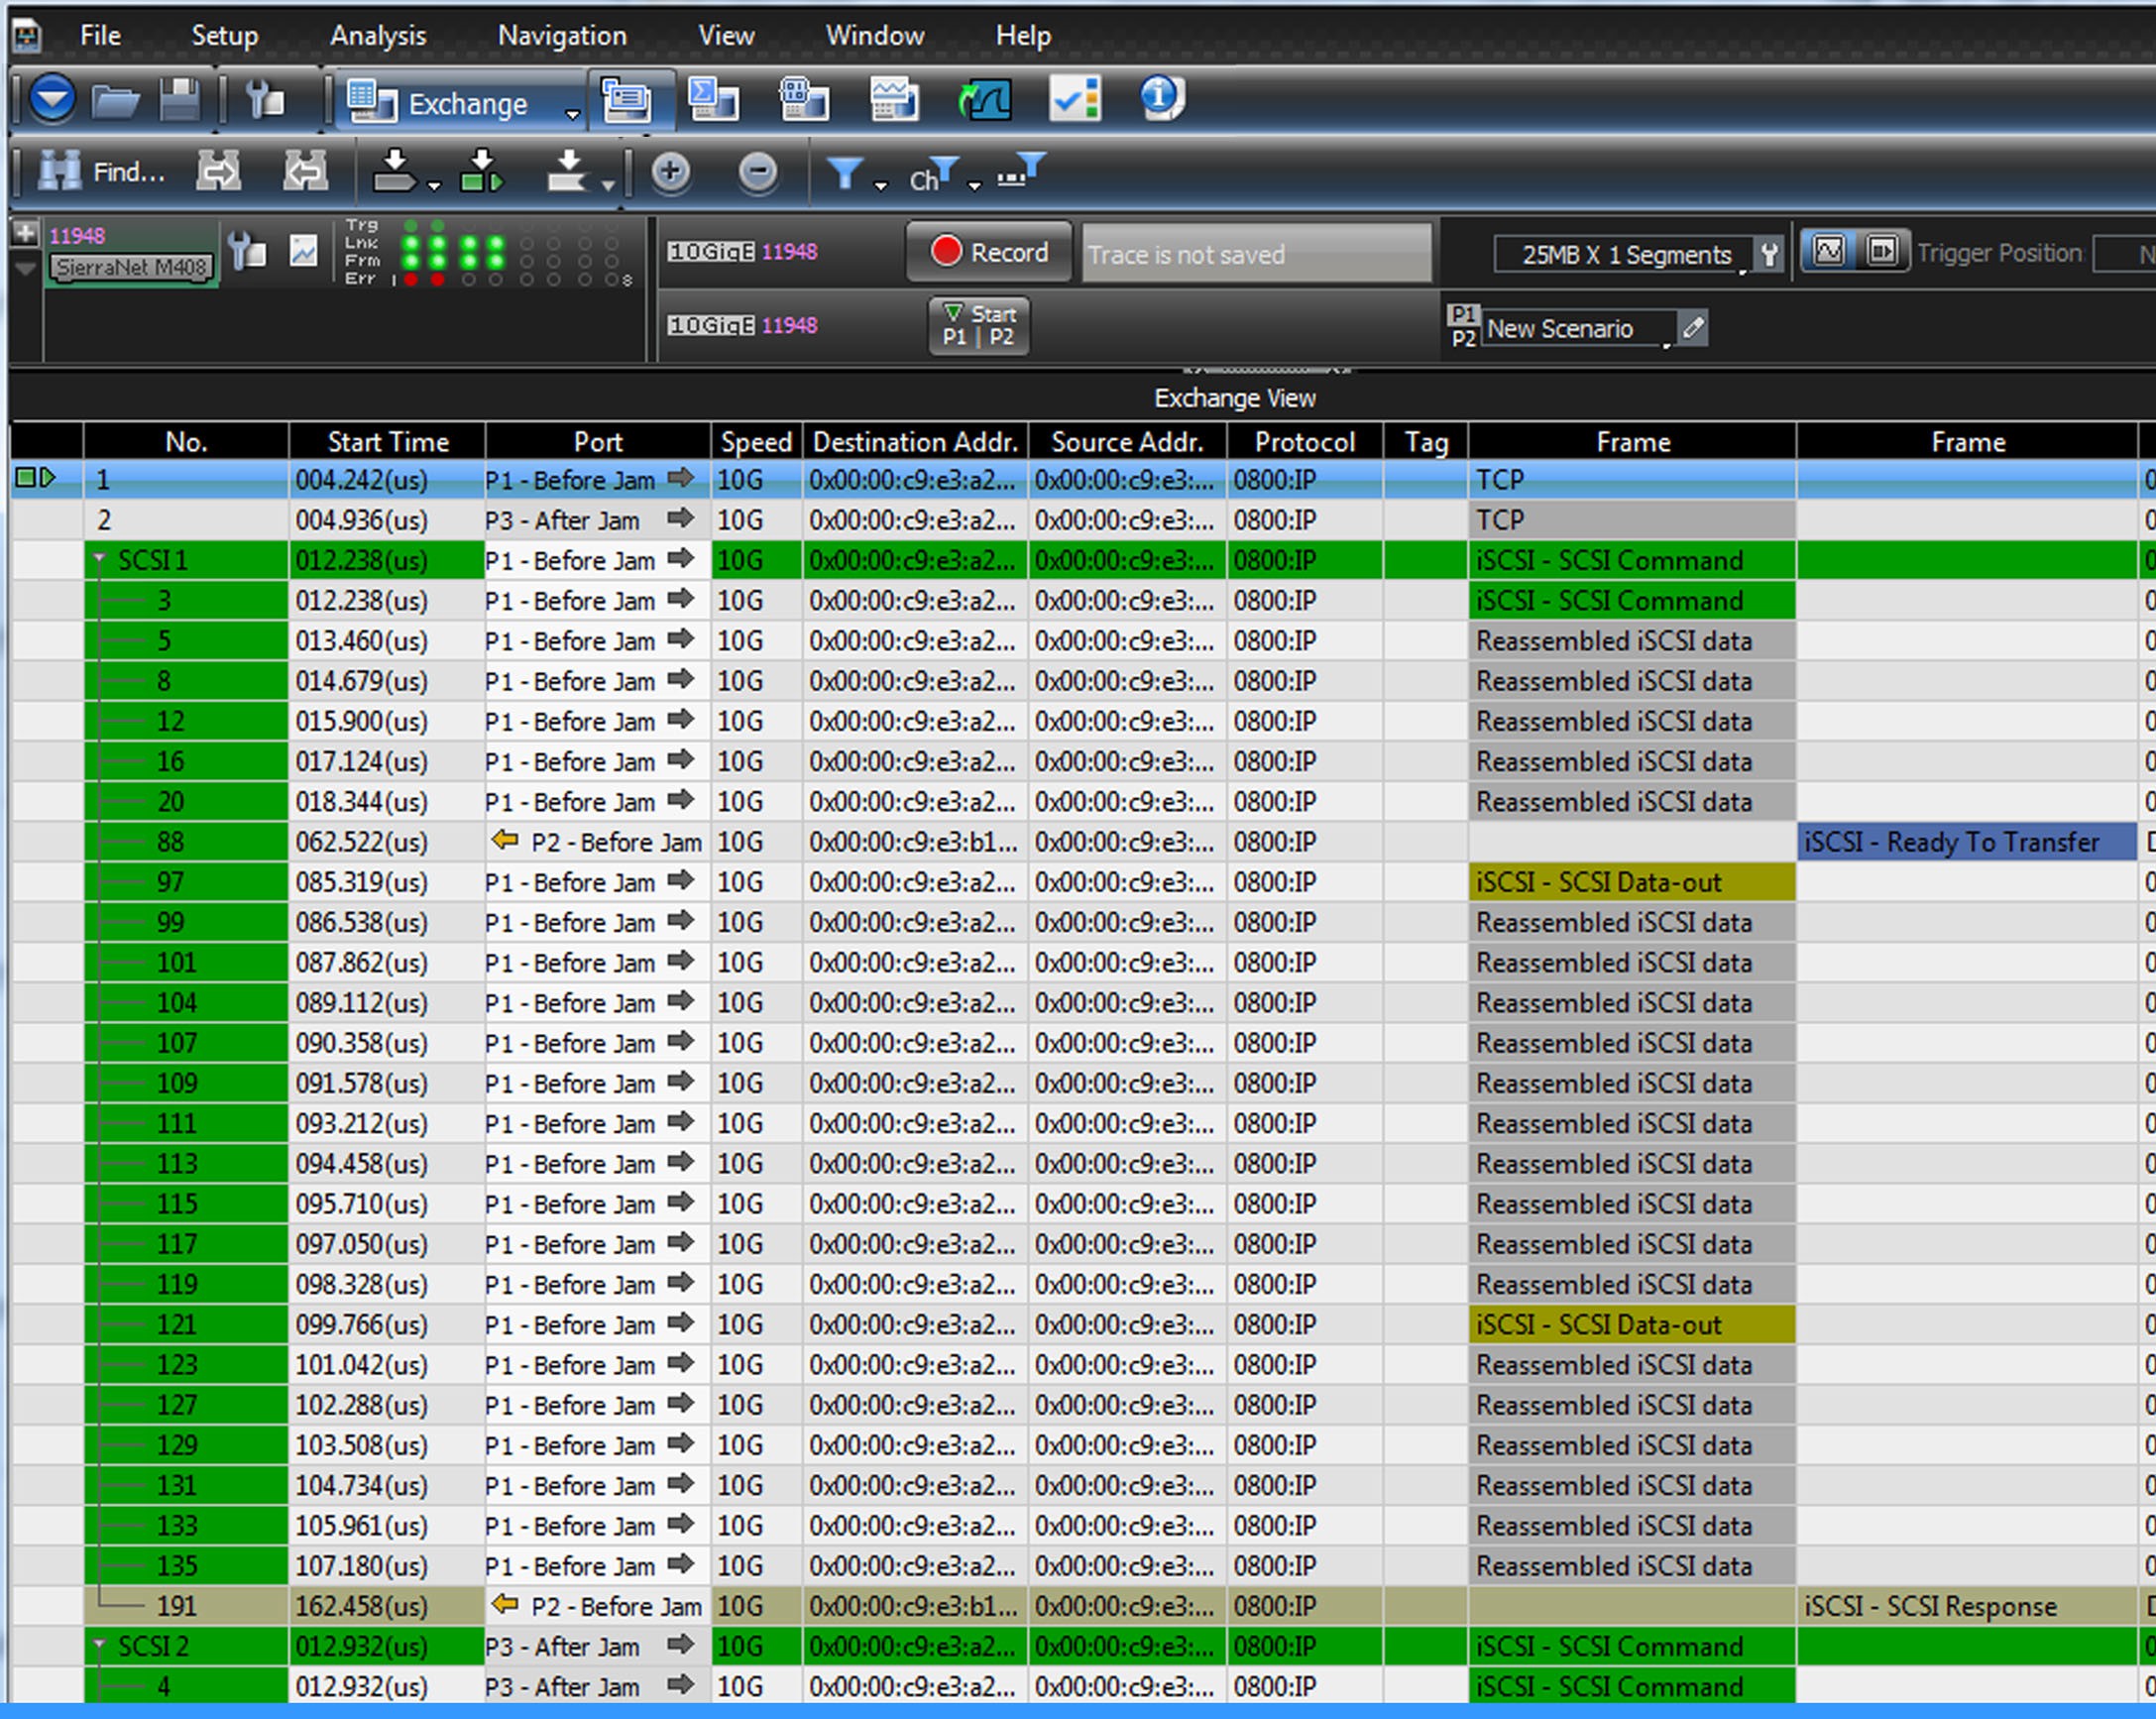
Note: Exchange View only works when both sides of a link are captured on a single port pair.
See Exchange View for more details.
Frame Inspector View
Click on Analysis and select Frame Inspector View or click the 
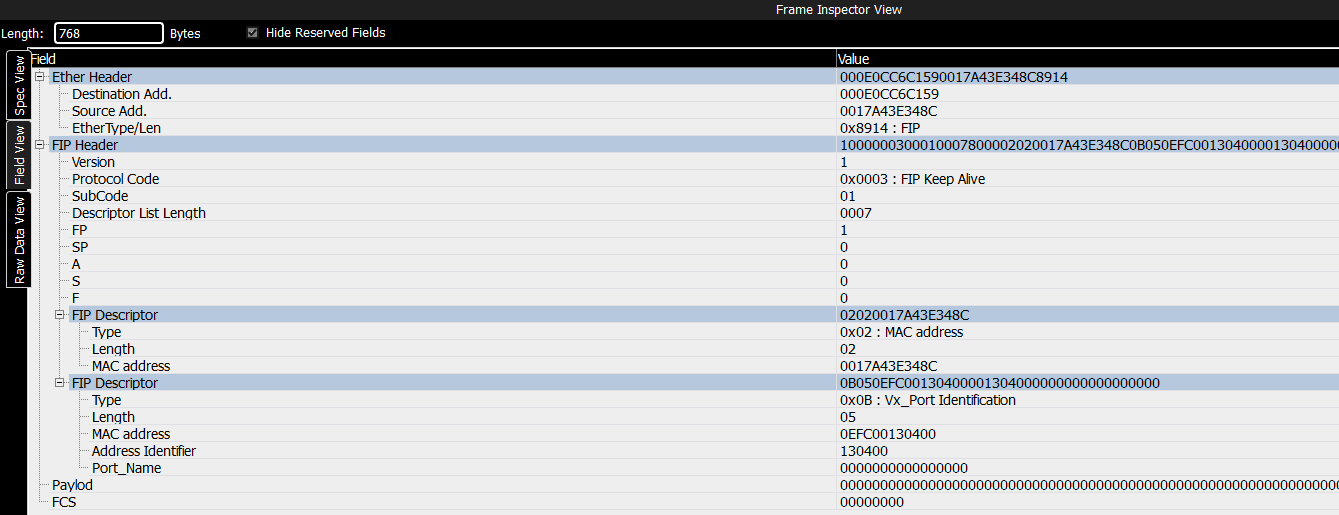
Frame Inspector View displays detail information about a frame highlighted in Spreadsheet view. Refer to Frame Inspector View for more information.
Traffic Summary View
Click on Analysis and select Traffic Summary View or click the 
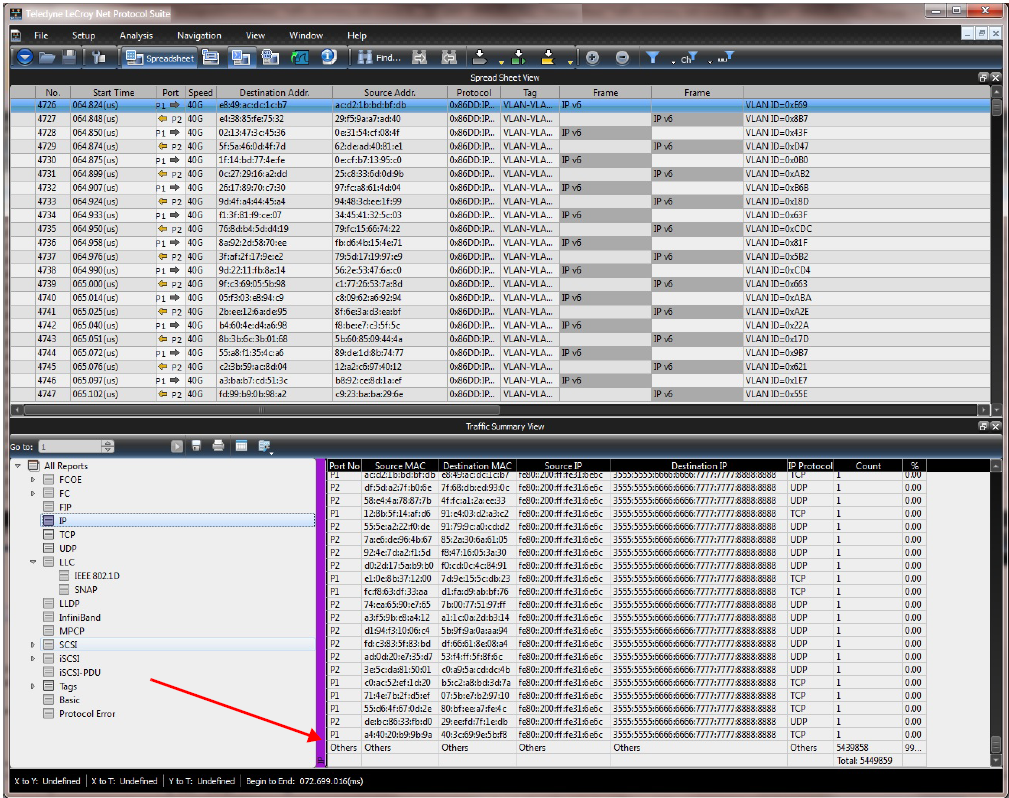
The Traffic Summary View for each captured signal can be viewed. This Summary View displays the statistics of commands, the type of command and the total count. For each command it displays the percent of the total count. See Traffic Summary View for more information.
The software collects up to 10,000 unique pairs for the reports. Anything beyond that is grouped into the Others category.
Multi-Column Sorting
Press the Shift key while clicking on the header section to sort the columns one-by-one in the priority order. In the case of multi-column sorting, the sort priority order will be shown in the form of indexes as part of the header title.
Data View
Click on Analysis and select Data View or click the 
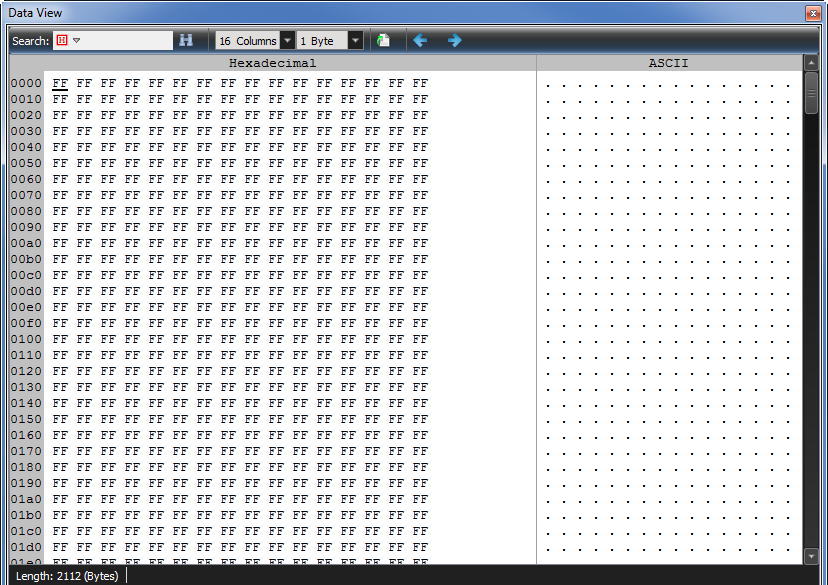
Data View displays information in Hexadecimal and ASCII format. See Data View for more information.
Bus Utilization View
Bus Utilization View displays both an Error Count and Link Utilization over a specific time frame.
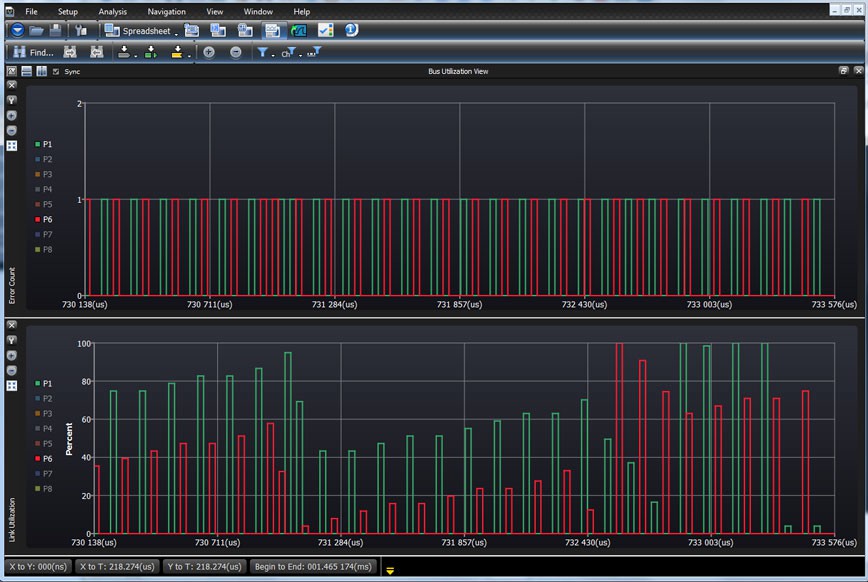
For a more detailed explanation, see Bus Utilization View.
Link State View
Link State View is used for debugging Auto Negotiation and Link Training in Ethernet, and Speed Negotiation and TX Training in Fibre Channel. The Link Viewer is intended to show events chronologically. Transitions will not be shown on this view. All the errors that occur in the Trace will be shown in the Event Viewer.
Link State View can be enabled by selecting the Link State View 
-
Timeline View
-
Listing/State Diagram View
-
Navigation View
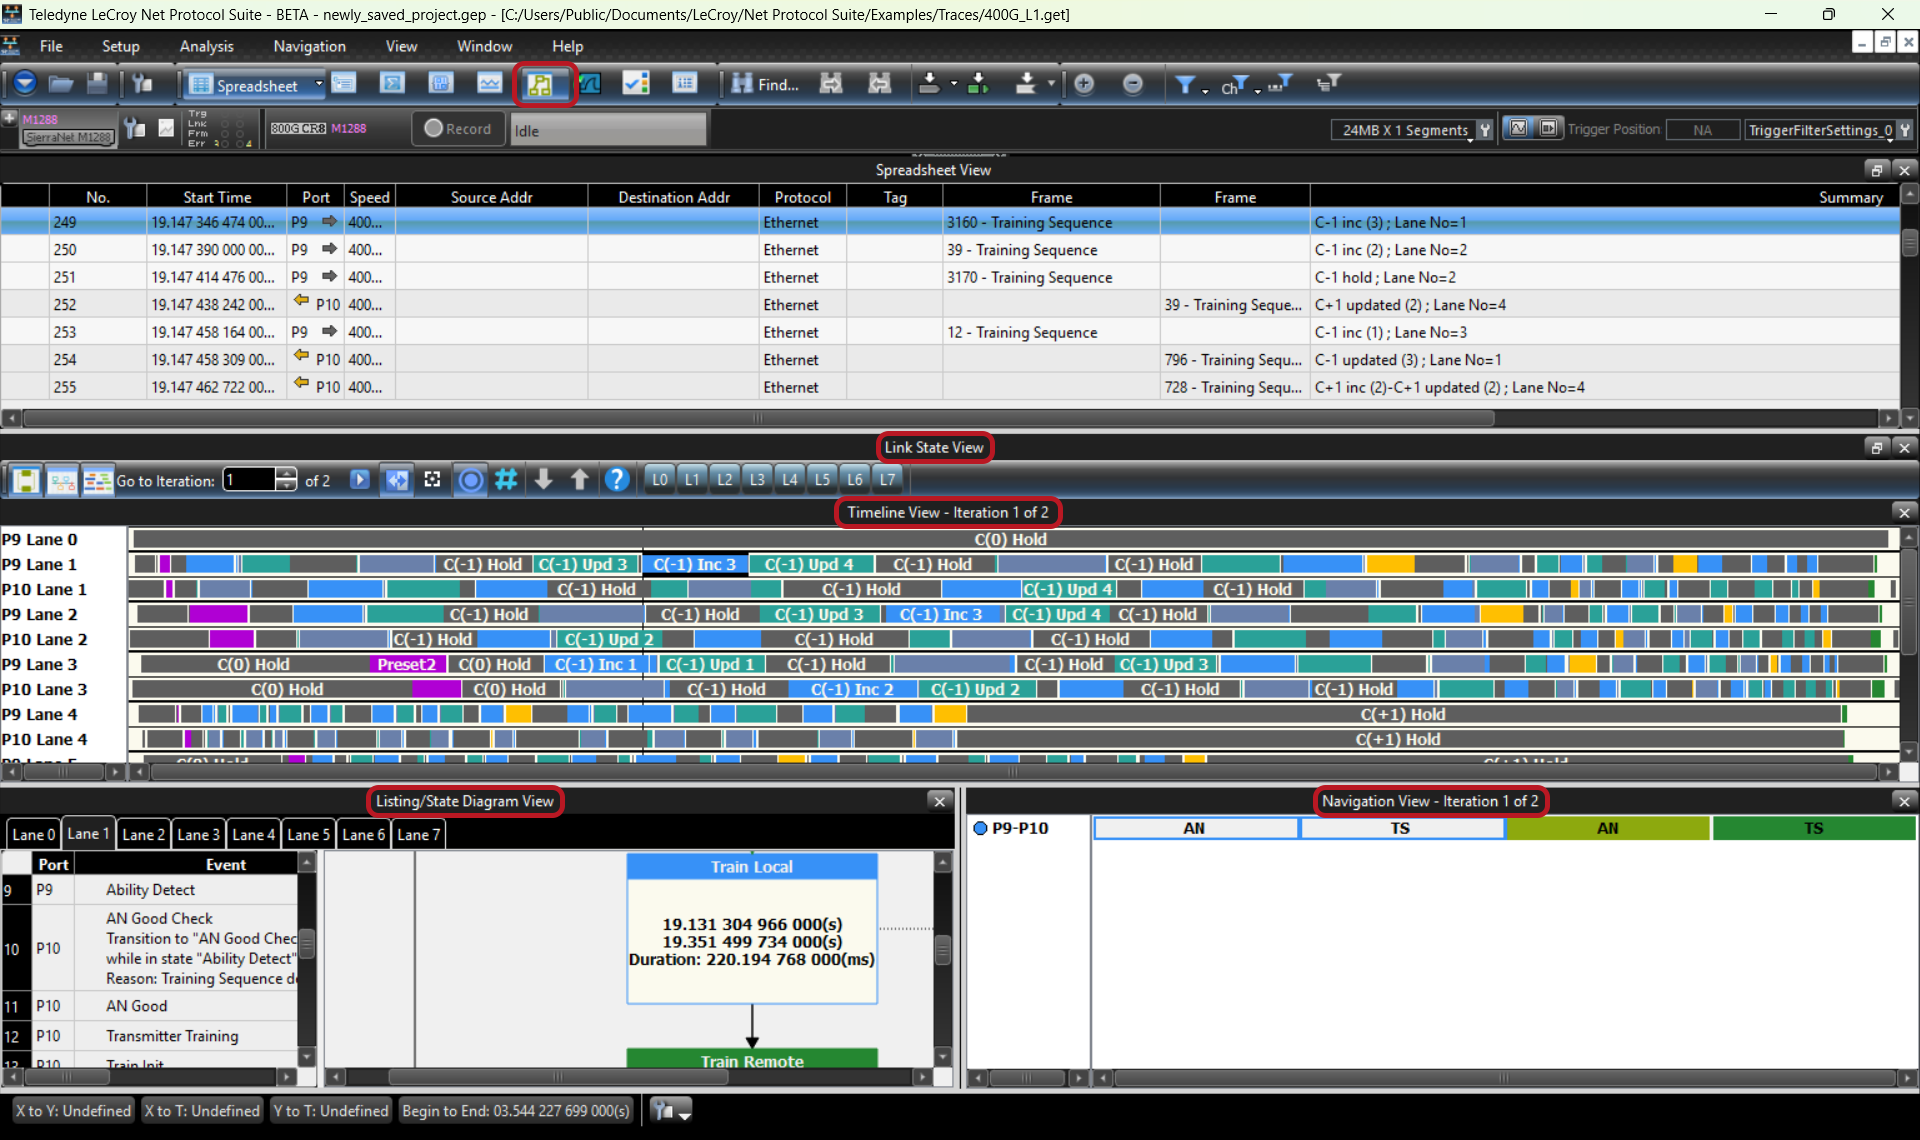
Link State View Toolbar
The Link State View also has its own toolbar.

Link State View Toolbar Buttons & Icons
|
Button/Icon |
Description |

|
Listing/State Diagram View. List of Ports in the captured trace (used to select a port pair). |

|
Toggle Navigation View. Show or hide the Navigation pane. |

|
Toggle Timeline View. Displays color-coded metrics for each lane. |

|
Go to Iteration. Select from available iterations (appears in the Navigation View and Navigation panes). |

|
|

|
Synchronize Views. Use to time-synchronize items in Spreadsheet View with items in Link State View. |

|
Fit in Views: Use this to zoom back in when view is expanded. |

|
Show Final State. Goes to Final State. |

|
Show/hide Number of Transitions (flow diagram/diagram view) |

|
Next. Move to Next Event. |

|
Previous. Move to the Previous Event. |

|
Help. Displays a table of the icons, buttons, Markers, Legend (colors), and Controllers used in Link State View. |
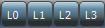
|
Show/hide port lanes. |
Link State View Help Tables
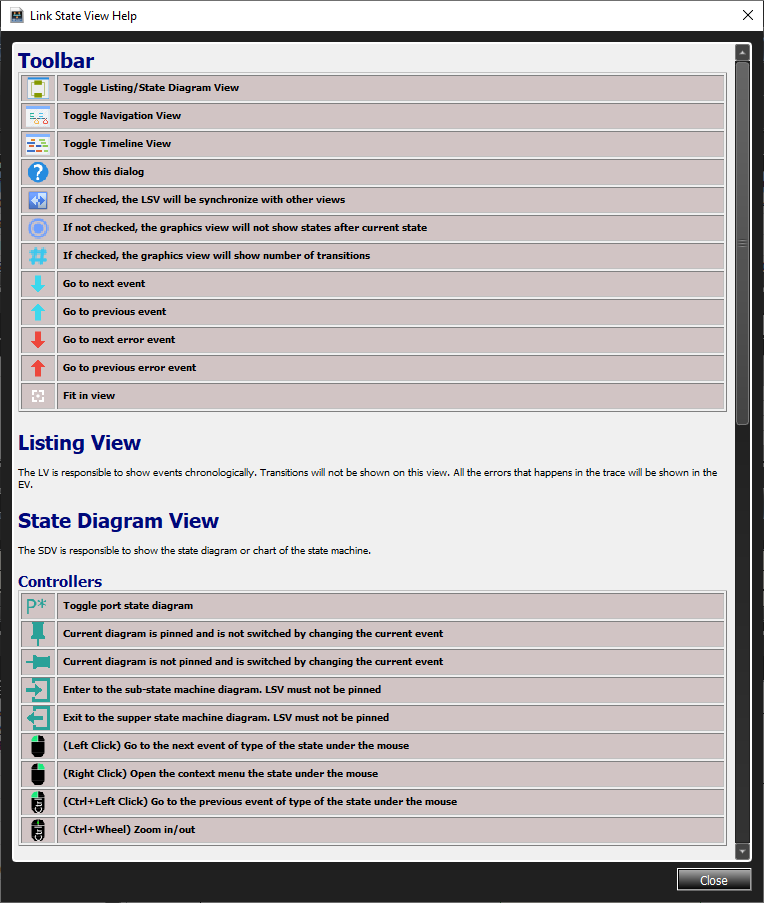
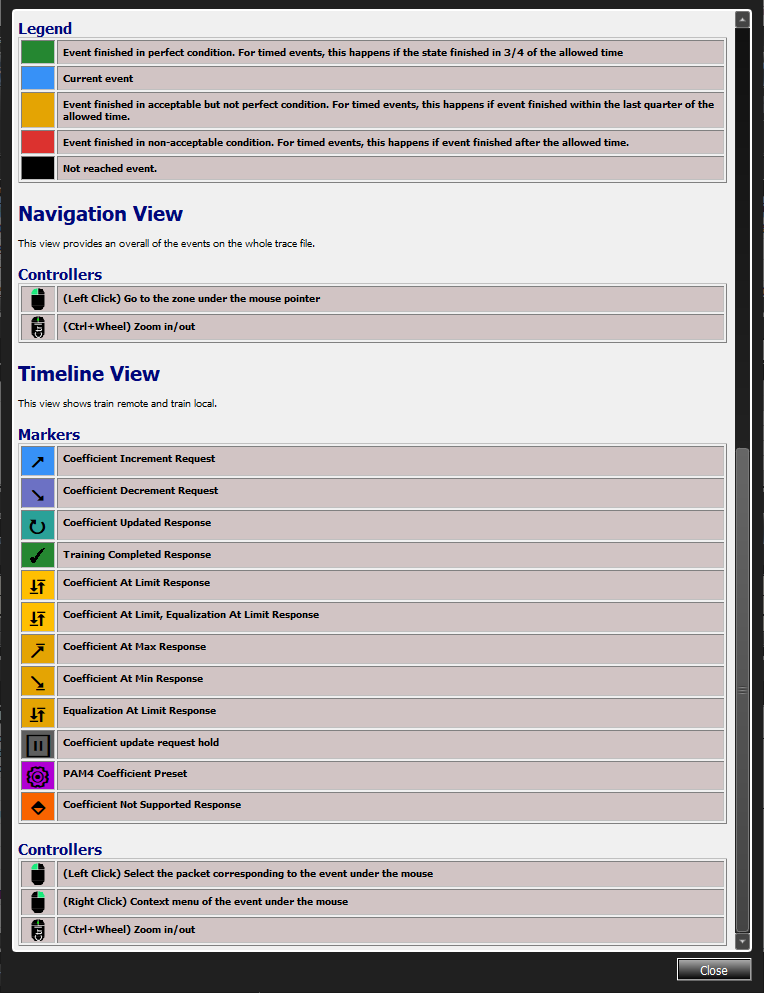
Listing/State Diagram View
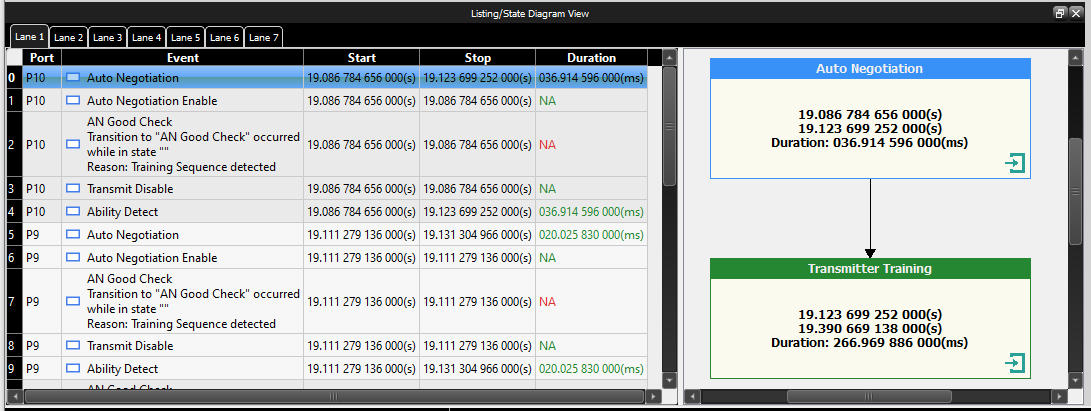
Displays the list of active ports captured in the current trace, Event, Start and Stop, and the Duration; and the current State diagram.
Listings View Pane
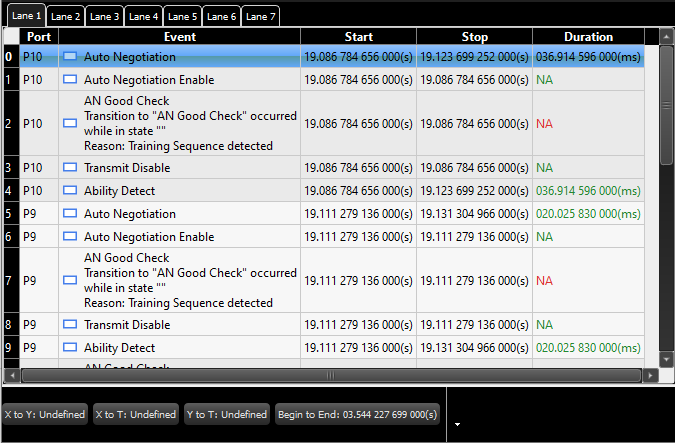
The Listings View pane displays the port number, Event, Start and Stop time, Duration, and tabs for each lane.
-
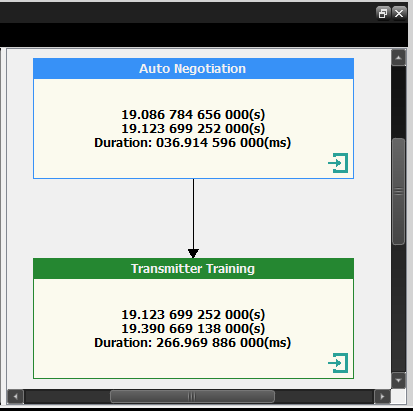
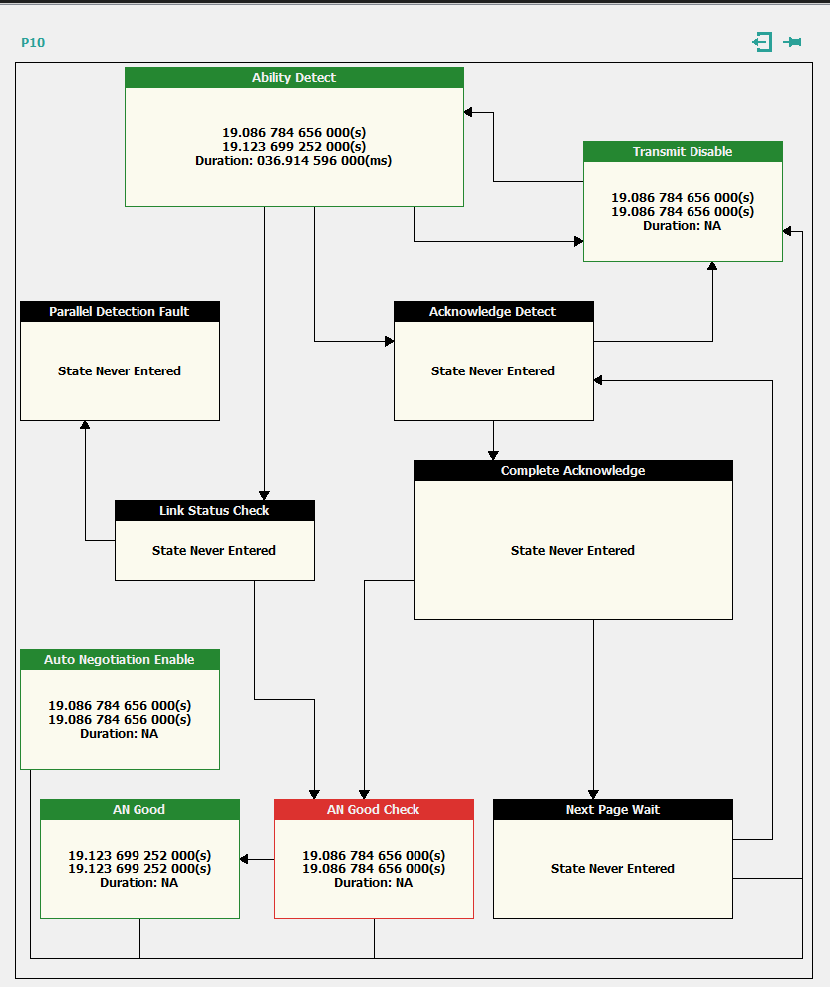
The tabs for lanes 1 through 7 display the current-state diagram view for the selected port.
-
Click the

-
Click the

Timeline View Pane
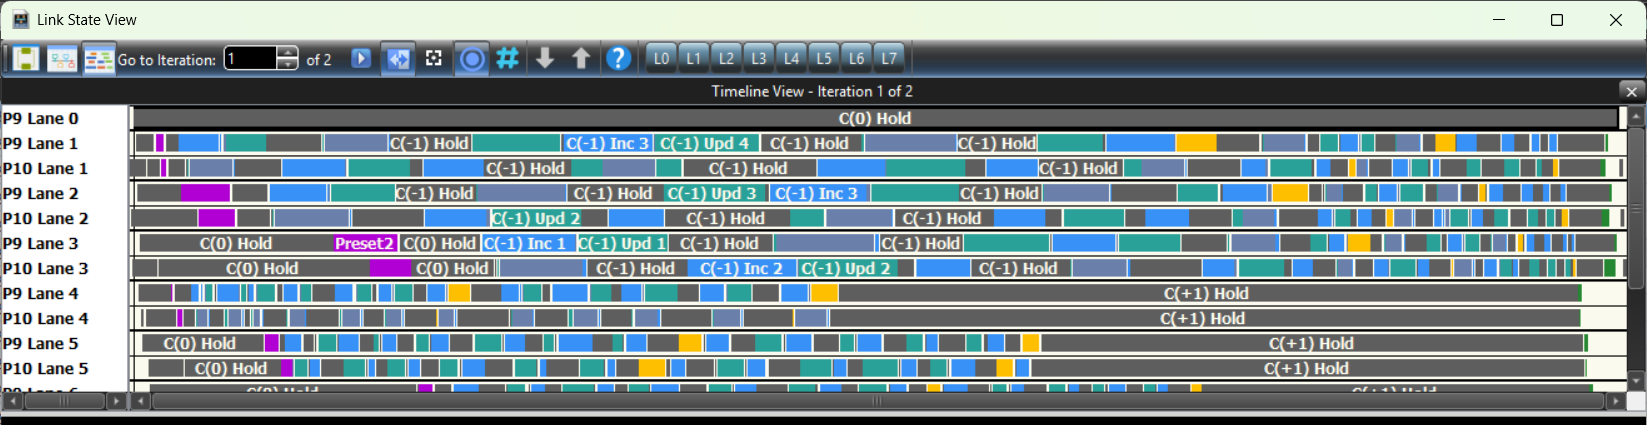
Shows Training transactions for each lane. To view the metrics within the color blocks, you must zoom in. To do this, hold down the Ctrl key and turn the mouse scroll wheel.
Note: When multiple consecutive increment or decrement requests are found, the accumulated distance from the starting point (either positive or negative) will be reported.
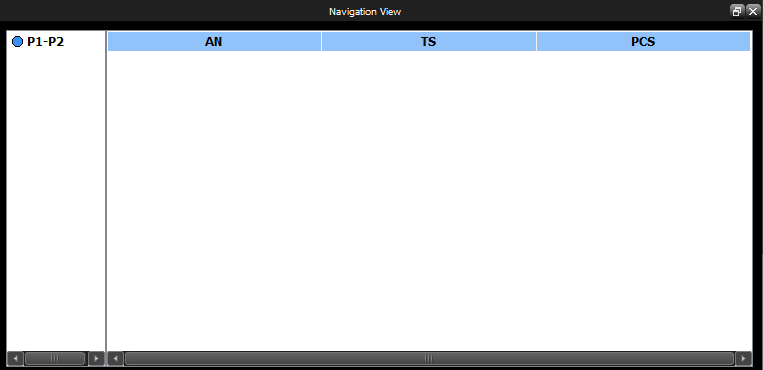
Navigation View Pane
This shows Negotiation activity of the ports for the captured trace: Auto-Negotiation, Training Sequence, and PCS.
Selecting one of the ports causes the Navigation View and State Diagram panes to shift to display that particular event.

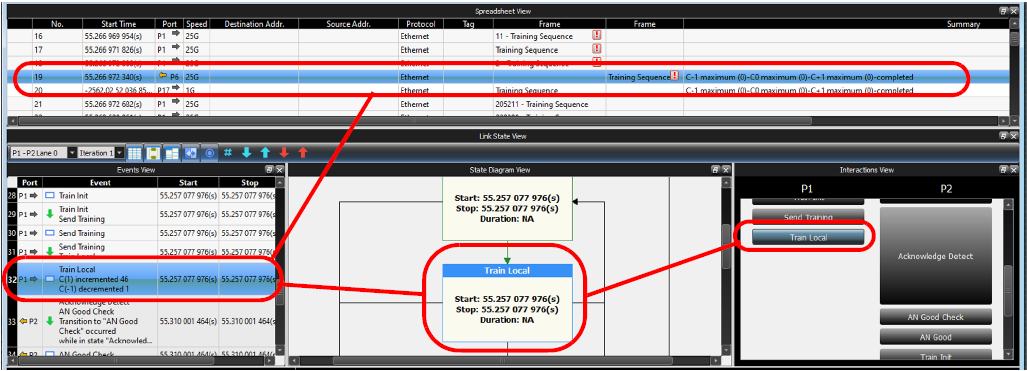
Synchronize Views
Synchronized all Views: Trace, Event, State Diagram, and Interactions.
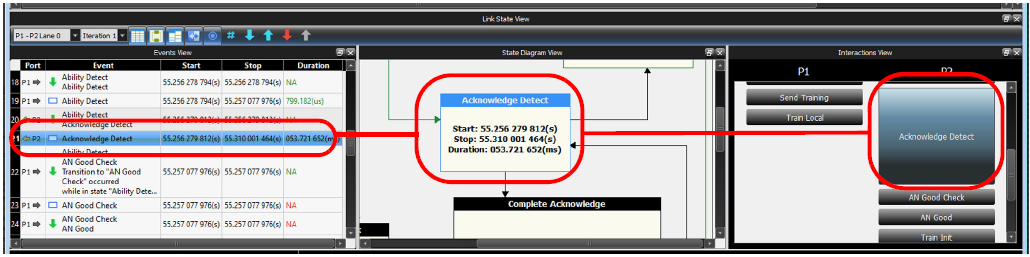
Go to Final State in Selected Event
Displays Final State in the selected Event.
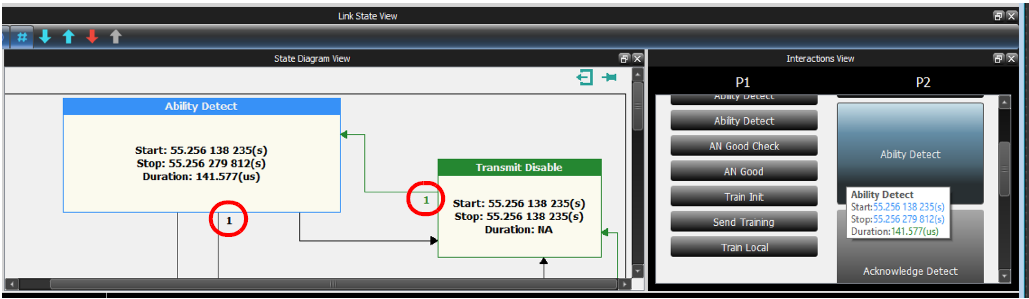
Show/Hide Number of Transitions
Show/hide the number of Transitions in the State Diagram.
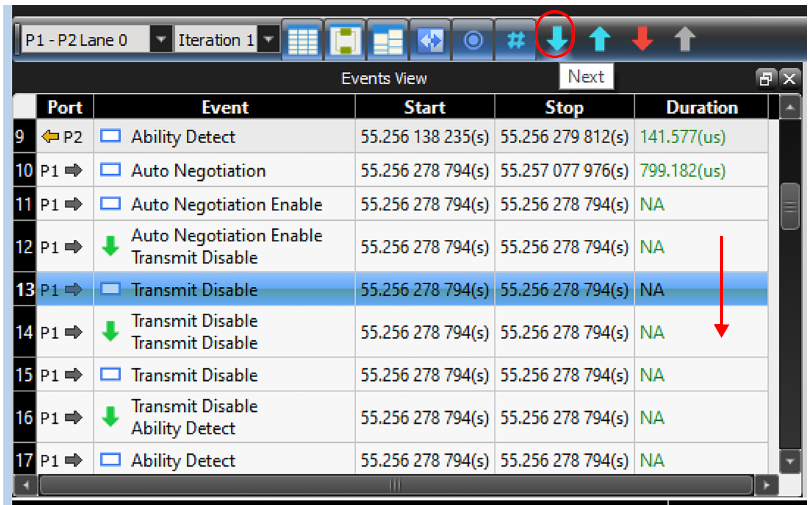
Go To Next Event
Display moves to Next Event.
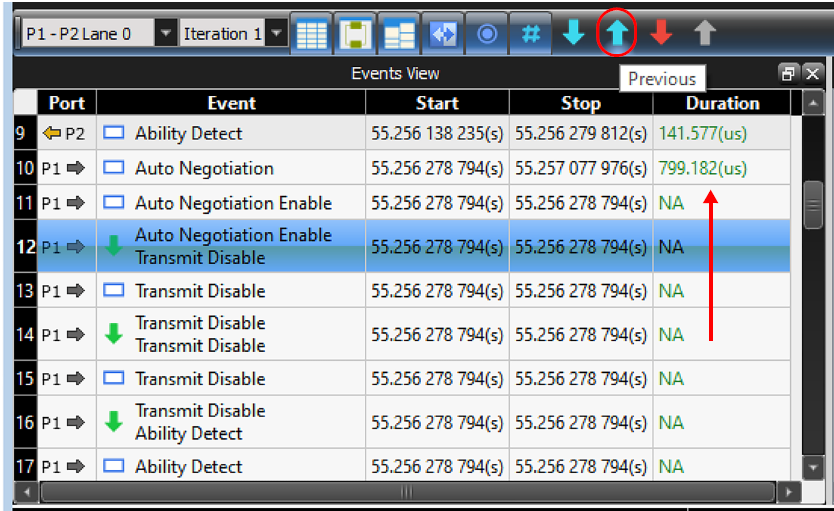
Go To Previous Event
Display goes to Previous Event.
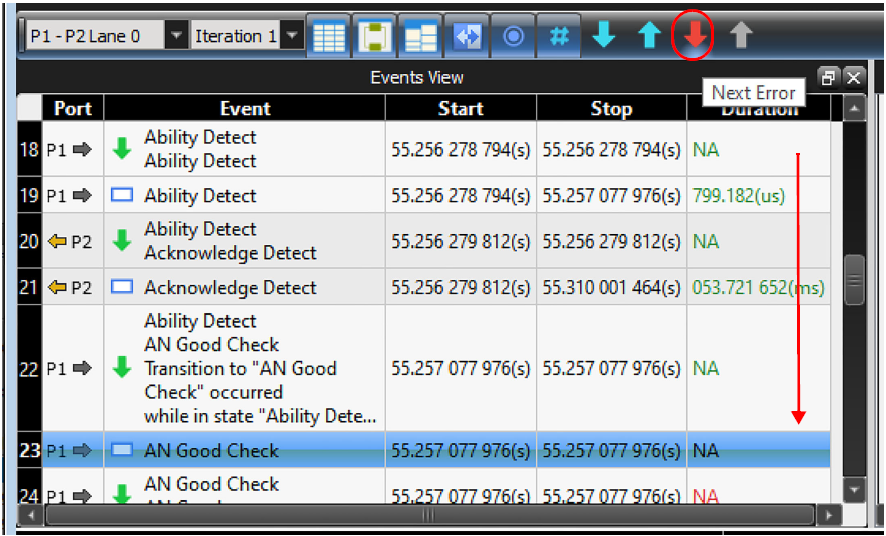
Go To Next Error
Display moves to the Next Error.
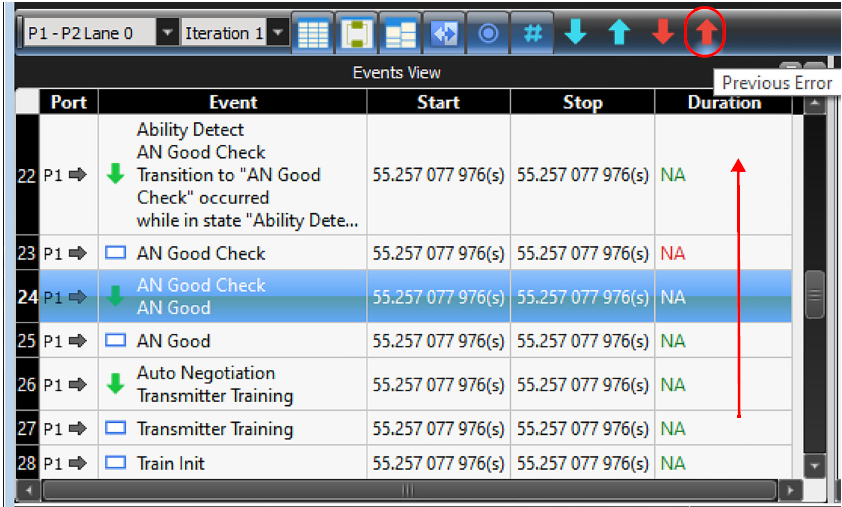
Go To Previous Error
Display moves to Previous Error.
Trace Expert
Trace Expert generates the following reports and analysis for the currently loaded trace:
-
Performance Analysis
-
Error Reports
-
Trace Analysis Statistics
-
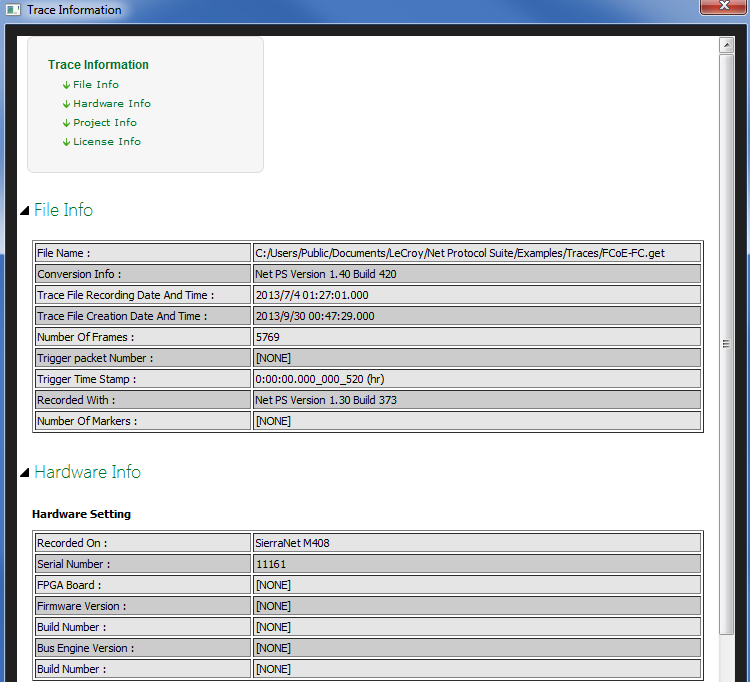
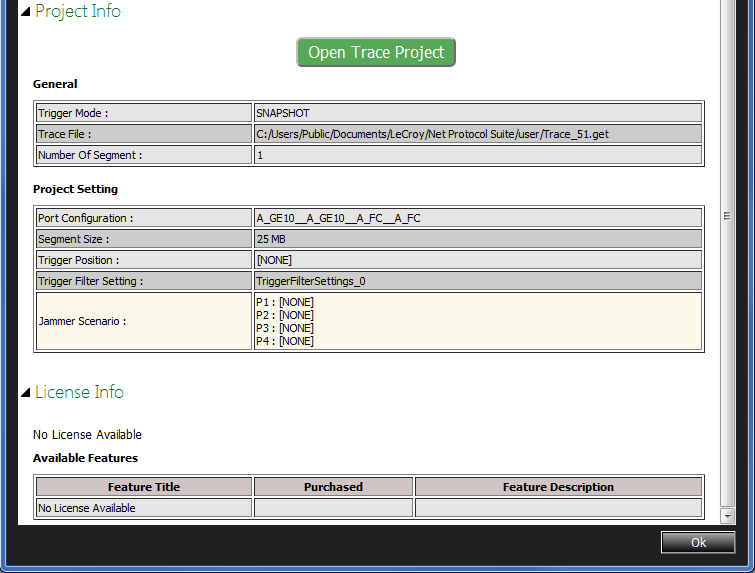
Trace Information
For more details, see Trace Expert.
Trace Information
Click on Analysis and select Trace Information or click the 
Verification Script
The Verification Script Engine allows you to select from available traces and execute verification scripts on them. For more details, see Verification Script Engine (VSE).
RTT Pairs
Round-trip time (RTT), also called round-trip delay, is the time required for a signal pulse or packet to travel from a specific source to a specific destination and back again. In this context, the source is the computer initiating the signal and the destination is a remote computer or system that receives the signal and retransmits it. For more details, see Round Trip Time (RTT) Pairs.