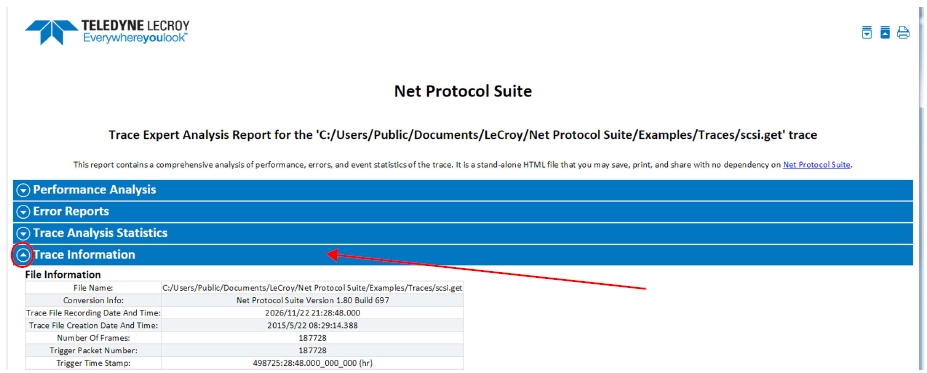
Trace Expert generates the following reports and analysis for the currently loaded trace:
-
Performance Analysis
-
Error Reports
-
Trace Analysis Statistics
-
Trace Information
-
To use Trace Expert, load a saved Trace you want to examine.
In this example, “iSCSI-FC.get” has been loaded. This trace is used as an example and may not be suitable for all analyzers, but the basic steps are the same for any analyzer.
-
Click the Trace Expert icon


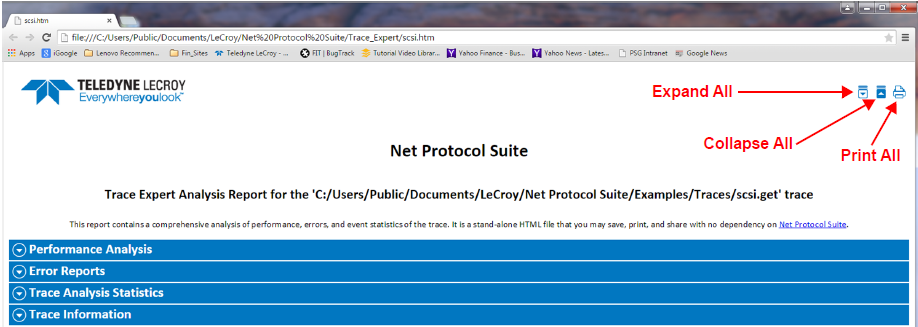
The Trace Expert main window appears in your default web browser. It contains buttons for Expand All, Collapse All, and Print All. The main window also contains four topics (bottom of screen).
-
Select any of the four topics to display its information.
Performance Analysis
-
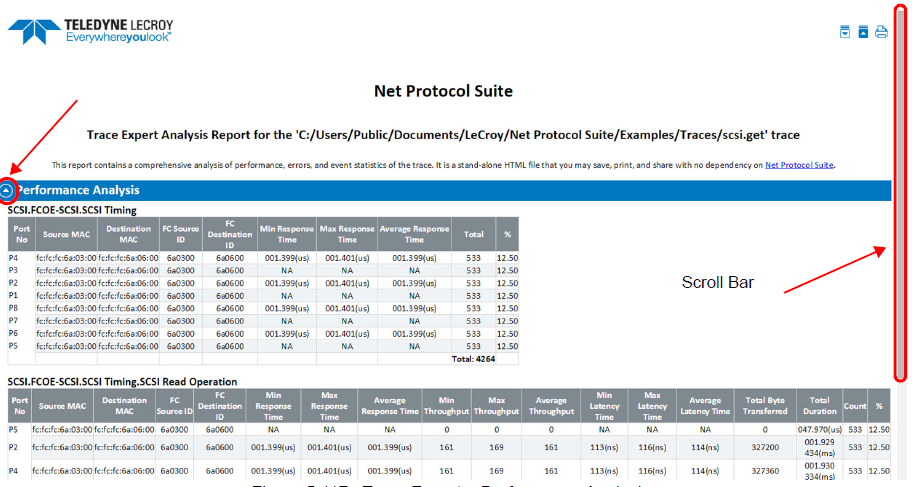
To view Performance Analysis, click its

-
Use the scroll bar to see more data.
Error Reports
-
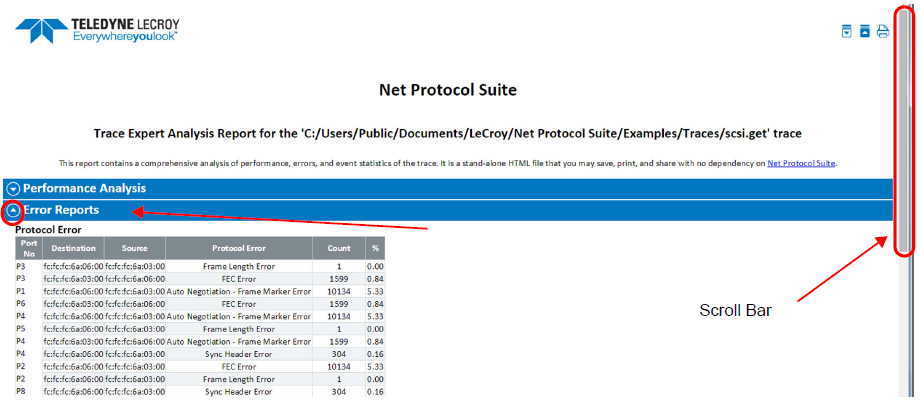
To view the Error Report, click its

-
Use the scroll bar to see more data.
Trace Analysis Statistics
-
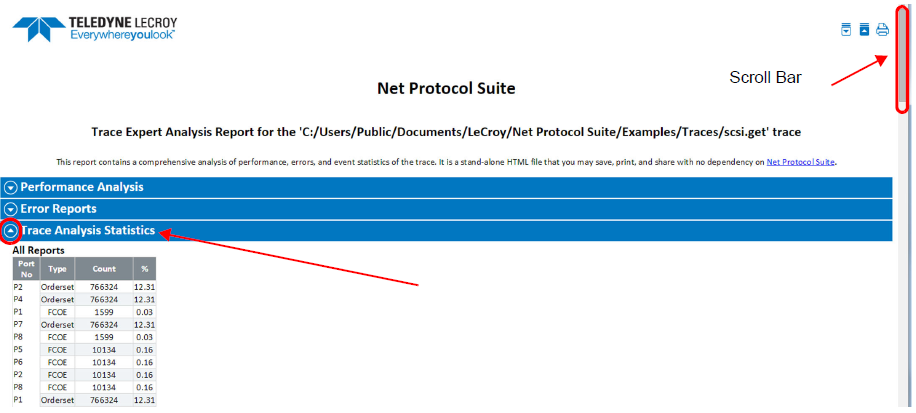
To view the Trace Analysis Statistics, click its

-
Use the scroll bar to see more data.
Trace File Information
To view the Trace File Information, click its 
The Trace Expert html file is located at: C:/Users/Public/Documents/LeCroy/Net%20Protocol%20Suite/User/scsi_tmp.htm