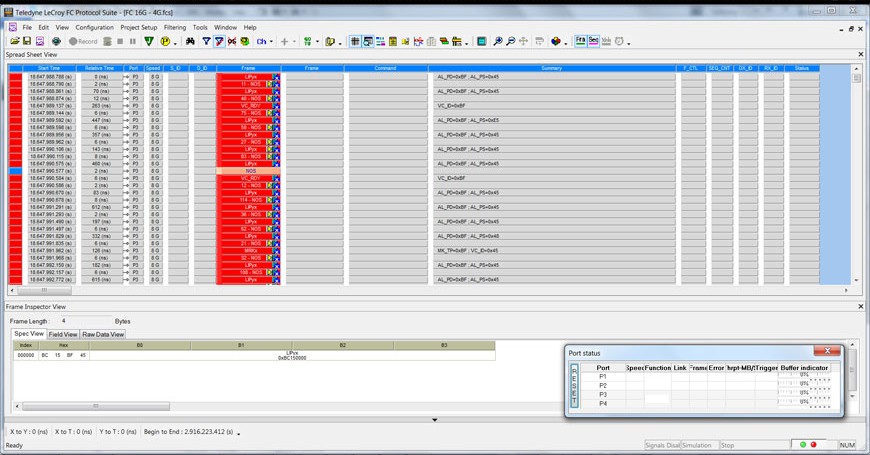
The Setup menu has the following options to set up and configure the device:
Device Management
Click Device Management to display the Device Management dialog. Refer to Device Management for more information.
Preferences
Preferences option allows you to set the software and display settings.
Go to Setup > Preferences or click the 
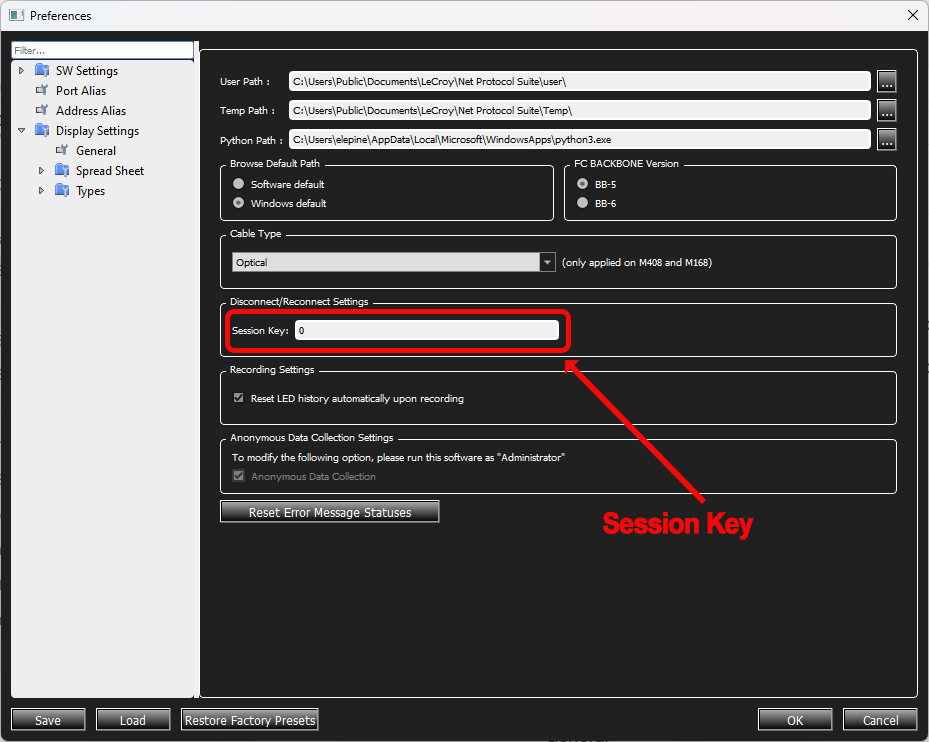
The following can be configured in Preferences:
-
Software Settings
-
General
-
Trace
-
Decoding Assignment
-
-
Port Alias
-
Address Alias
-
Display settings
-
General
-
Spread Sheet
-
Property
-
Column Sets
-
-
Types
-
Frame Types
-
Ports
-
Field Attributes
-
Pre-defined Columns
-
-
Software Settings
Software Settings allow you to define template files for new Analyzer projects, to specify how trace files appear when opened, and to set Spec Assignment.
General Settings
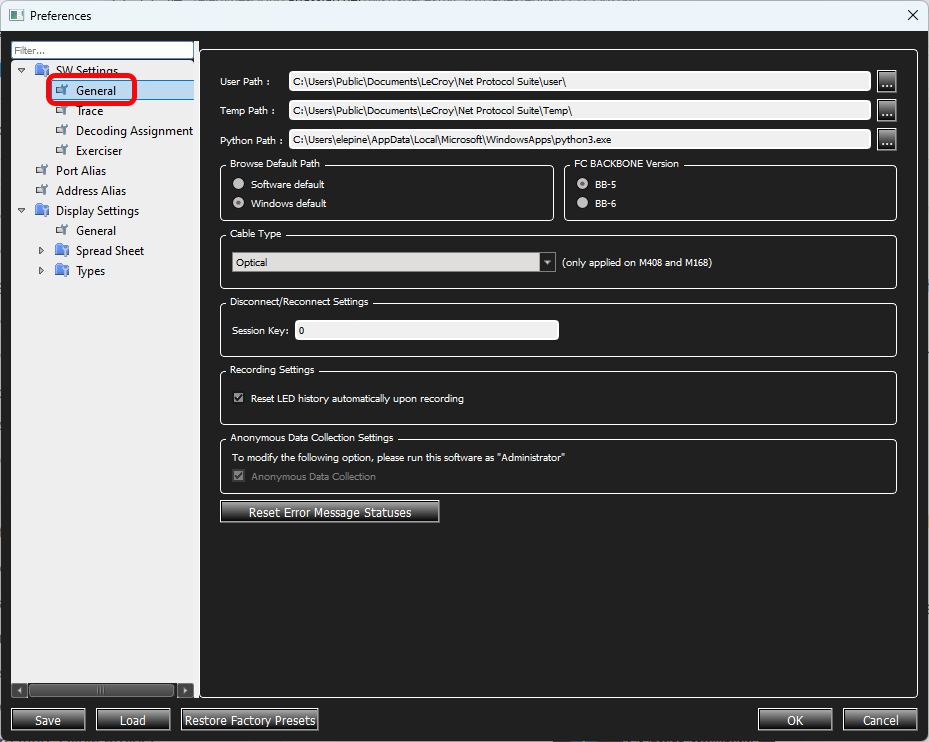
In General Settings you can select:
-
User Path, Temp Path, and Python Path by clicking the

-
Browse Default Path for the software or for Windows
-
FC BACKBONE Version: BB-5 or BB-6
-
Cable Type from the drop-down list
-
Disconnect/Reconnect Settings, containing the Session Key
-
Recording Settings: Toggle Reset LED history automatically upon recording on and off using the checkbox
-
Anonymous Data Collection Settings: Only Administrators can modify this setting,
-
Reset Error Message Statuses
Trace View
For Trace View, only the Enable Quick View check box is automatically selected. This helps to speed up uploading and processing time. If the other options are selected, the uploading and processing time will be negatively impacted, resulting in much slower load times.
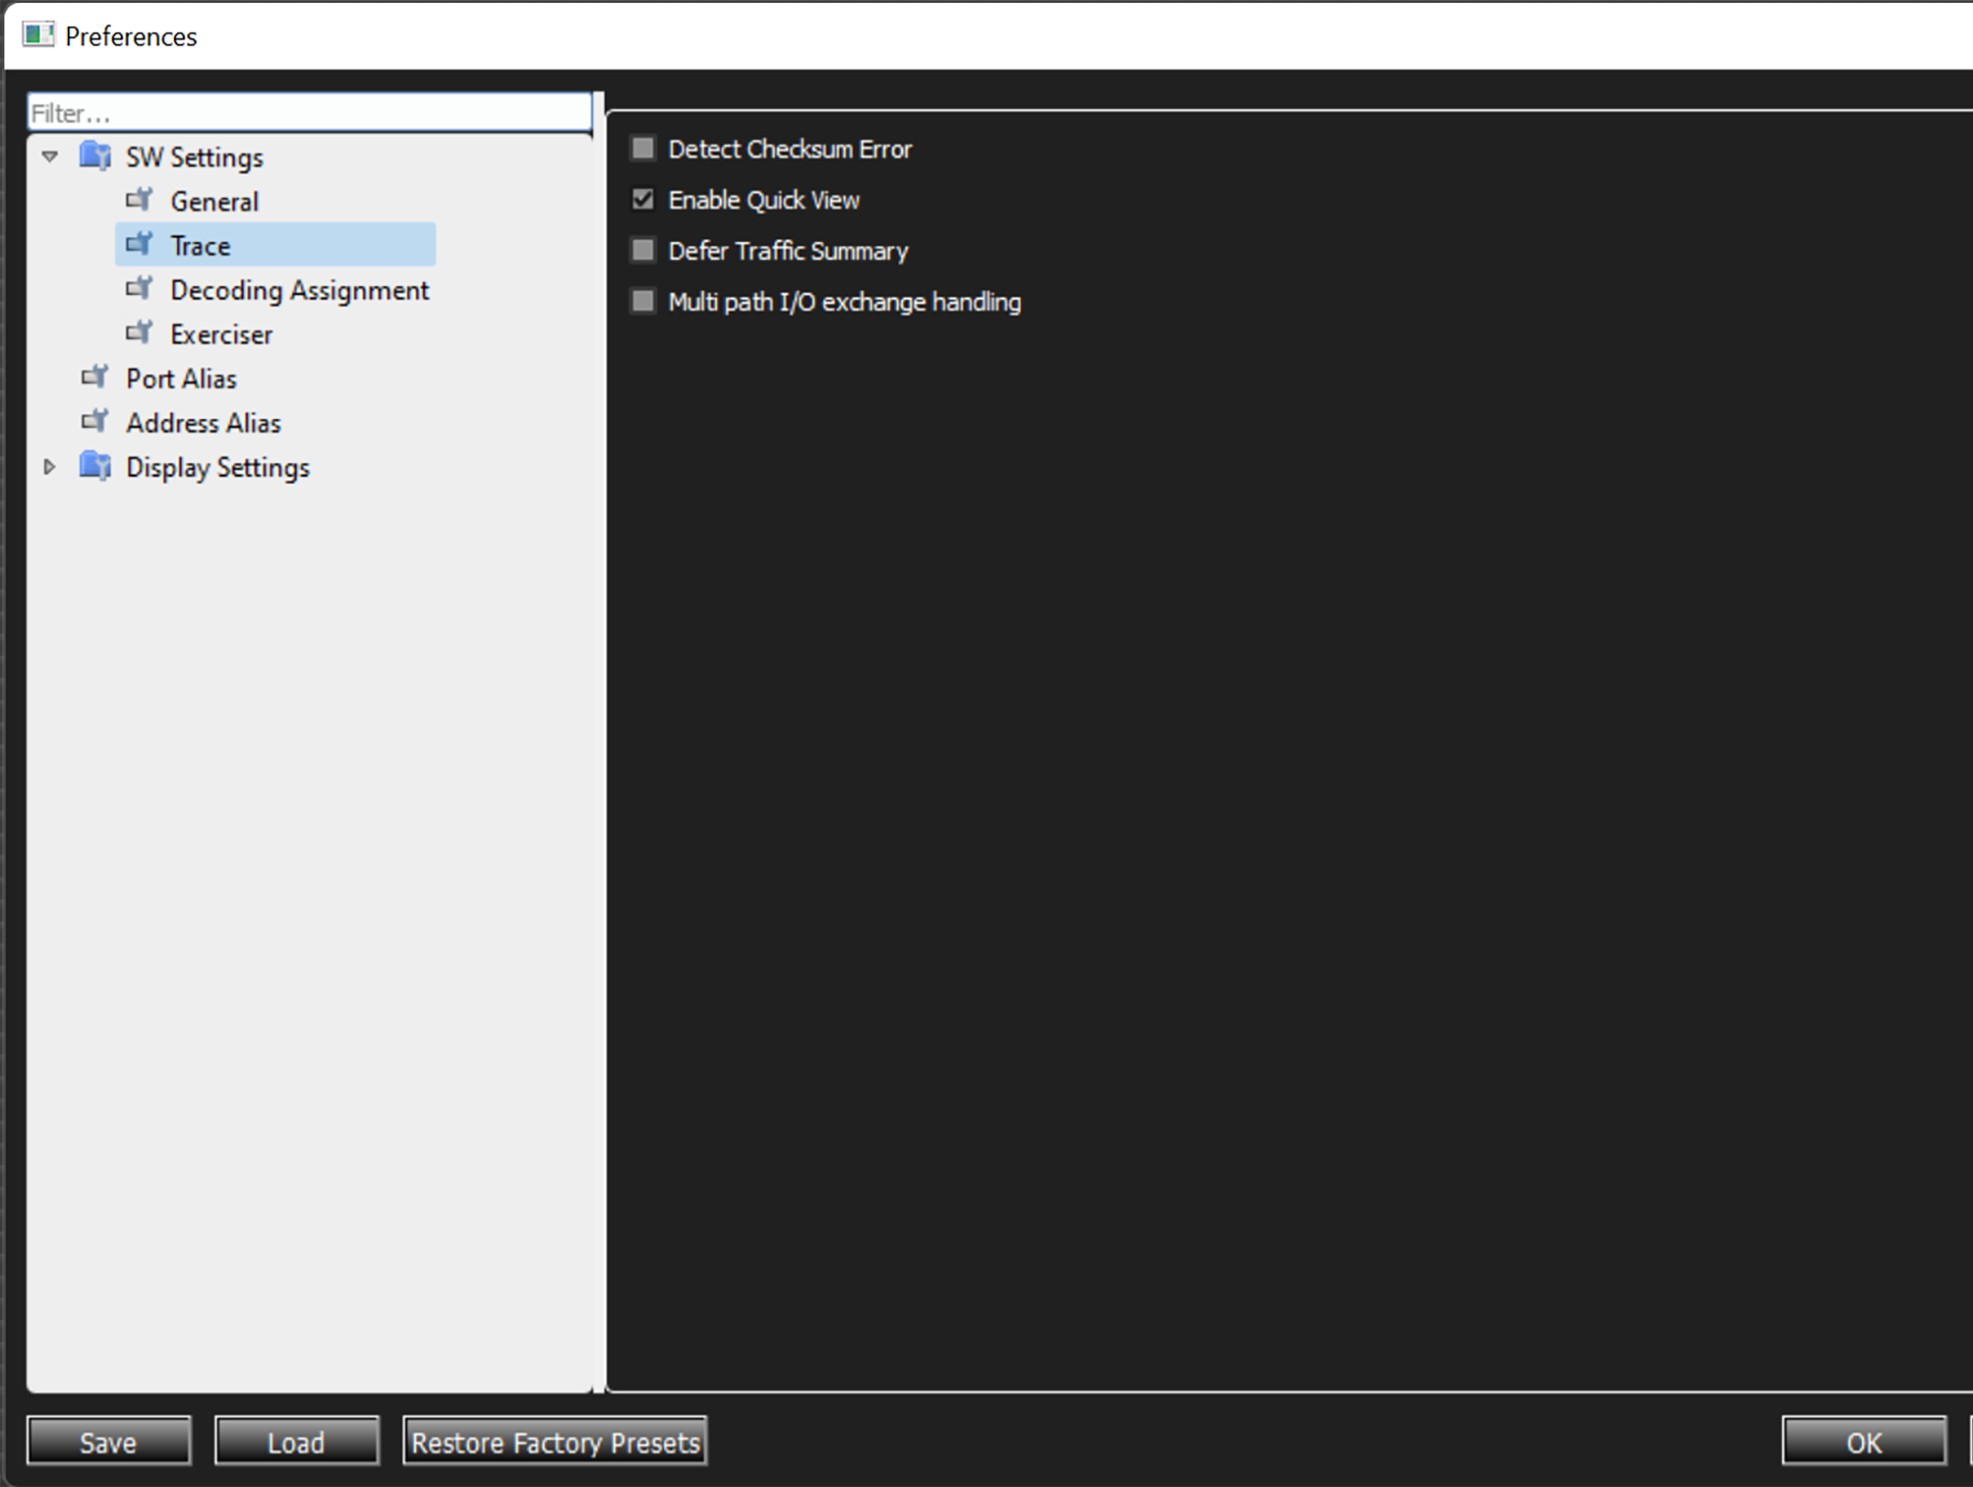
Detect Checksum Error
Selecting the Detect Checksum Error allows you to detect the CRC error on IP, TCP and UDP frames.
Enable Quick View
By default, Enable Quick View is selected in Software Settings. Quick View allows quick, full access to the entire trace, especially when using a Gigabit Ethernet connection. However, the trace is NOT written to the host machine hard drive. To save the trace, you must manually select Save or Save As.
-
If you select Save, the application saves the entire trace to a default file name. The trace remains open and its name is updated to reflect the saved location.
-
If you select Save As, the application saves the trace to the specified location, and opens that trace from the new location. The original Quick View mode trace remains open as well.
-
If you clear Quick View in the Software Settings, the trace loads slower, however, it is automatically saved to the host machine hard drive. When Quick View is Enabled, the Viewer displays successive parts of trace data as they upload. As soon as a trace part uploads, it is available in all trace views.
-
If you only need quick successive traces, and do not need to save them, keep the default setting to enable Quick View.
-
If you need to save all captured traces, clearing the Quick View checkbox loads the traces faster, especially for larger traces and slower connections.
-
To refresh the viewer display with more uploaded data, scroll to the end of the trace, using scroll bars, page down, arrow down, or CTRL+End. Newly uploaded data then appears there.
Note: High-level decoding and statistics are available only after the whole trace has uploaded.
-
After the trace finishes uploading, the software automatically switches to full trace view.
-
To go to the beginning of an uploaded trace, press CTRL+Home, or CTRL+End to go to the end of an uploaded trace.
Defer Traffic Summary
Checking the Defer Traffic Summary checkbox defers making the traffic summary report during uploading. Deferring the report can reduce uploading time for some kinds of traffic. When enabled, the trace does not contain the traffic summary. When the traffic summary is opened for the first time, the software generates the traffic summary report.
Multipath I/O Exchange Handling
Check this option for wide traffic (i.e., when exchange frames come on different ports, not only pair ports). The software will then be able to detect wide exchanges.
Decoding Assignments
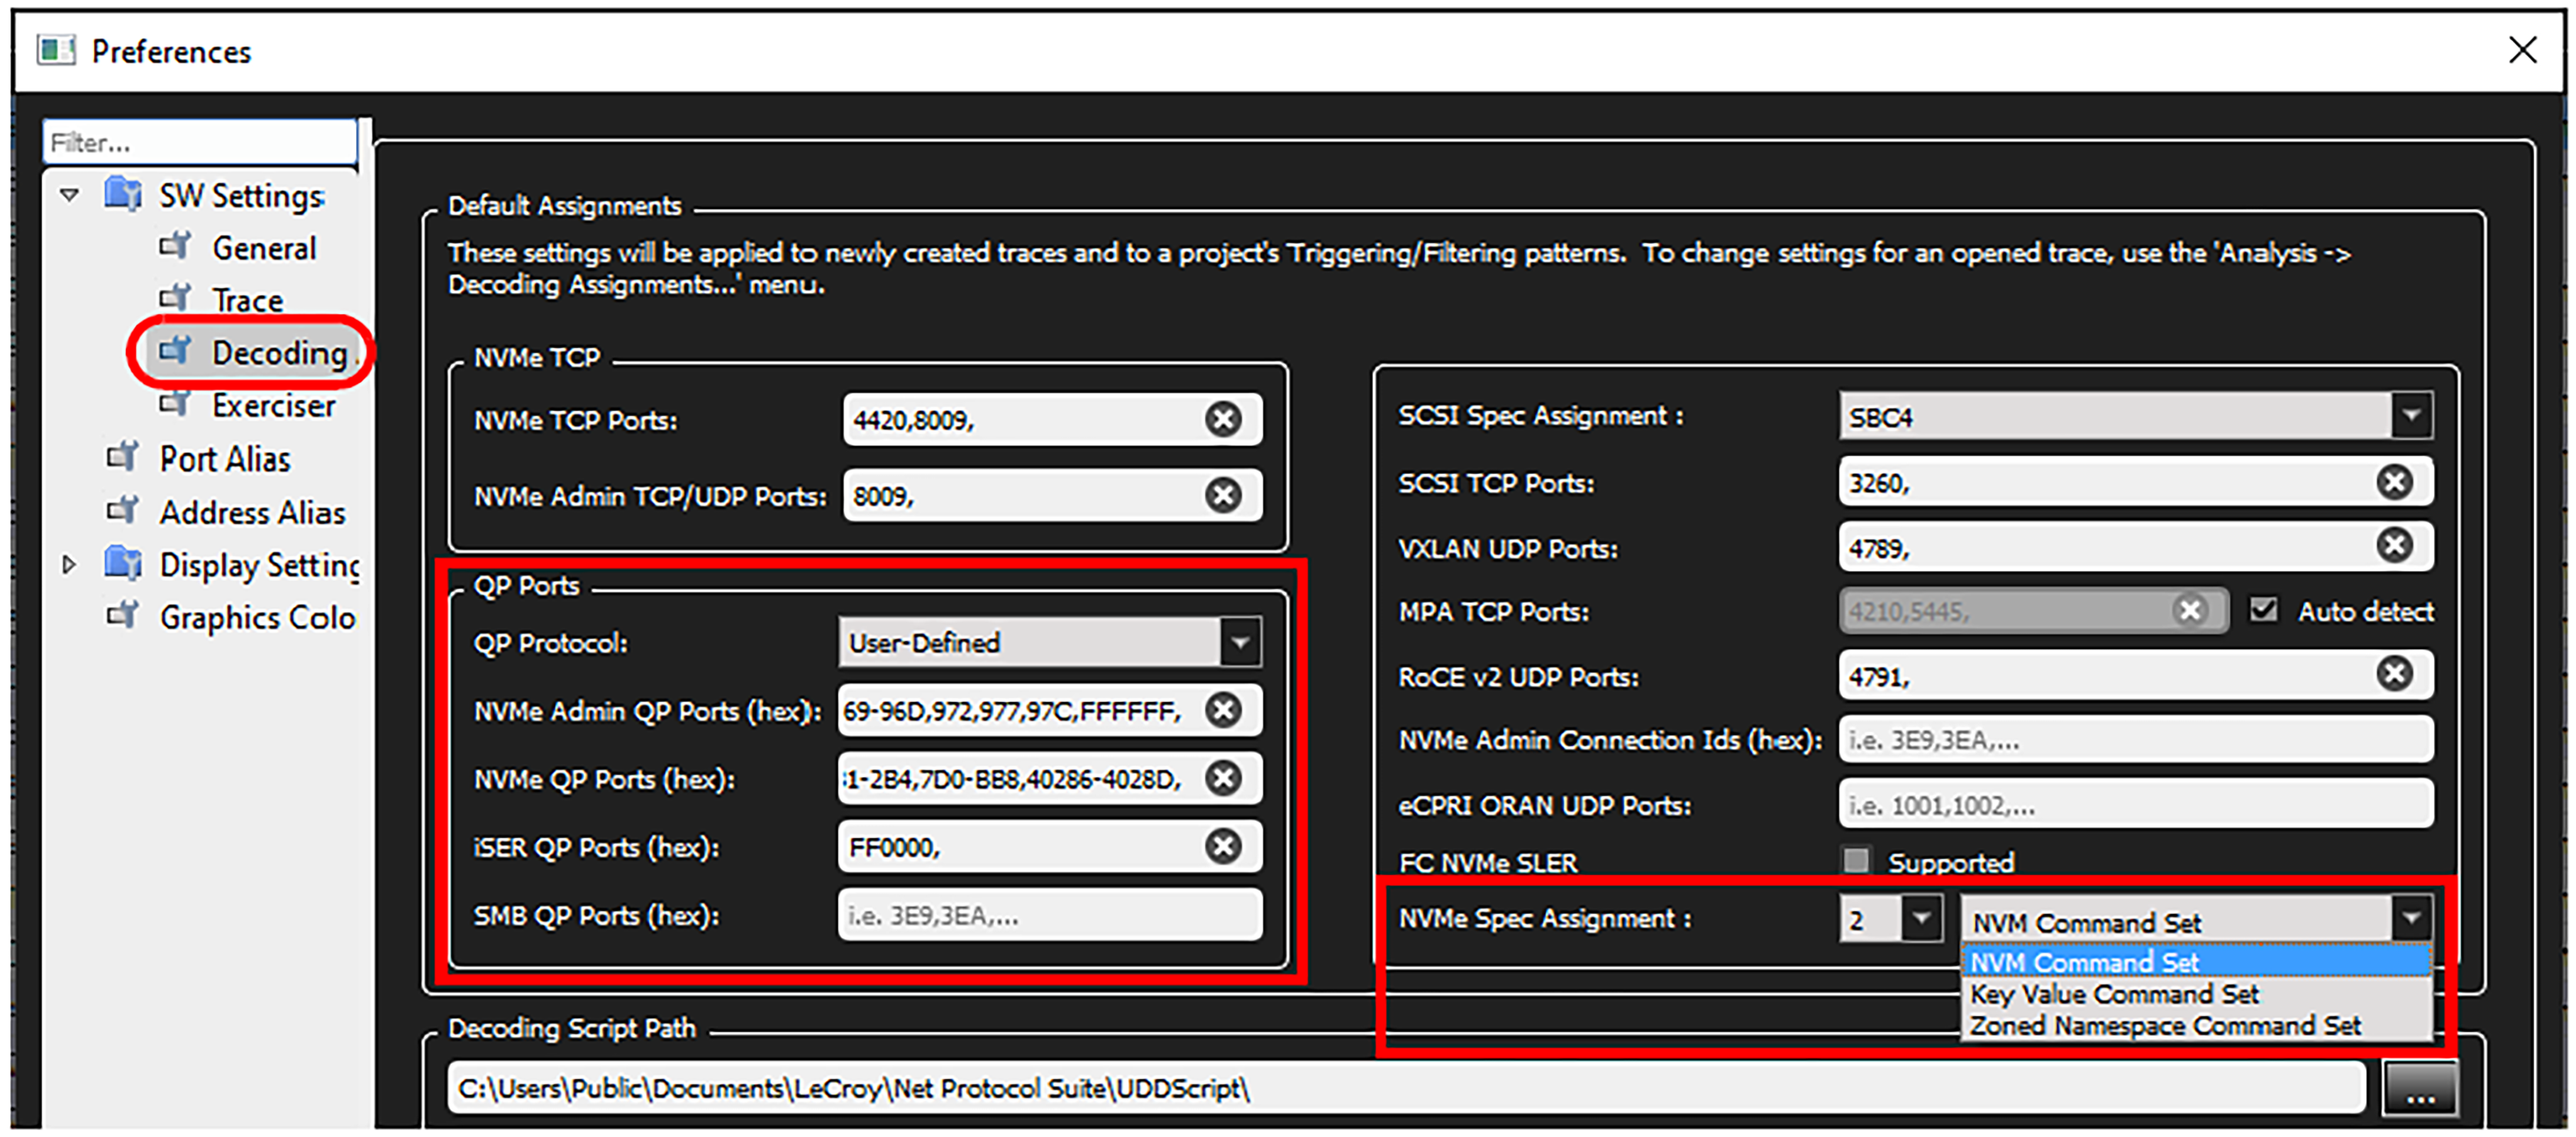
In the Preferences dialog you can see the default decoders available. These settings enable you to customize which protocol decoders are applied to new traces or when displaying previously captured traces. You can add different port numbers or SCSI spec assignments. There is also a Decoding Script Path you can use to load a custom decoding script. Any changes you make will become the default decoding assignments for all traces. The final section allows you to add a custom script to different Protocols and traffic types.
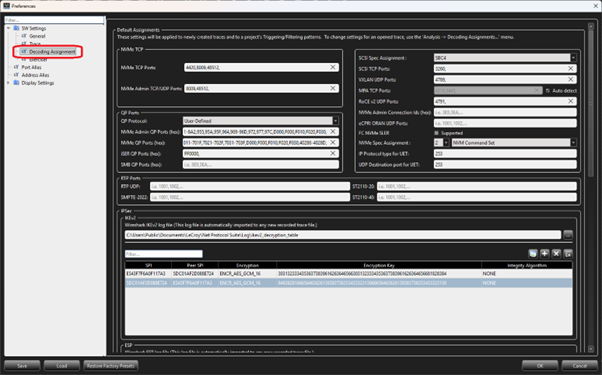
Default Assigments
-
SCSI Spec Assignment: Select which SCSI command set to apply for decoding of SCSI
commands. -
SCSI TCP Ports: Set which TCP ports are assigned for the iSCSI protocol.
-
VXLAN UDP Ports: Set which UDP ports are assigned for the VXLAN protocol.
-
MPA TCP Ports: Set which TCP ports are assigned for the MPA protocol on
specific ports or selecting Automatic MPA Detection. -
IB BTH UDP Ports: Set which IB BTH UDP ports are assigned for the IB BTH
protocol. -
NVMe QP Ports: Set which aligned port pairs (QP) are assigned for the NVMe protocol.
-
iSER QP Ports: Set which aligned port pairs (QP) are assigned for the iSER
protocol.
IPSec Settings
Set the IPSec-ESP and IPSec-IKEv2 Encryption Key and algorithm to decrypt IPSec frames.
TLS Master-Secret Log Files Settings
Set the TLS master-secret key log files generated during recording. The master secret enables TLS decryption in Net PS and can be supplied via the Key Log File. The Key Log File format is described in The SSLKEYLOGFILE Format for TLS (available at https://tlswg.org/sslkeylogfile/draft-ietf-tls-keylogfile.html ).
Note: Enabling TLS introduces overhead in the indexing process. You should disable it if TLS traffic is not being recorded.
Decoding Script Path Settings
Script Path: Set the base script directory used for looking up user-defined decoding scripts.
Protocol, Address, and Script
You can selectively Remove a single protocol or Remove All.
-
Ethernet: ARP
-
Ethernet: LLDP
-
IP: UDP
-
IP: LLDP
-
IP: HOPORT
-
RROCE
-
MAD over RROCE
These settings can also be controlled from the Main Toolbar on a trace by trace basis.
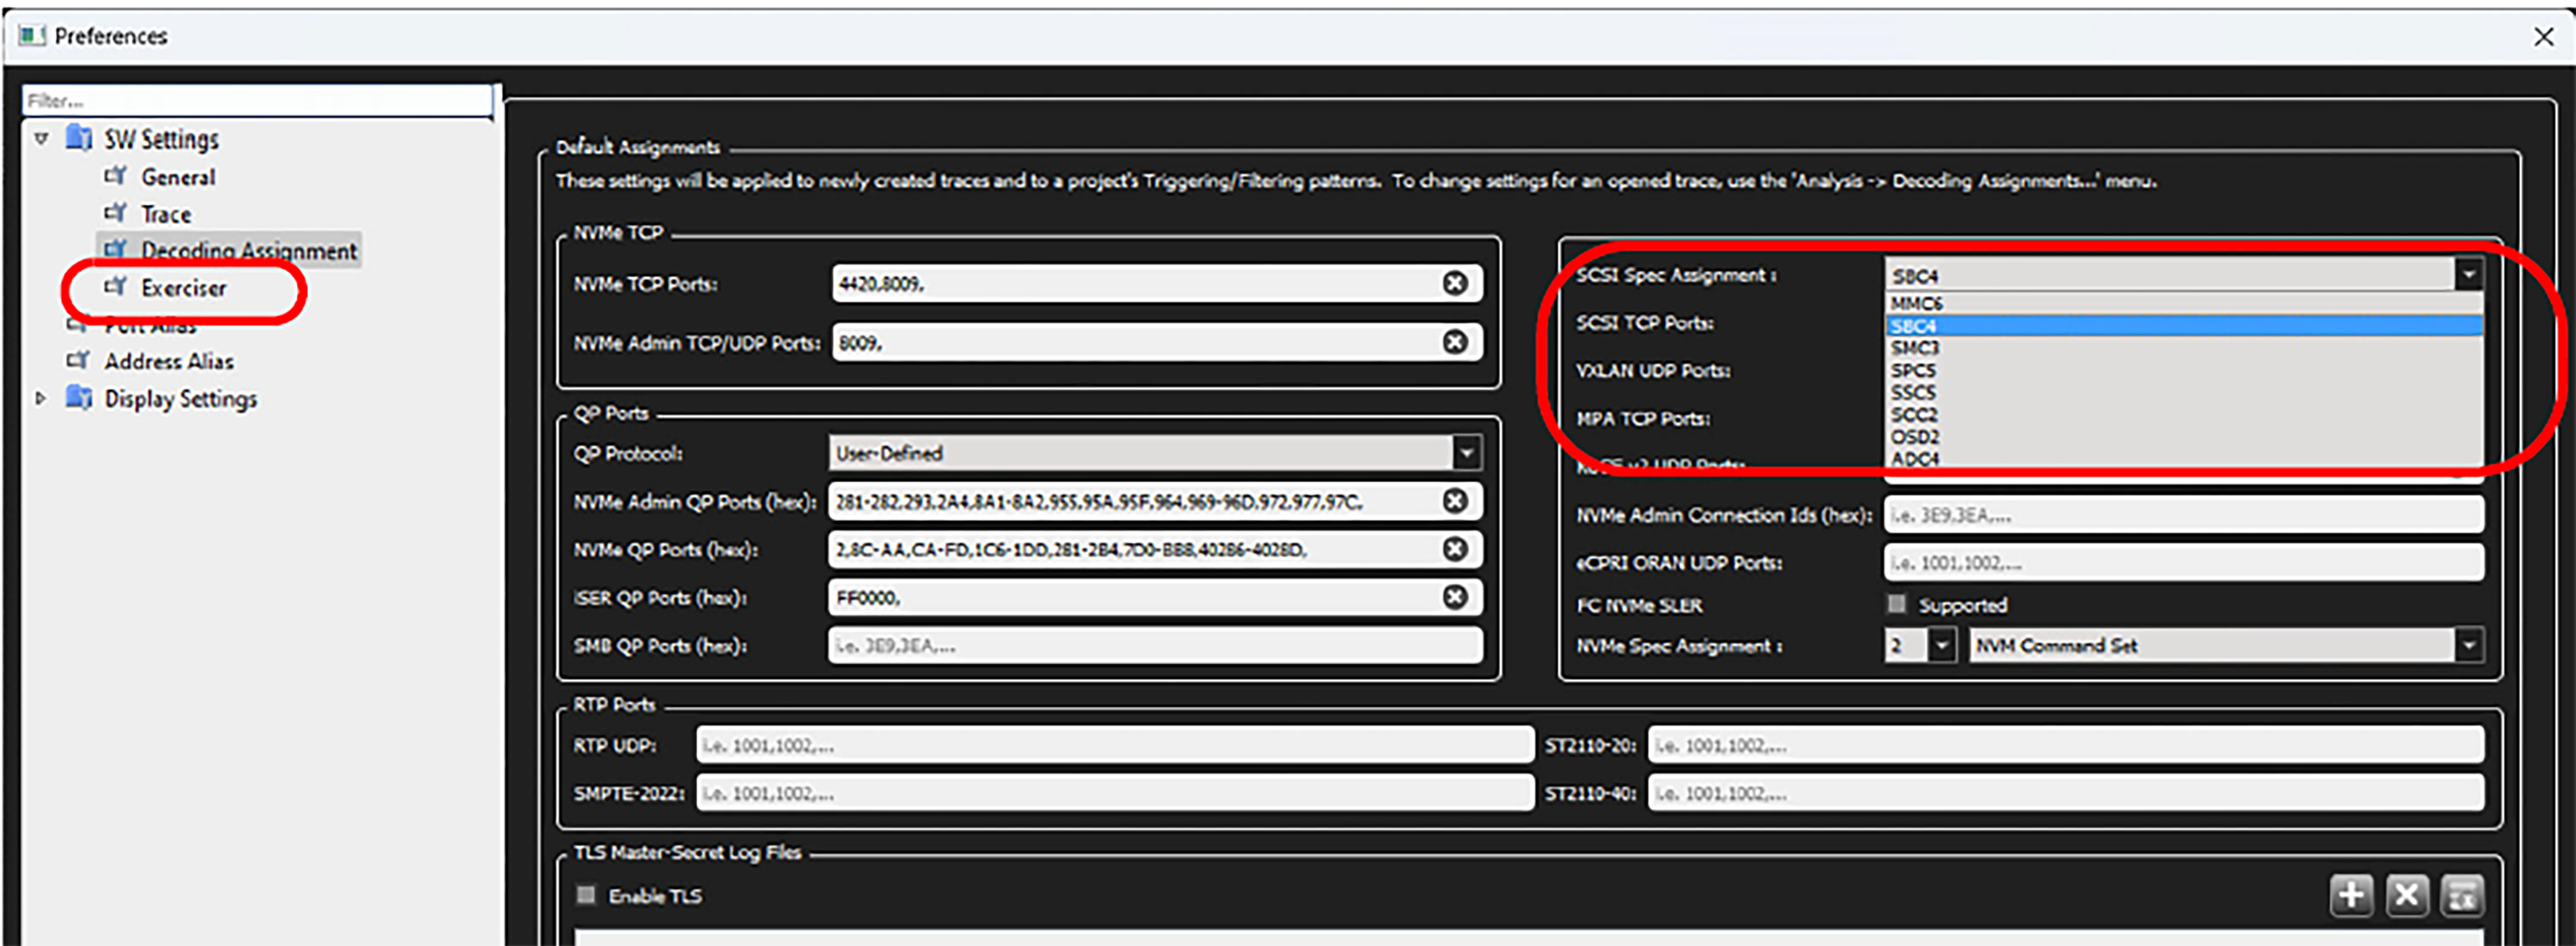
SCSI Spec Assignment
The Decoding Assignments allow the user to configure SCSI command set assignments, well-known port numbers assignments, and decoding script assignments.
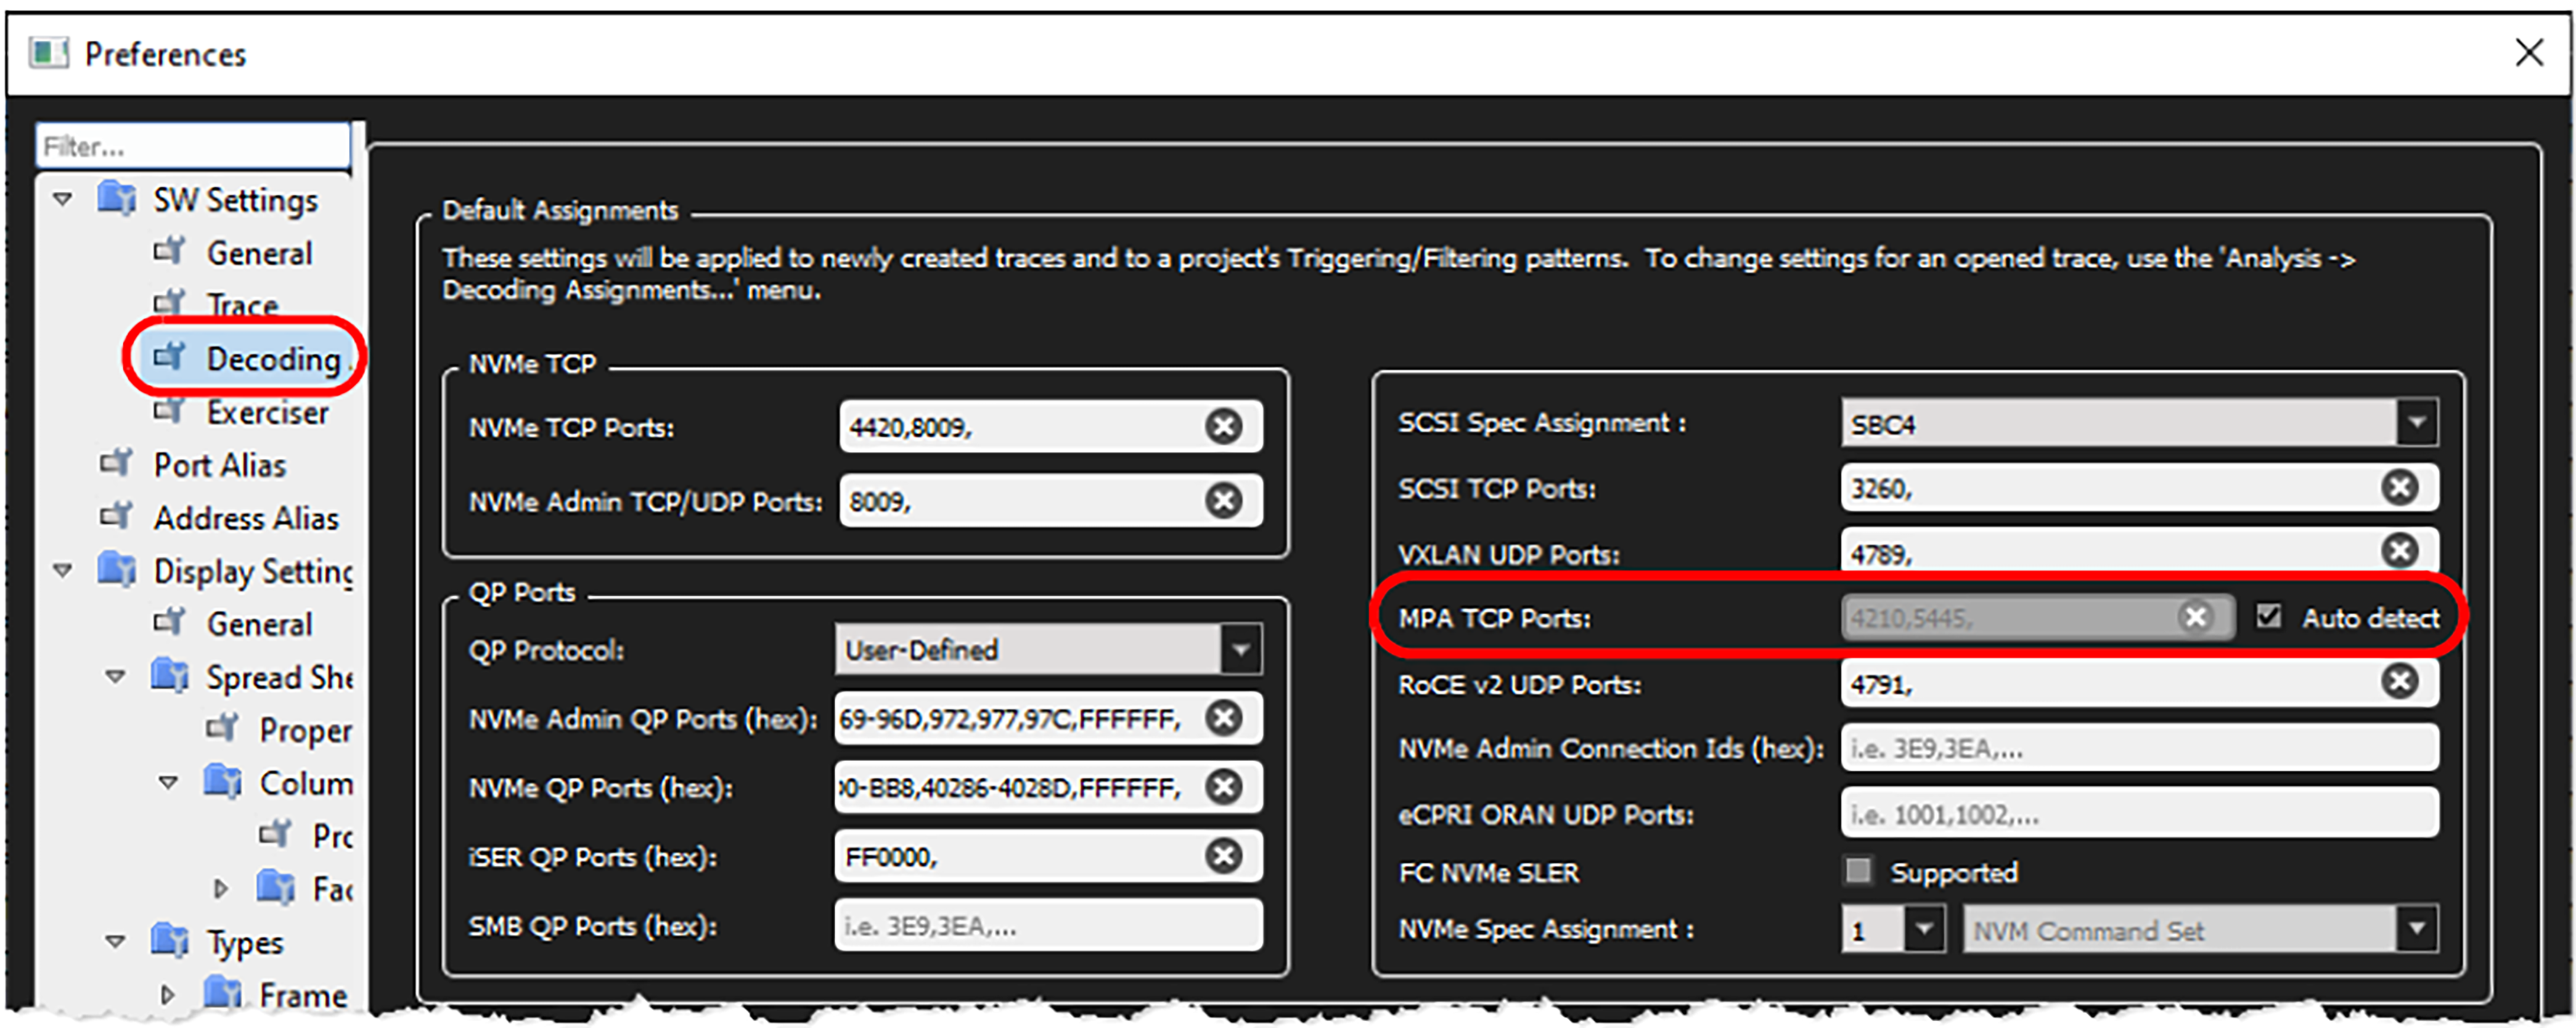
Automatic MPA Detection
The MPA TCP Ports can be set to the default ports of 4210 and 5445 or Automatic MPA Detection, which changes the MPA TCP ports from the assigned ports to any port.
NVMe Spec Assignment
Decoding Assignments allows you to configure which NVMe QP ports are detectable and to select the NVMe Spec Assignment. You can select to decode per NVMe spec 1 or NVMe spec 2, which allows you to choose the NVM Command Set, Key Value Command Set, or Zoned Namespace Command Set.
Port Alias
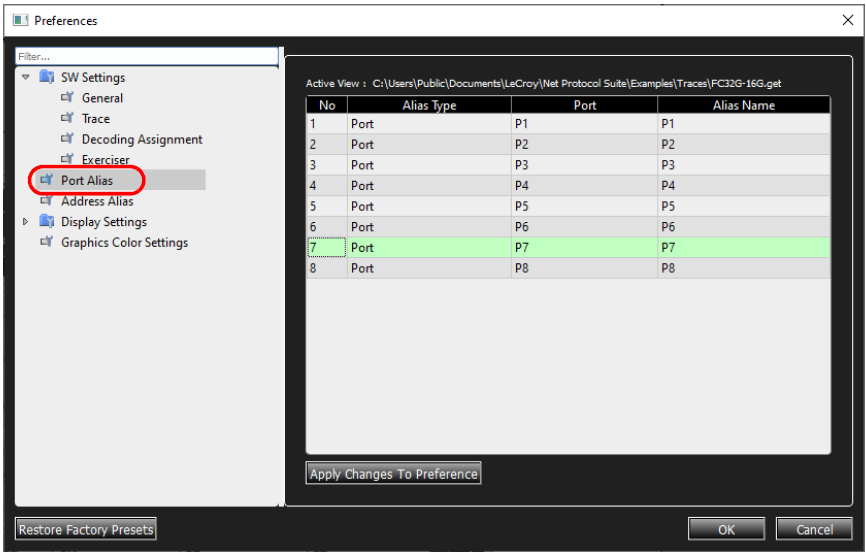
Port Alias allows you to assign a meaningful name to each port to assist in interpreting the results displayed in the trace view. You can set the alias name for each port. Double-click an Alias Name, then enter a preferred name.
Address Alias
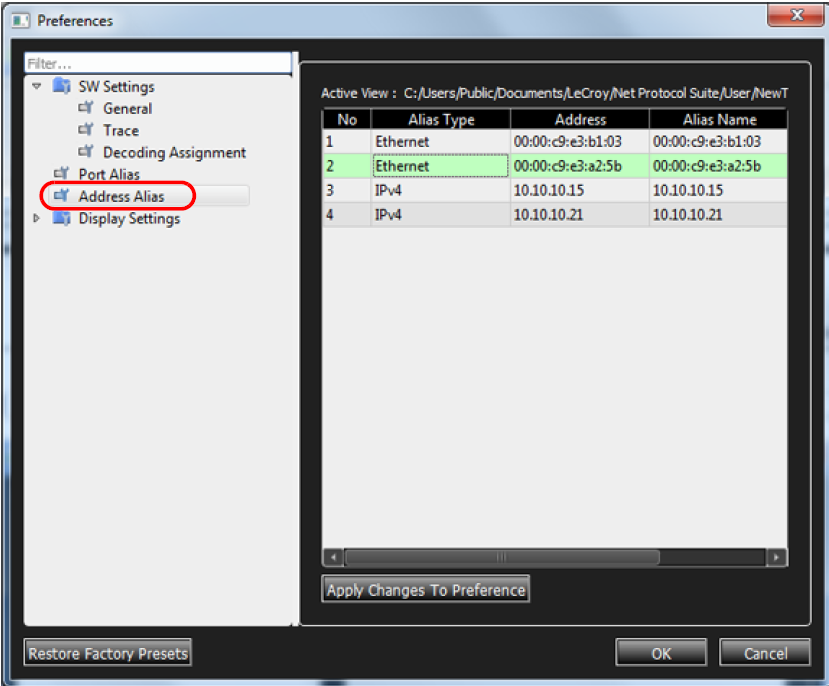
Address Alias allows you to assign a meaningful name to each address to assist in interpreting the results displayed in the trace view You can set the alias name for each address. Double click an Alias Name and enter a new name.
Display Settings General
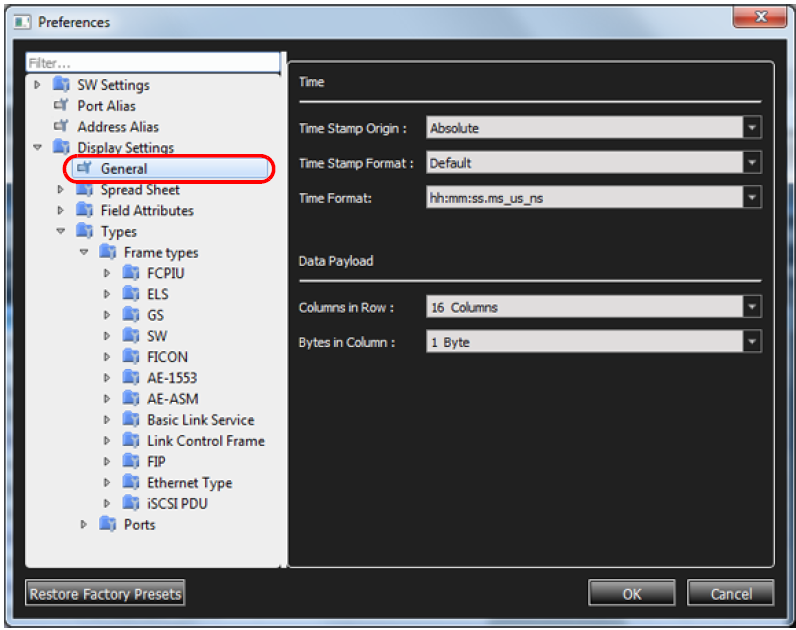
In General you can select the Time options and the Data Payload options from the drop-down lists.
Spreadsheet Property Settings
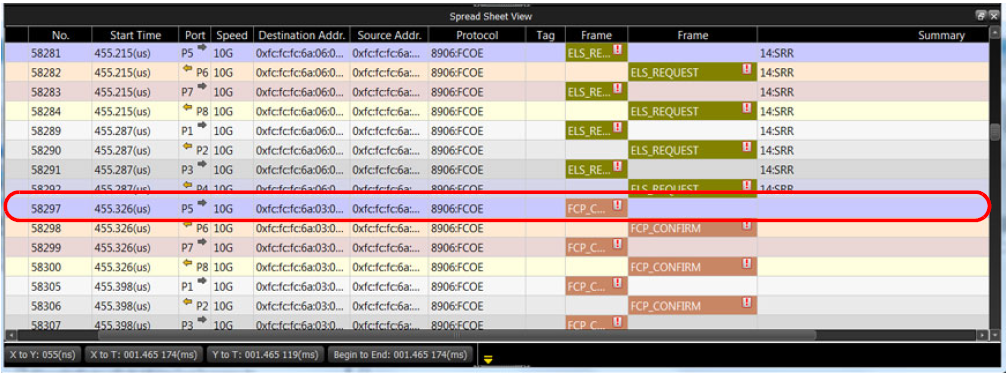
Under Spreadsheet, click Property and select a Color Setting option for row and column from the list.
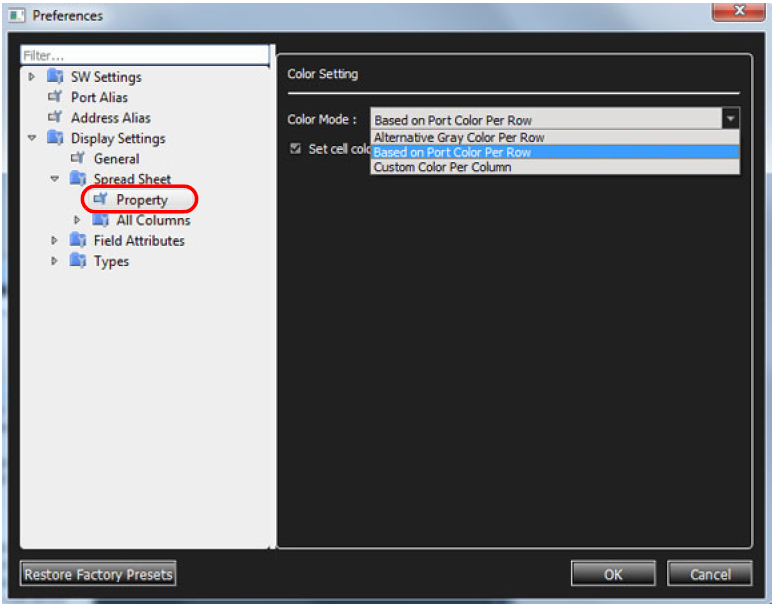
Note: The default color setting for the entire row is based on the port color.
Column Sets
A column set saves the columns defined in the Spreadsheet/Exchange View. You can modify any column set or define different column sets and switch between them in the viewer.
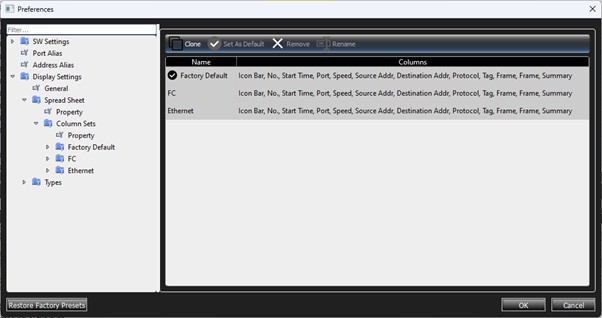
These Column Sets toolbar functionalities are available:
-
Clone: Clones an existing column set.
-
Set As Default: Sets the current column set as default. It is used to create the active column set when Net Protocol Suite is launched.
-
Remove: Removes the selected column set. The Factory Default setting cannot be removed.
-
Rename: Renames the selected column set. The Factory Default cannot be renamed.
Note: It’s easier to create and manipulate column sets from the viewer. See Column Set to explore this functionality.
Change Column Headings
-
To modify column headings and widths, go to Preferences.
You can select any of the Columns in the Preferences window pane and change their characteristics.
-
Column Name
-
Filter
-
Source Direction
-
Colors
-
Combination of Data
-
Alignment
-
Width
-
Once you have changed the Columns, open a Trace and see the results.
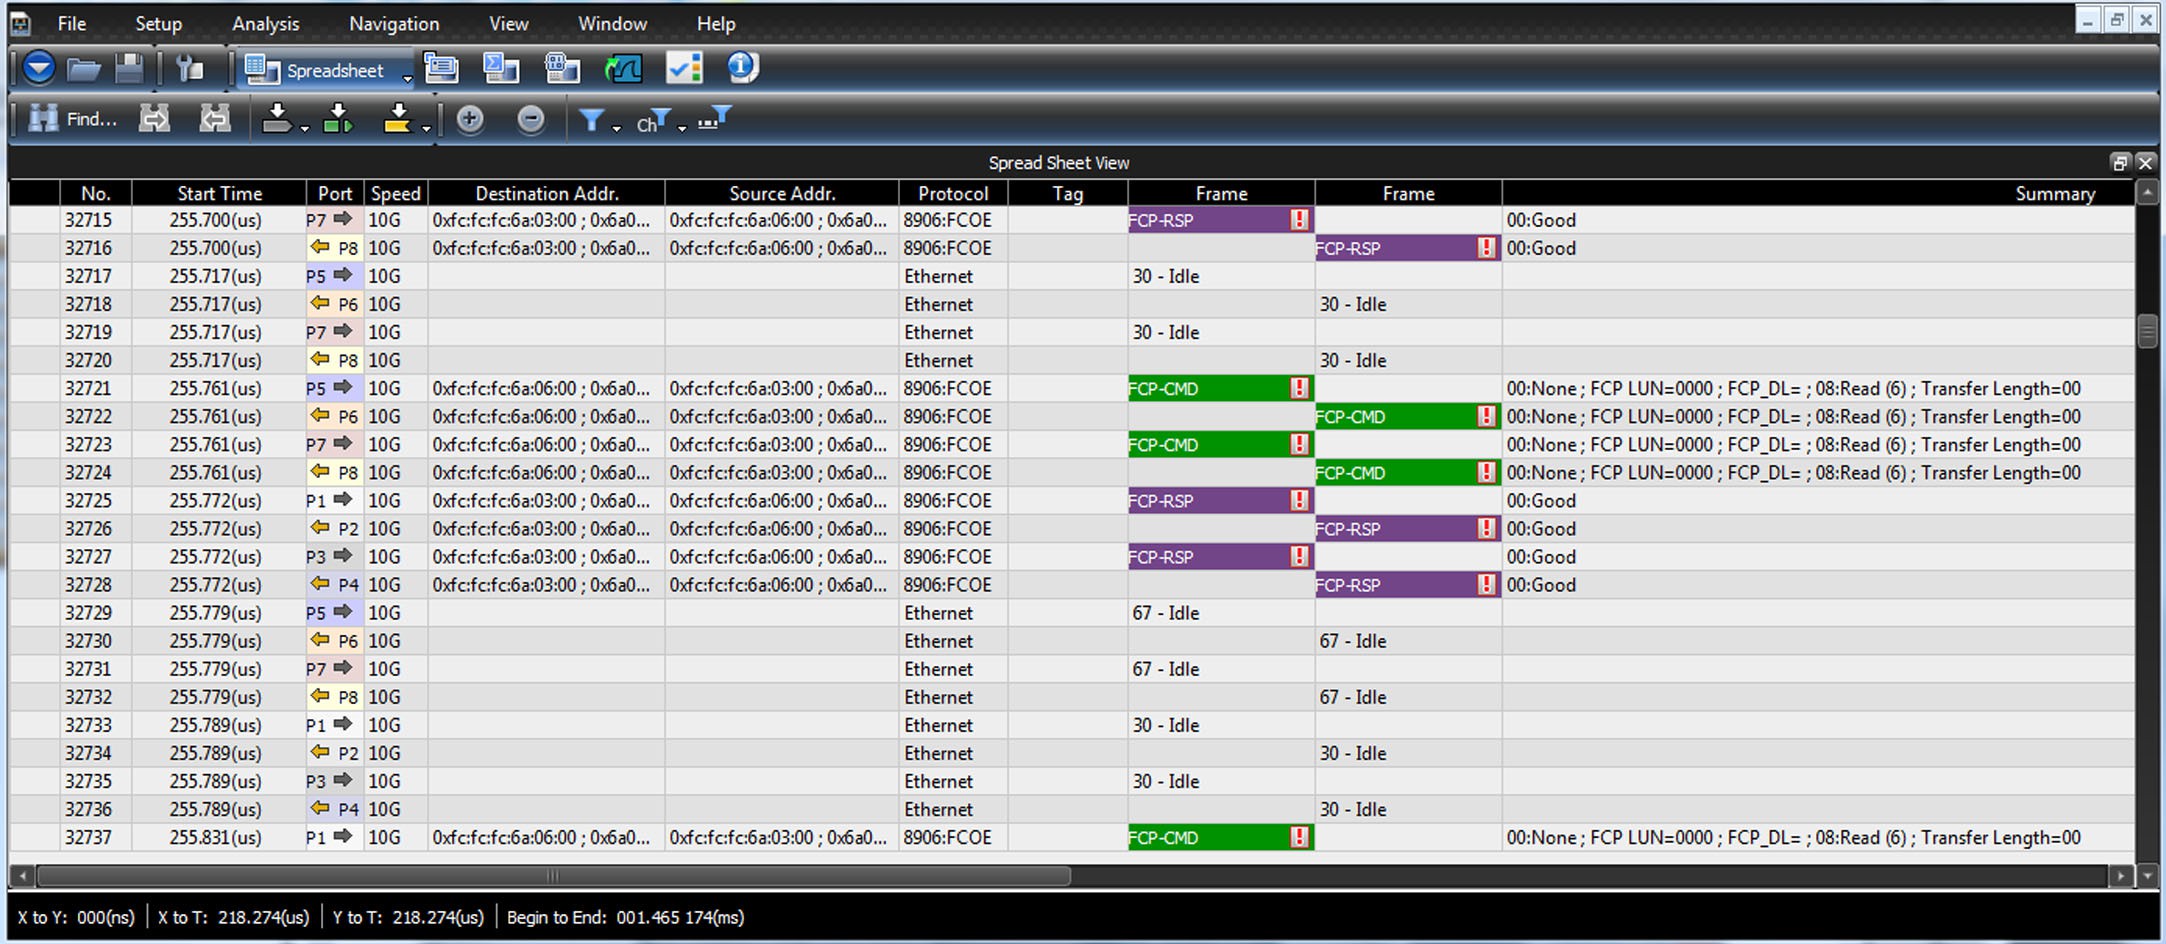
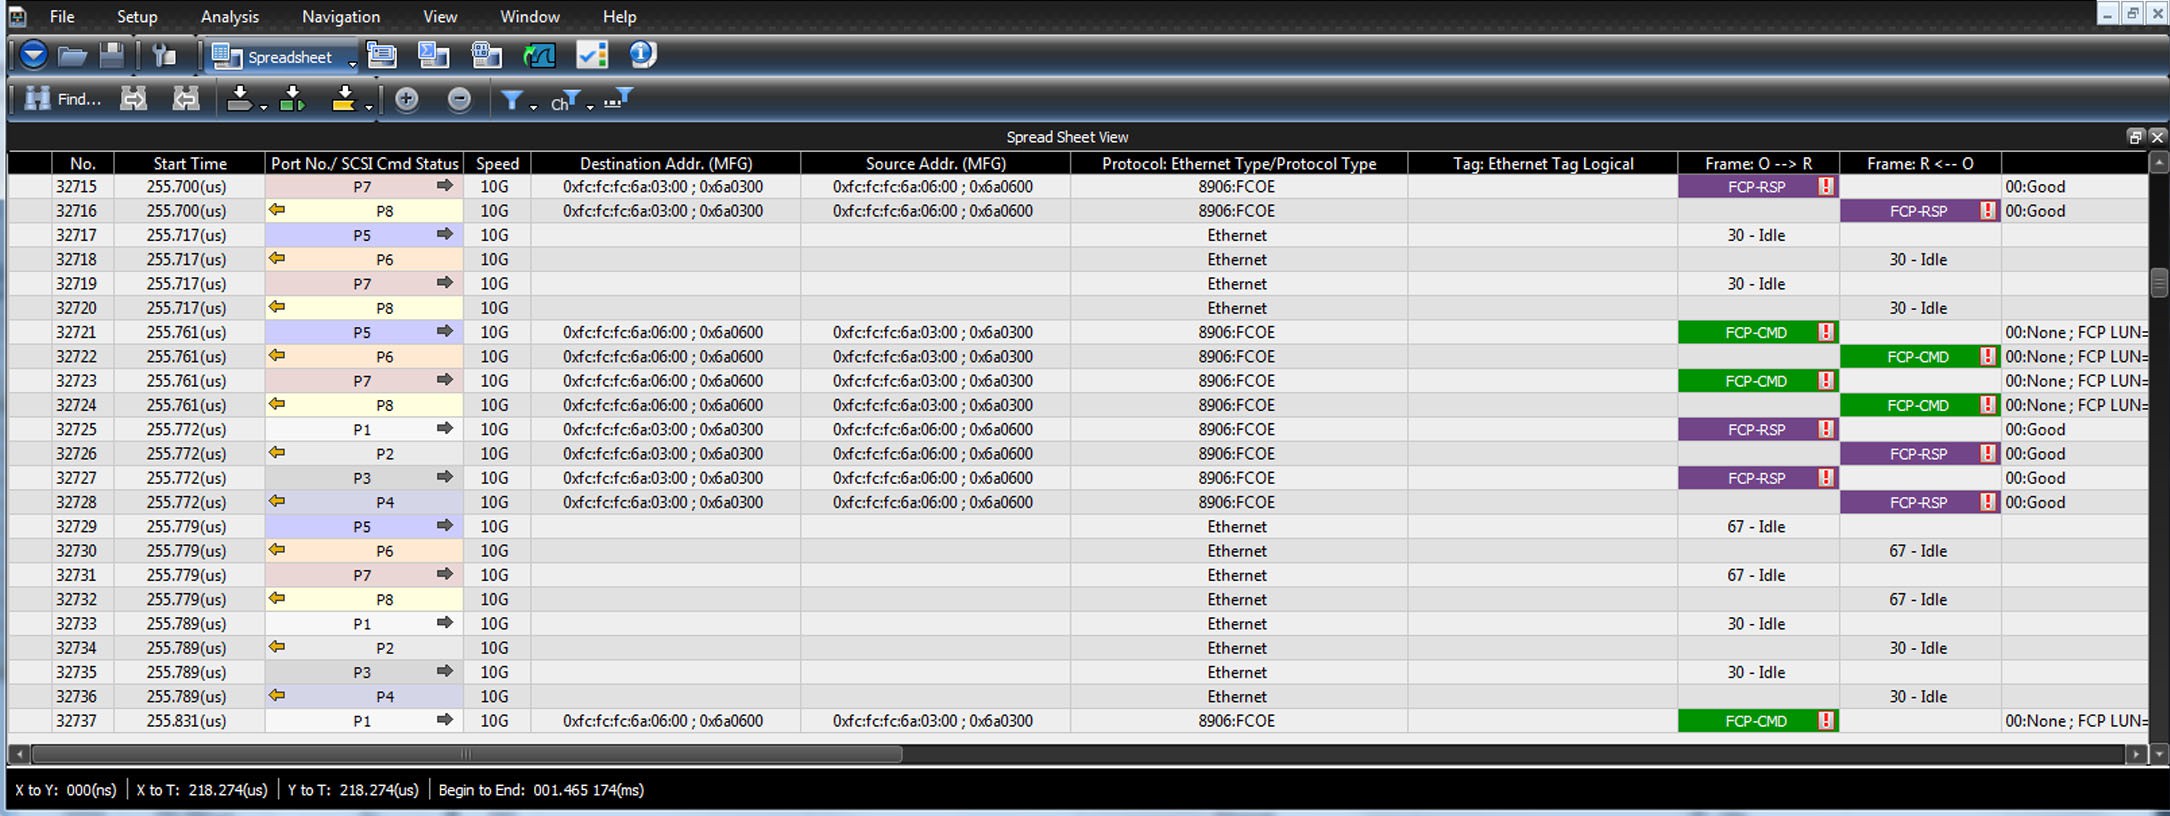
The image below shows a very simple example of what you can do. There are changes to the column widths, column titles, and the filters used for the displayed column information.
-
To save the changes made to the column headings, delete the trace and the project panes, so that only Net Protocol Suite pane is open.
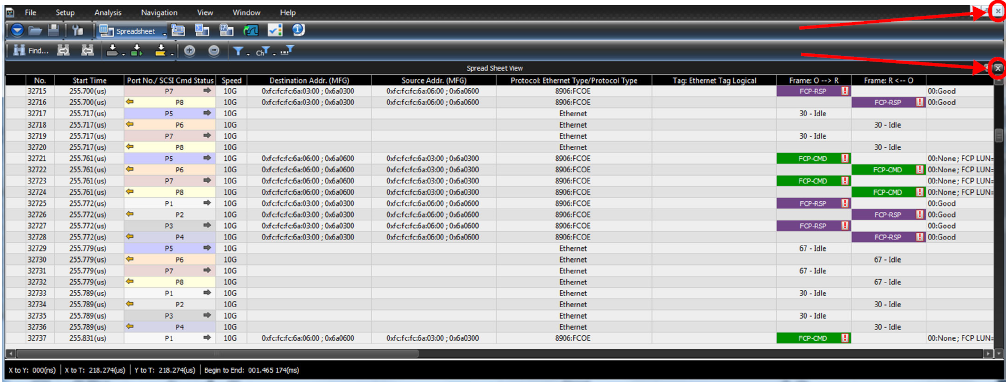
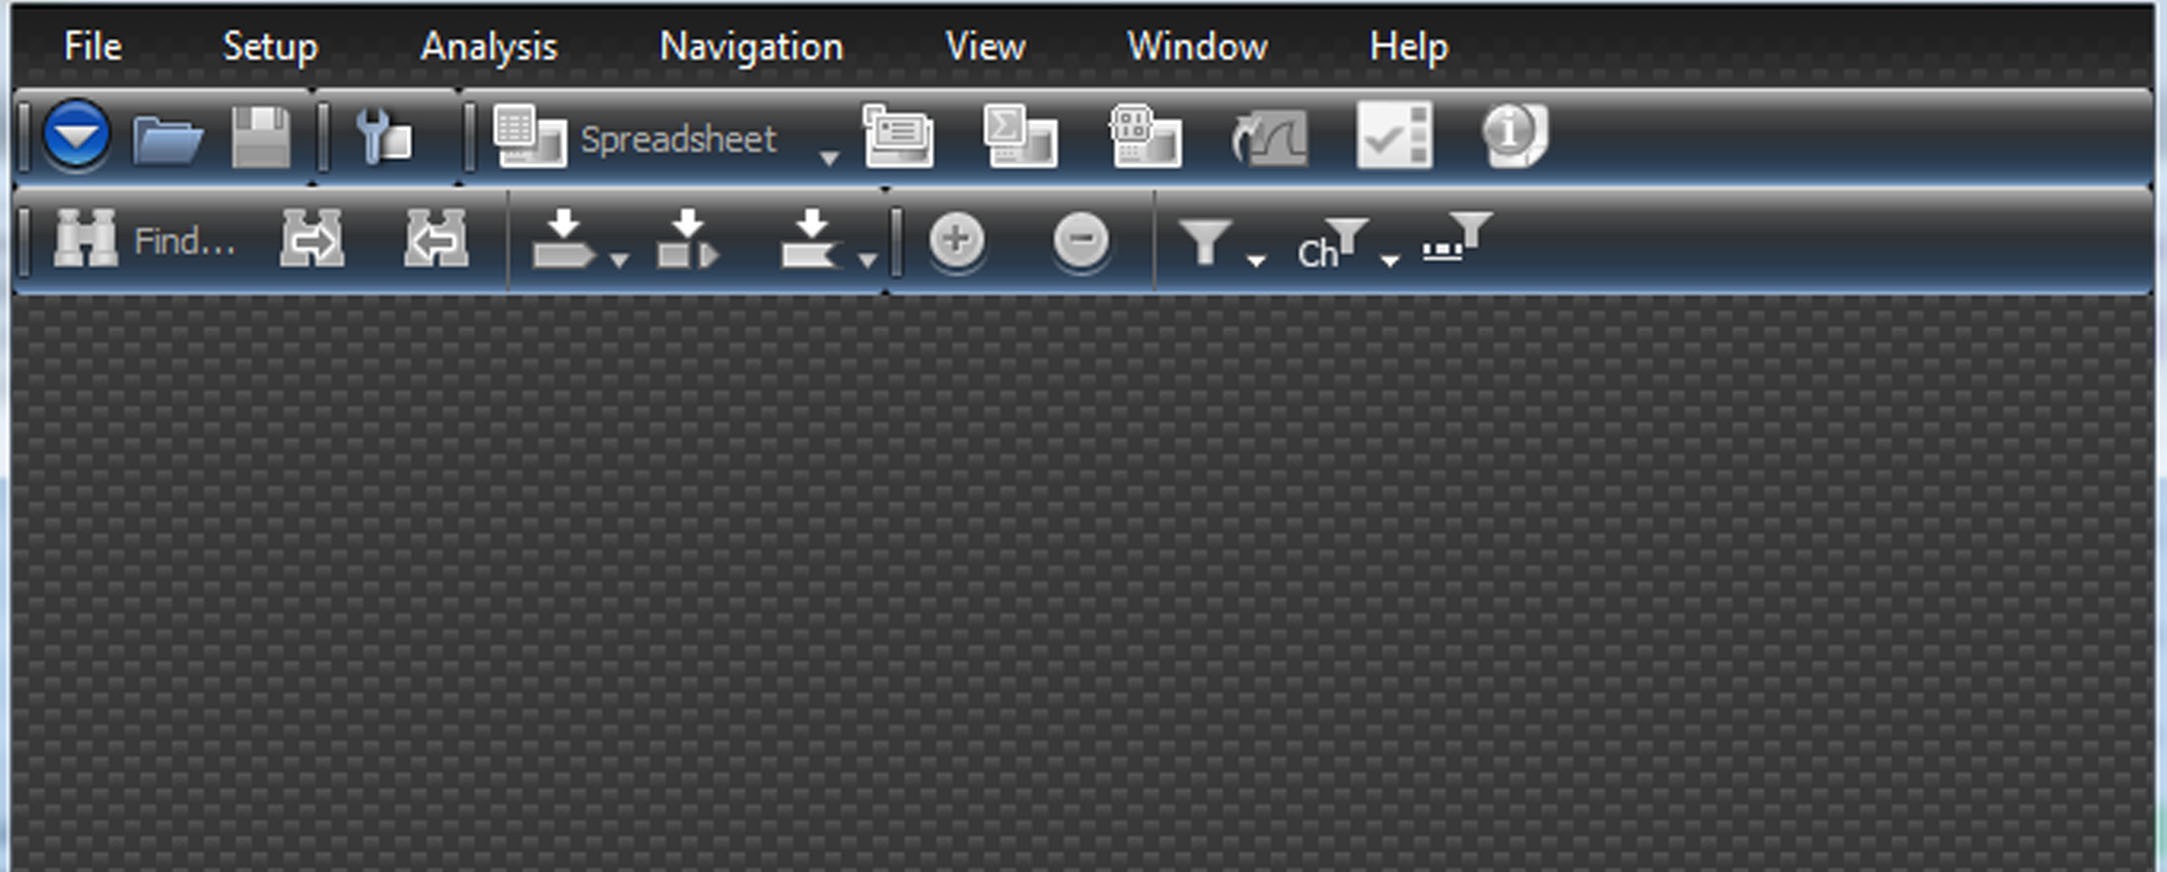
This leaves only the Net Suite Protocol tool running.
Save a Set of Column Settings
-
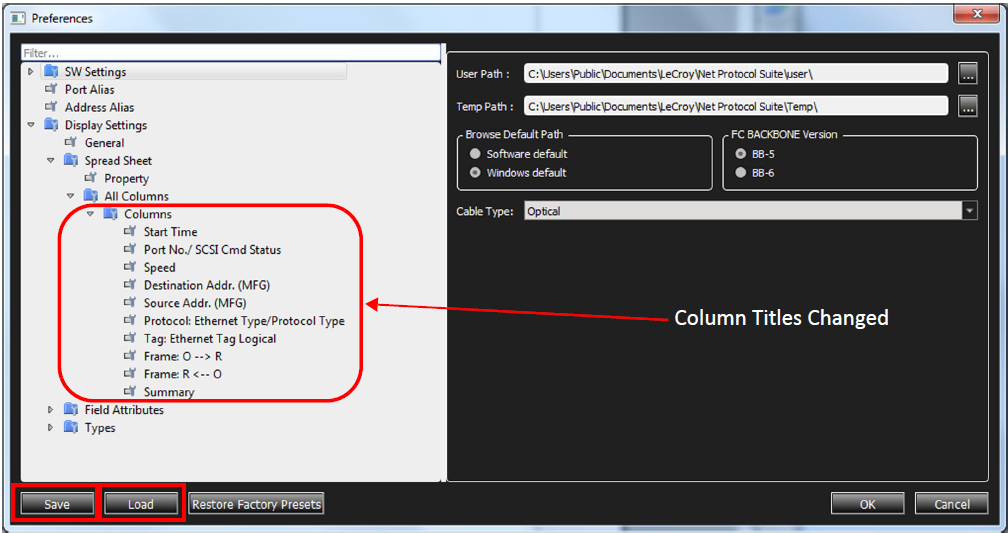
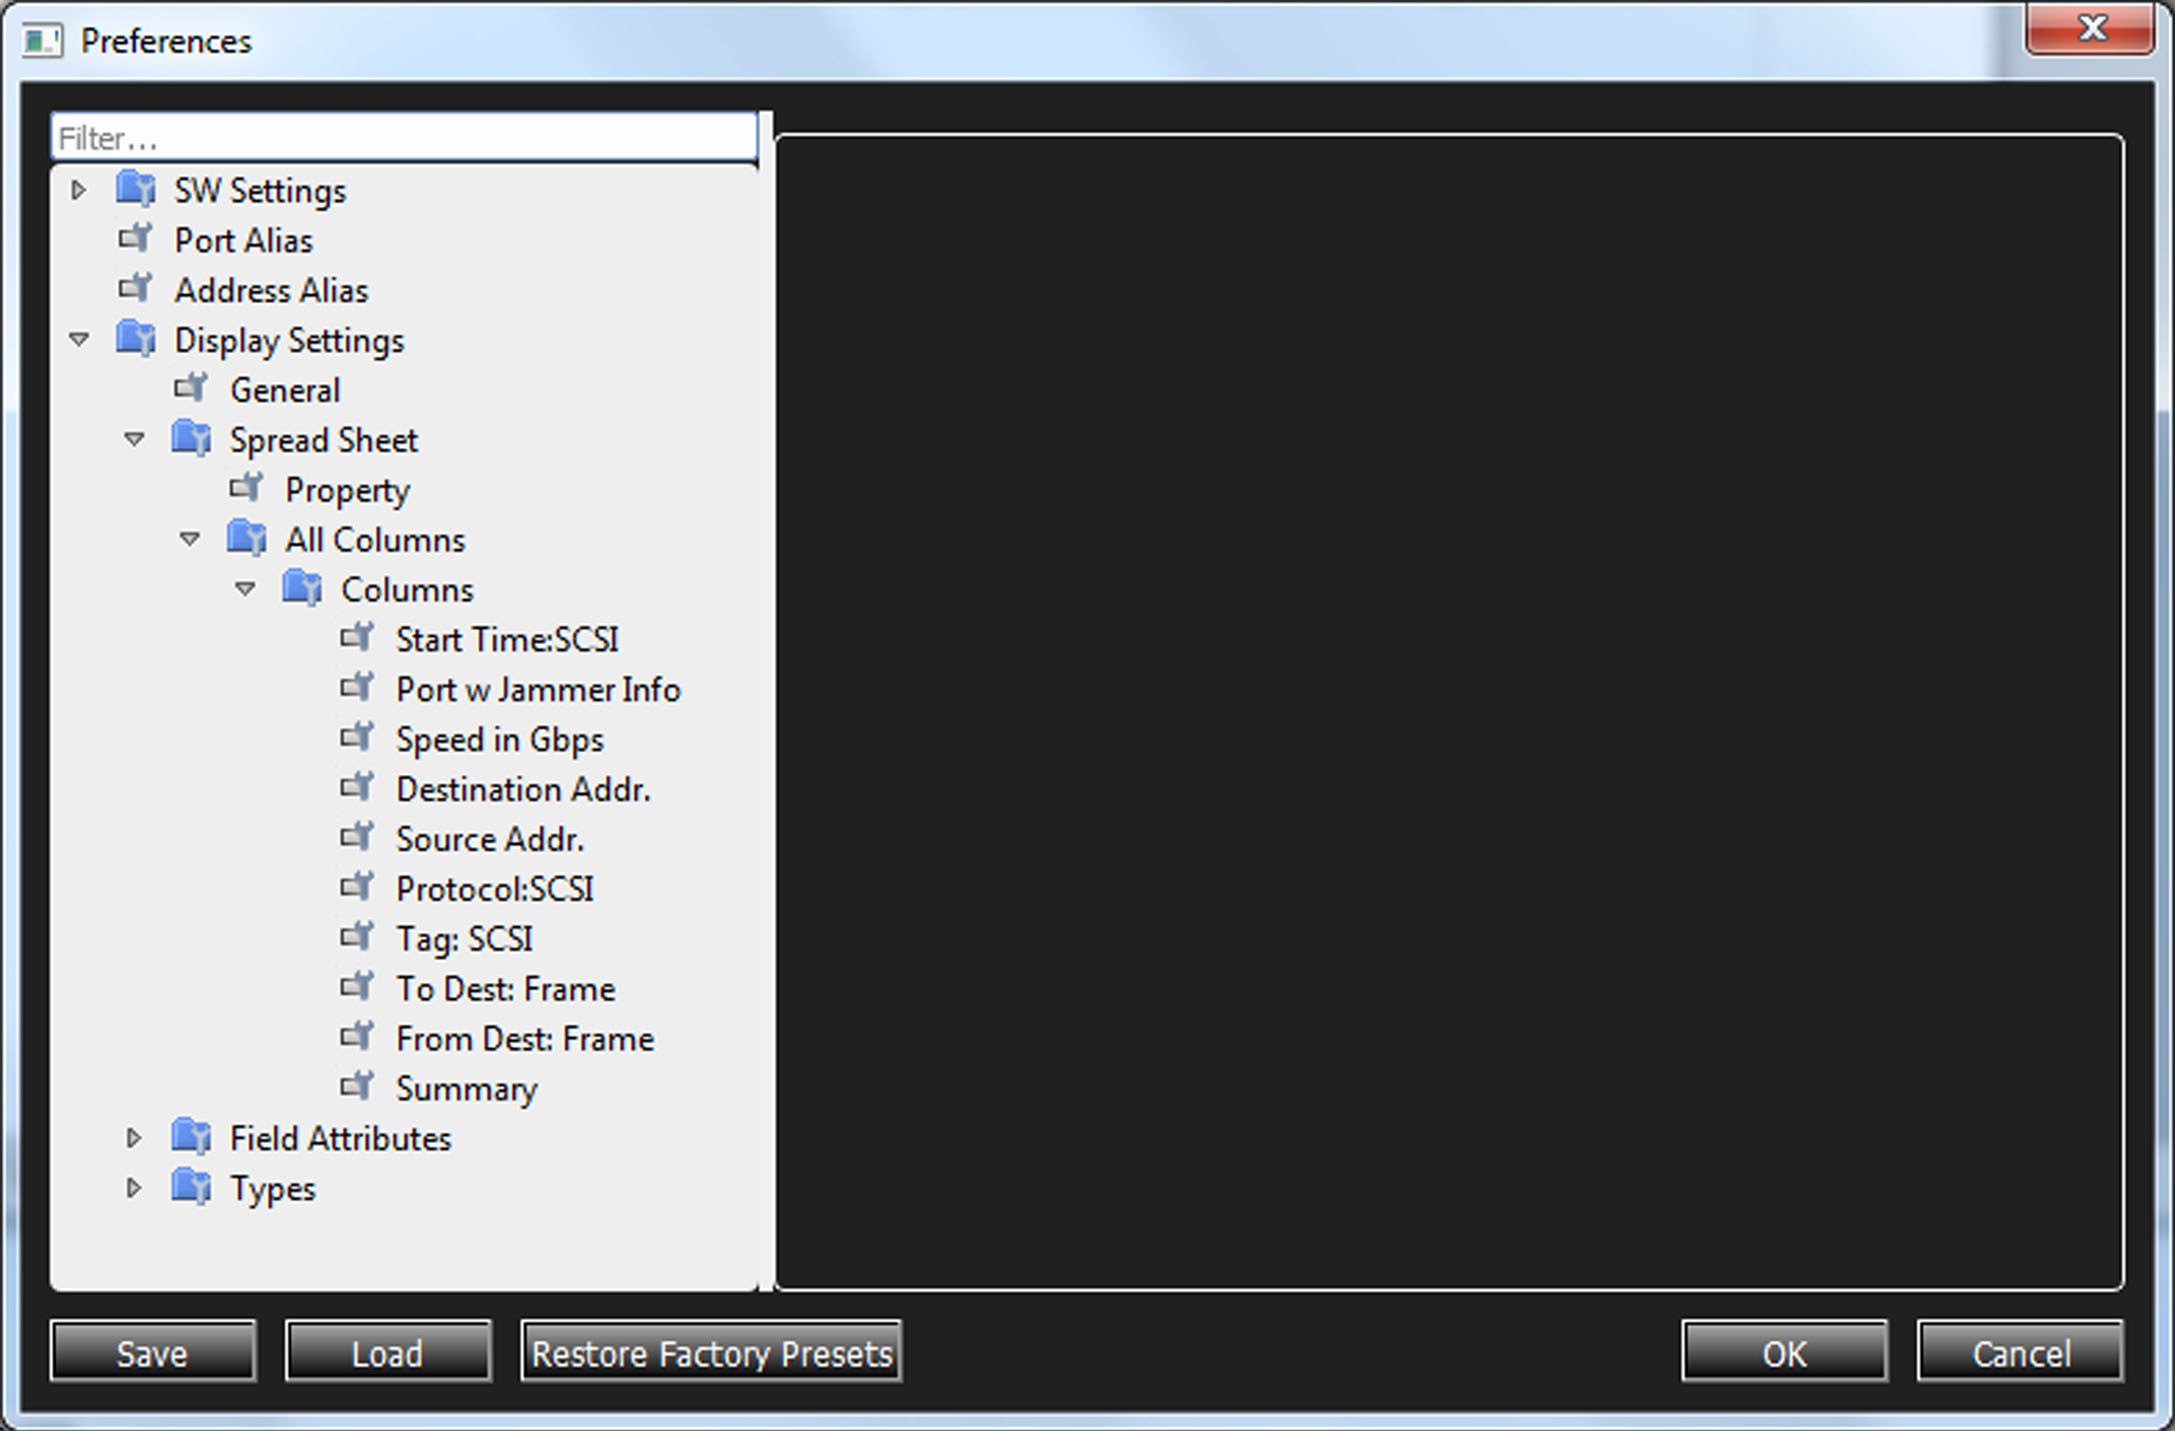
Select Preferences > Display Settings > All Columns > Columns.
The dialog window appears containing the Save and Load buttons. Use these buttons to save a set of column changes or load a previously saved set of Column changes.
-
To store the set of Column settings, select Save.
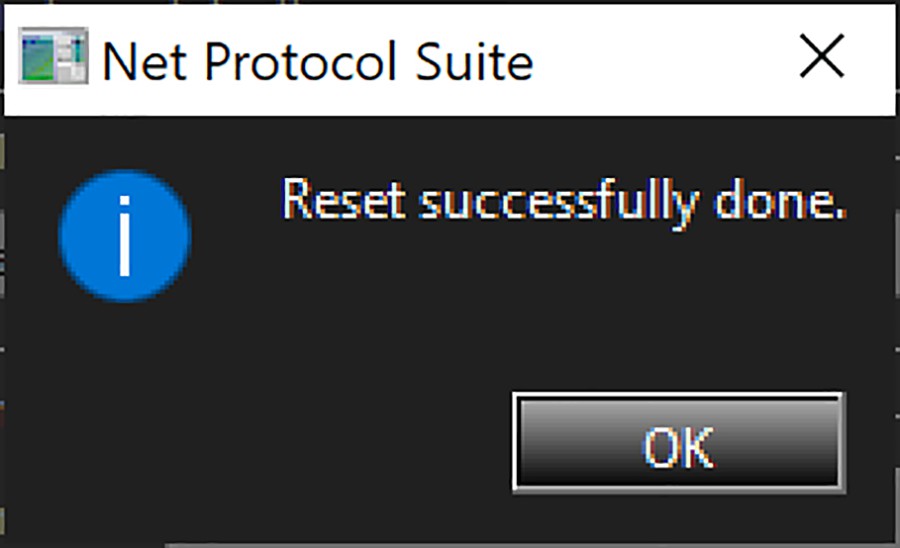
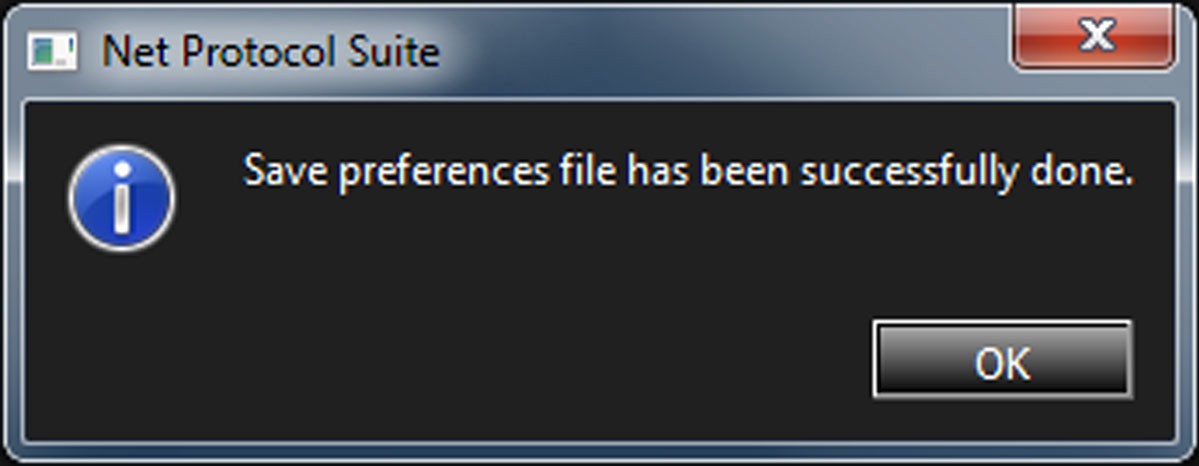
The following dialog box pops up to verify that the Column Settings have been Saved.
Load a Set of Column Settings
-
Launch the Net Protocol Suite.
-
Select Preferences > Display Settings > All Columns > Columns. A dialog box appears with Save and Load buttons.
-
Use the Save and Load buttons to Load a previously Saved set of Column changes.
-
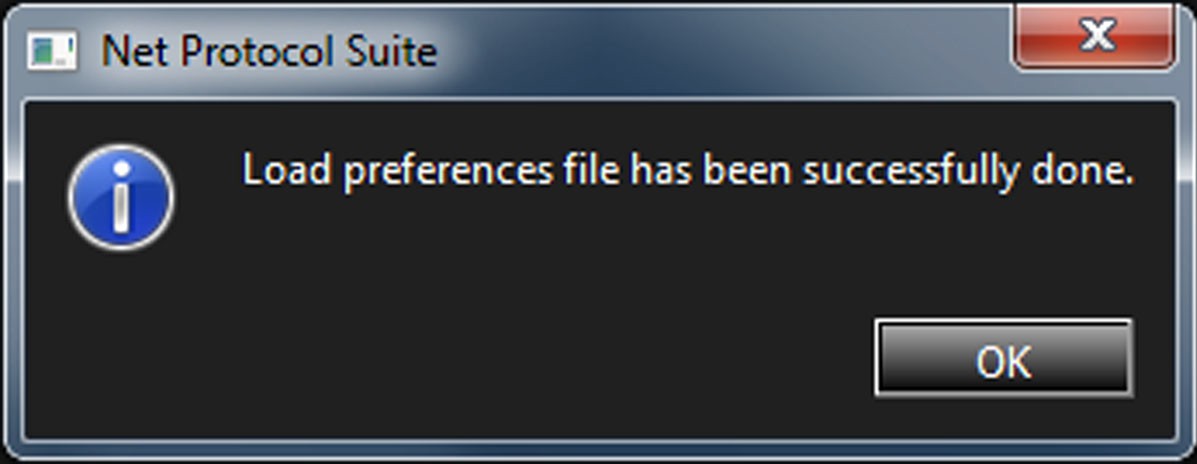
When the set of columns settings is successfully loaded, the following window opens.
-
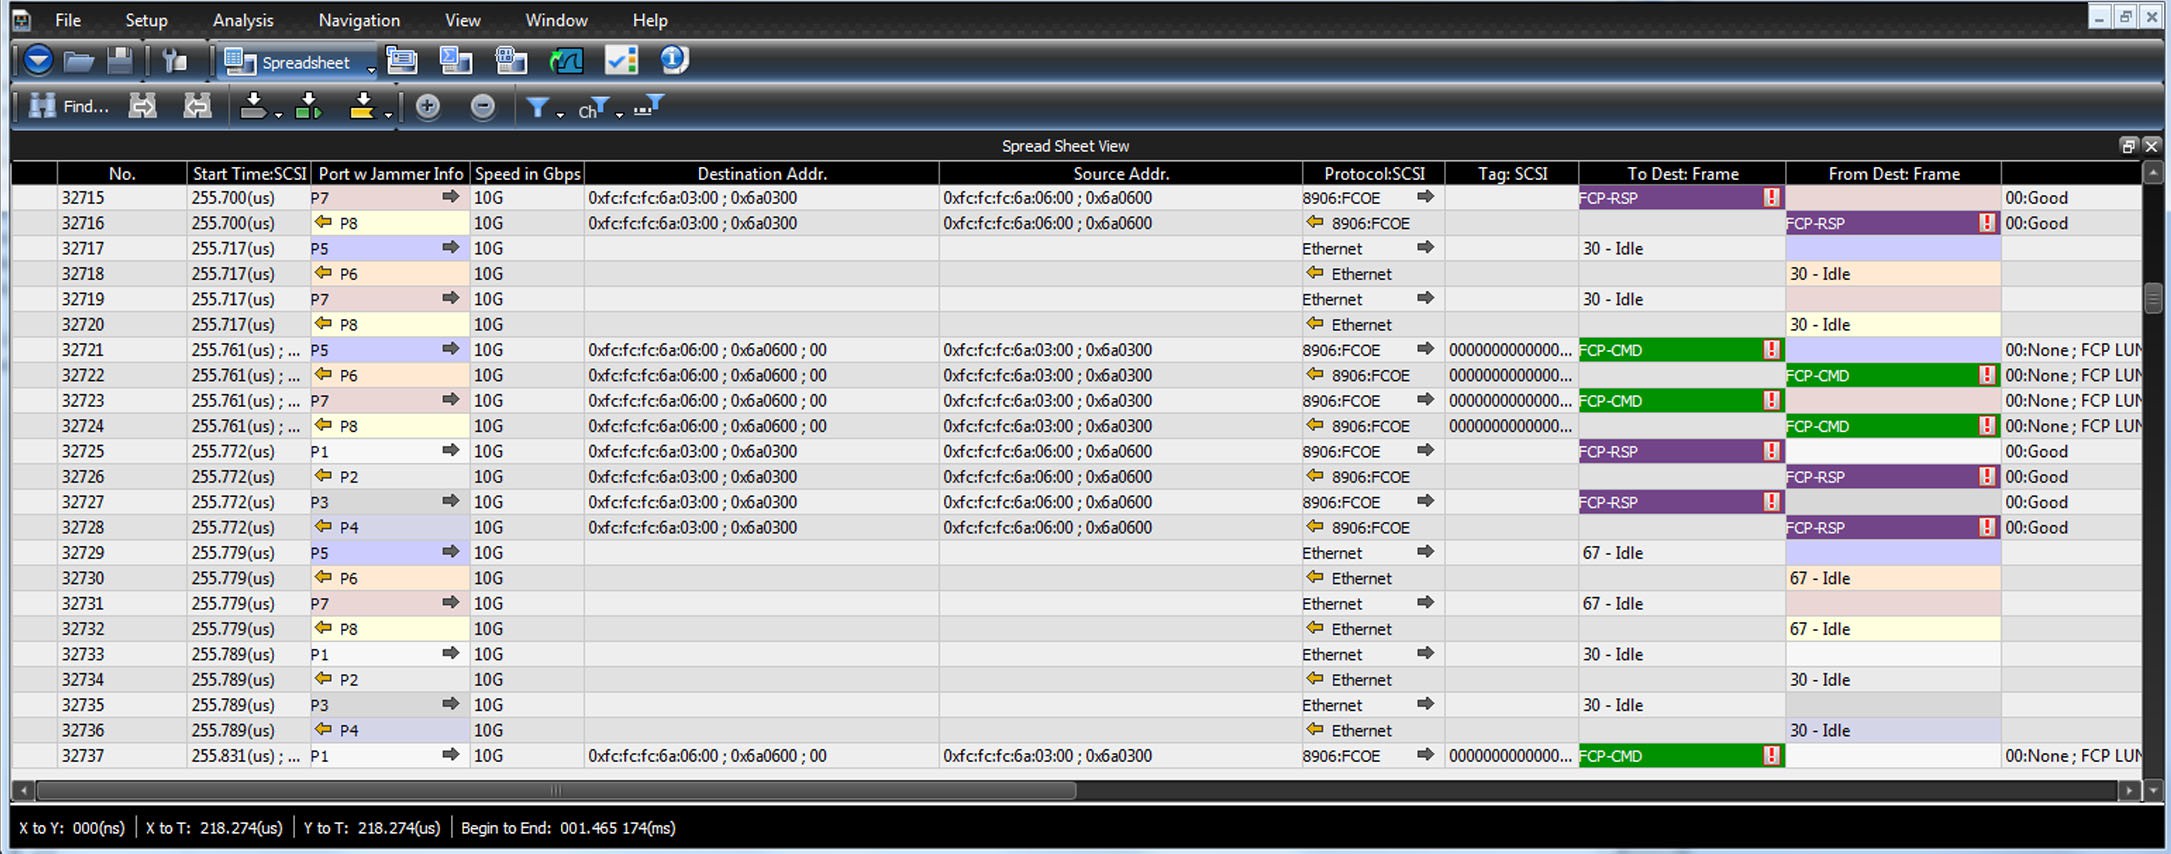
When you load a Trace, the set of Columns settings you selected is displayed.
-
When you load a Trace, a new set of columns is displayed.
Display Settings – Field Attributes
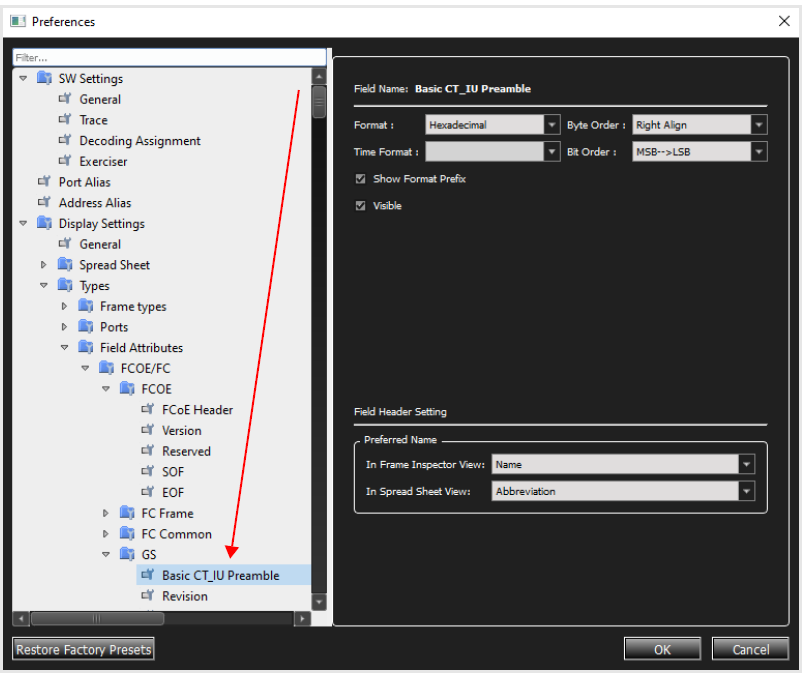
In Field Attributes you can click a Trigger Pattern and choose the following:
-
Format
-
Hexidecimal
-
Decimal
-
Binary
-
ASCII
-
IP
-
Reverse DWORD
-
MAC
-
OUI
-
-
Byte Order
-
Right Align
-
Left Align
-
-
Time Format
-
TBD
-
[Zulu]
-
-
Bit Order
-
LSB-->MSB
-
MSB-->LSB
-
-
Field Header Setting (Preferred Name)
-
In Frame Inspector View
-
In Spreadsheet View
-
Field Setting, Color Setting, and Field Header Setting options from the drop-down lists. See the figure below.
Display Settings – Types
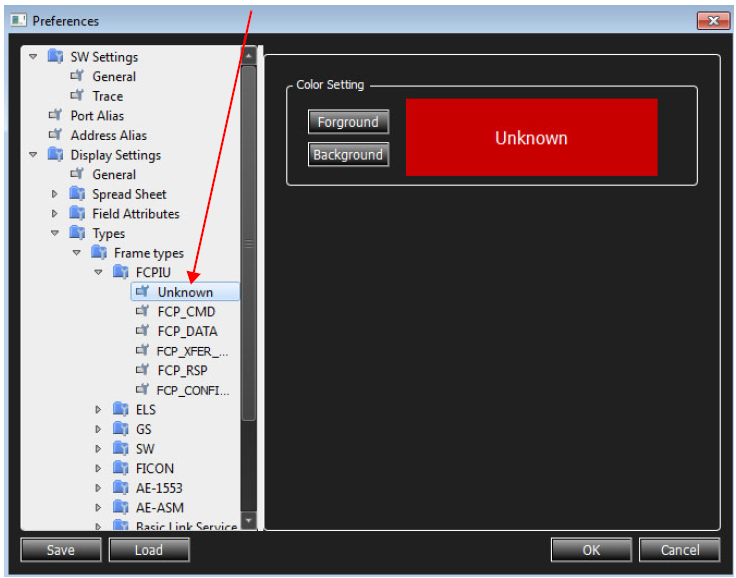
In Frame types you can select the foreground and background Color Setting by clicking on the relevant button.
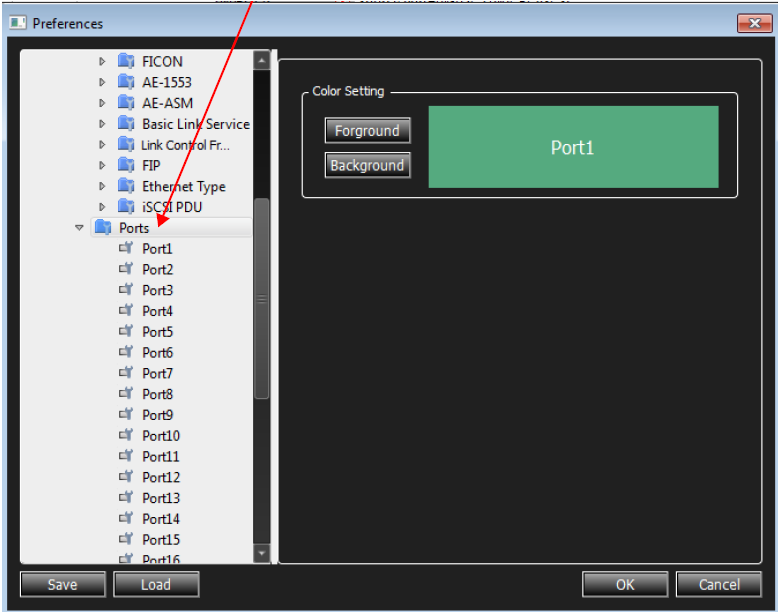
In Ports you can select the foreground and background Color Setting by clicking on the relevant button.
Show/Hide Format Prefix
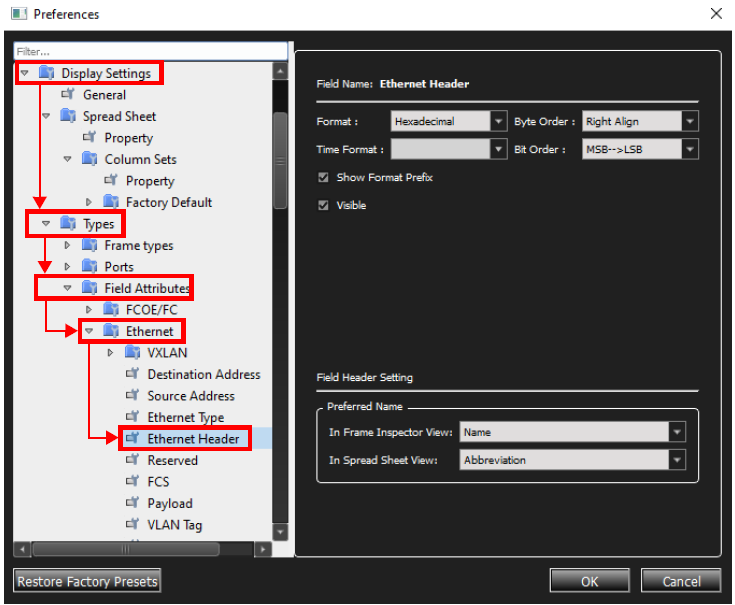
In the Spreadsheet View, you can Show or Hide Format Prefixes such as Hexadecimal, Decimal, Binary, ASCII or IP. The following provide and example for using this feature.
-
From Spreadsheet View, click the preferences icon


-
If needed, expand the filter. For example, Display Settings > Types > Field Attributes > Ethernet.
-
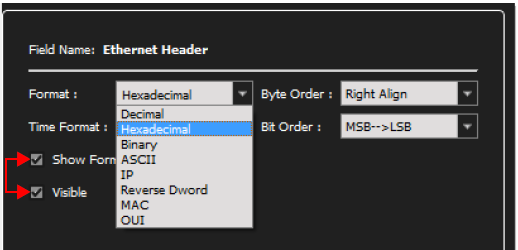
Select Ethernet Header, then select the desired Format (e.g., Hexadecimal) from the Format drop-down list.
-
To display this format, select the checkboxes for Show Format and Visible.
-
For Show Hexadecimal Format Prefix, “0x” is pre-pended to the data.
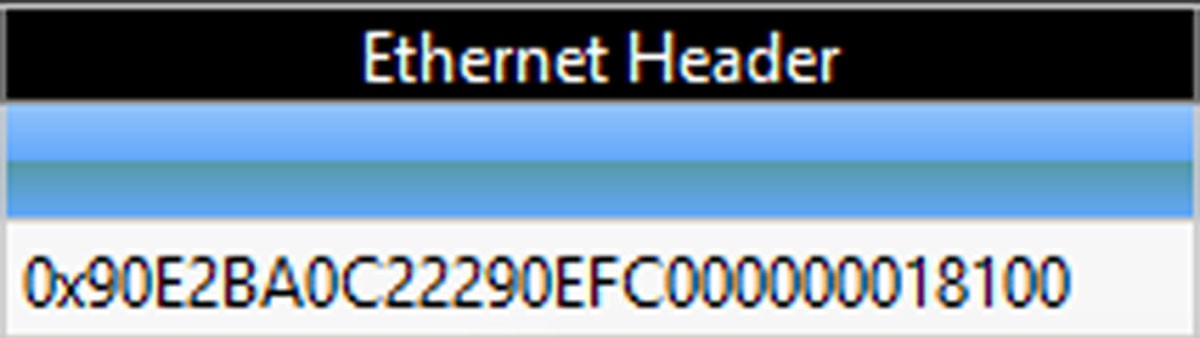
Show Hexadecimal Prefix -
If you clear the Show Format Prefix box, the Hexadecimal Format Prefix will be removed.
-
When you are satisfied with your settings, click OK.
-
Note: This functionality applies to every column with appropriate data.
Launch CrossSync Control Panel
Click on Launch CrossSync Control Panel to bring up the CrossSync Control Panel allows you to select analyzers for synchronization and manage the recording process. It supports a wide combination of Teledyne LeCroy’s flagship analyzers including PCI Express, USB, DDR, Serial ATA (SATA), Serial Attached SCSI (SAS), Fibre Channel (FC) and Ethernet.
CrossSync is Teledyne LeCroy’s analyzer synchronization solution that enables time-aligned display of protocol traffic from multiple daisy-chained analyzers showing event traffic from multiple high-speed serial buses. A lightweight software control panel allows users to select analyzers for synchronization and manage the recording process. Captured traffic is displayed using the latest analyzer software (in separate windows) with all the protocol specific search and reporting features.
Captured events are displayed in separate windows that share a common time scale. Navigating the traffic in either direction will scroll to the same timestamp in a synchronized window. When using the CrossSync option, users can access the full complement of analysis capabilities available within the individual Teledyne LeCroy software. Search, reporting, and decoding all operate normally.
This feature is available with the Teledyne LeCroy Net Protocol Suite software application. Refer to the CrossSync Control Panel User Manual for more information.