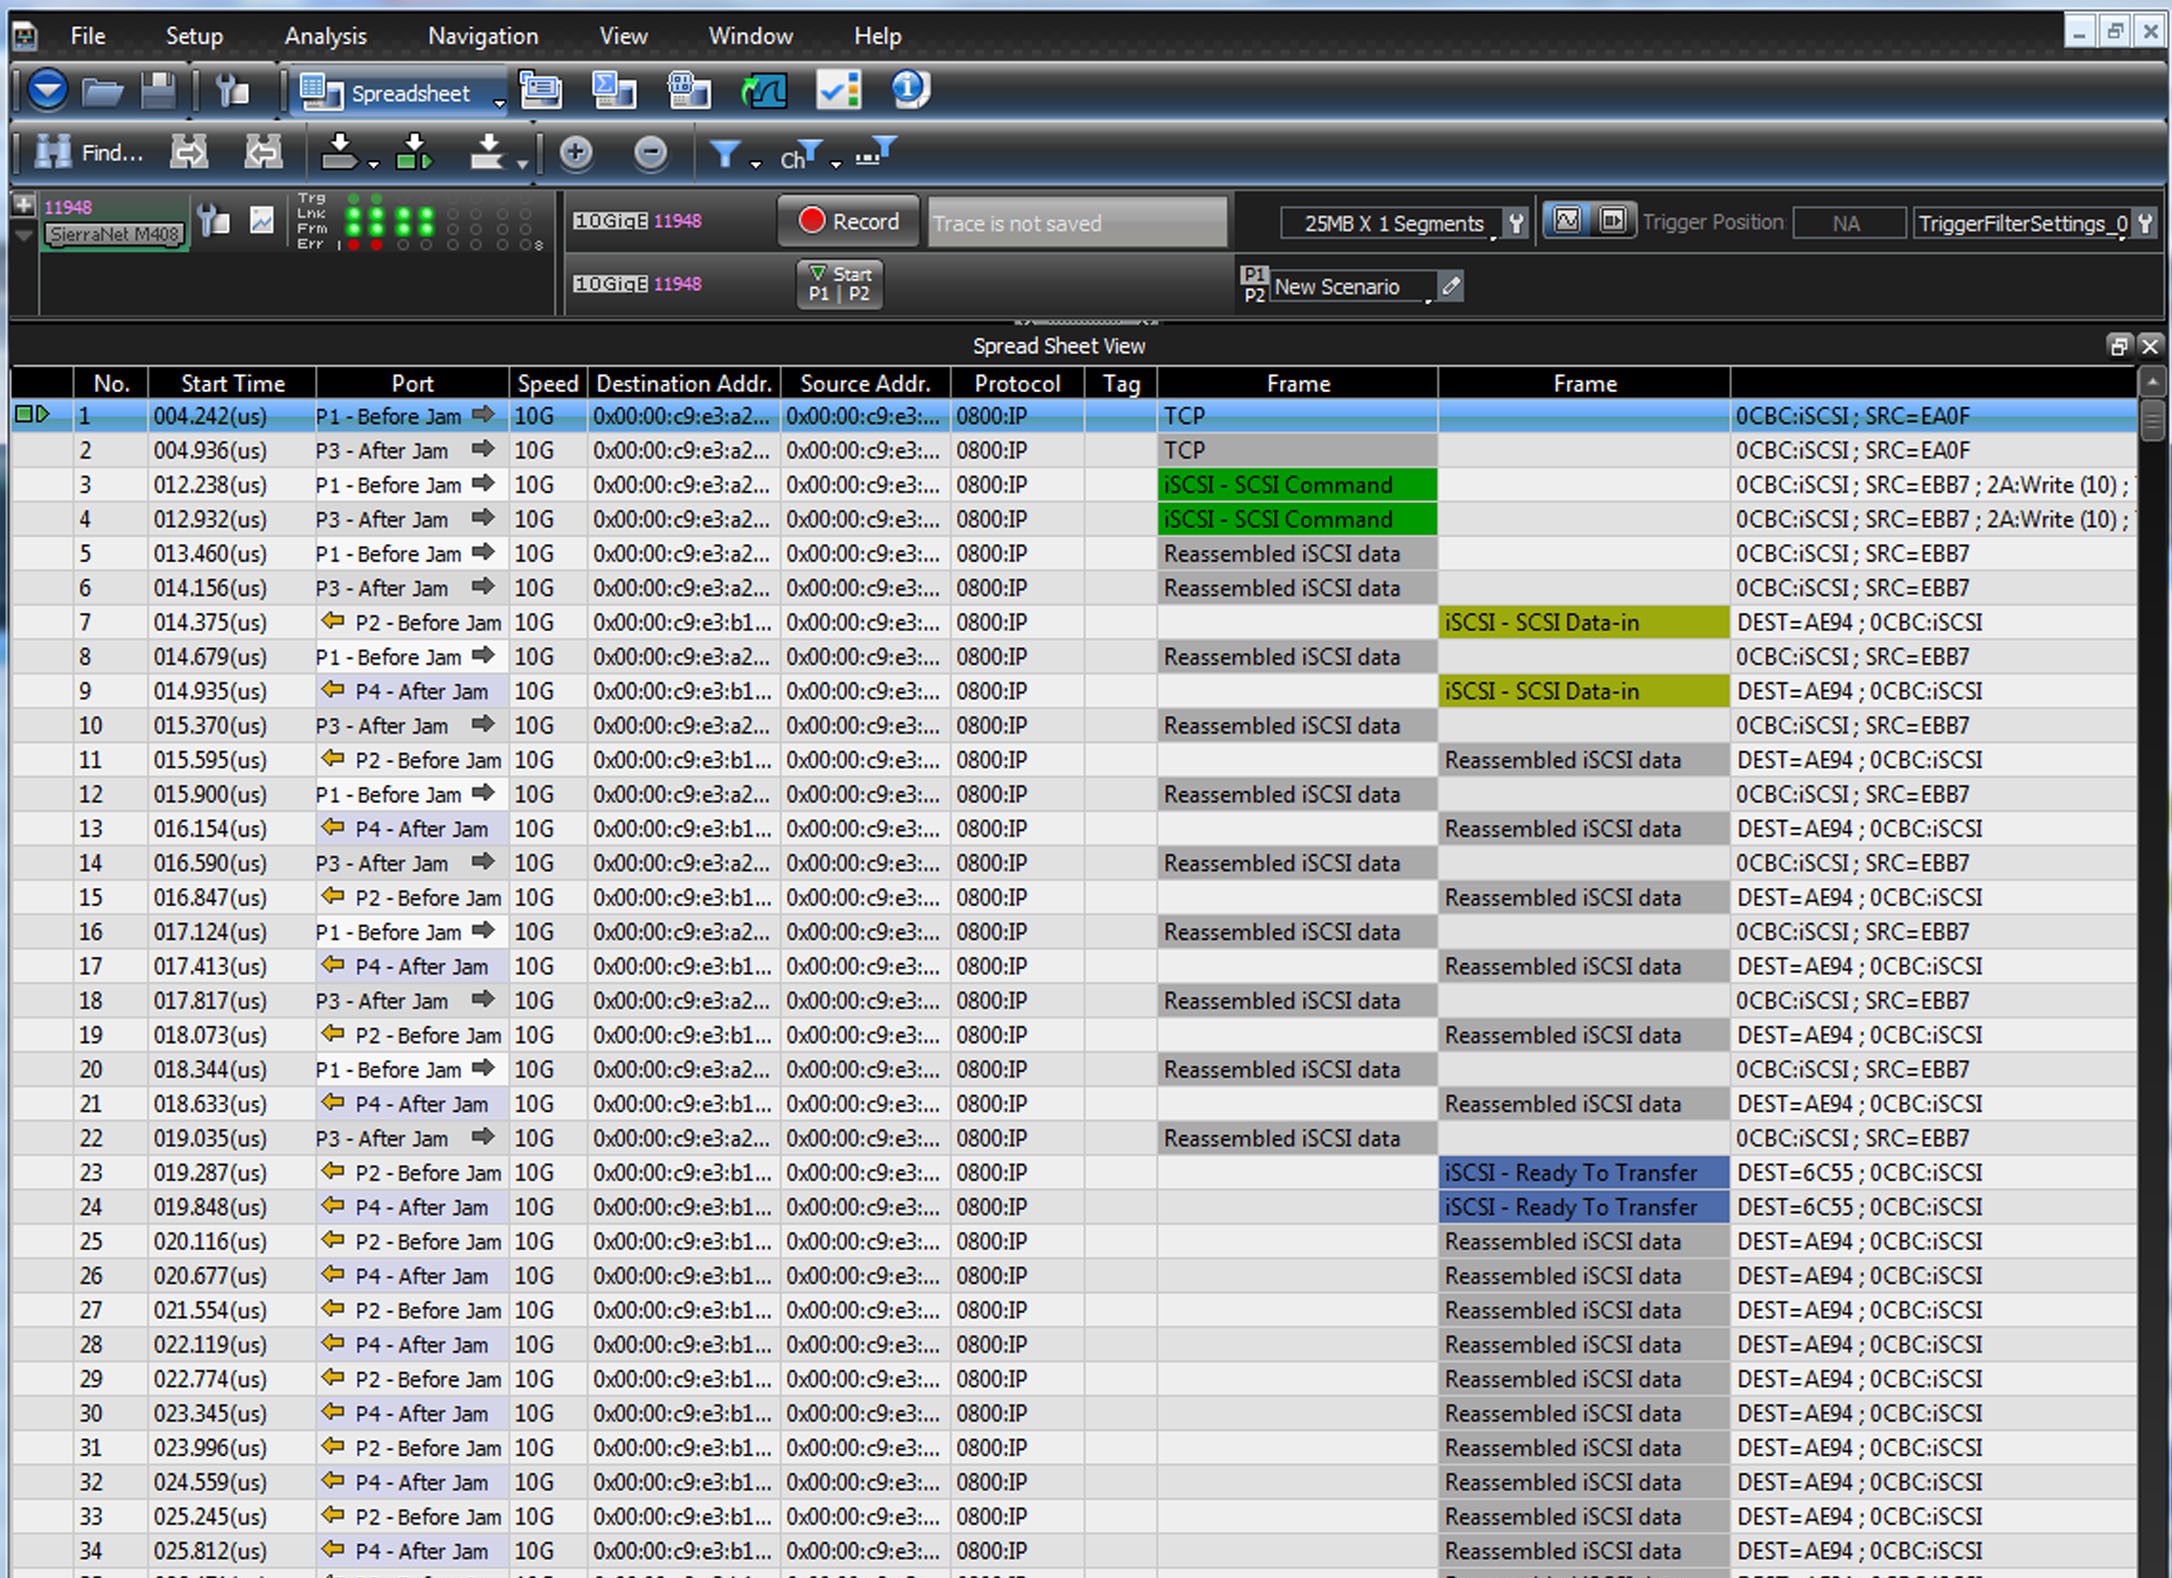
A typical trace shown in Spreadsheet view displays captured events sequentially, one event per line. In the example below, you can see that in the first 34 events there are commands and data going back and forth from Ports 1 and 3 combined with commands and data on Ports 2 and 4.
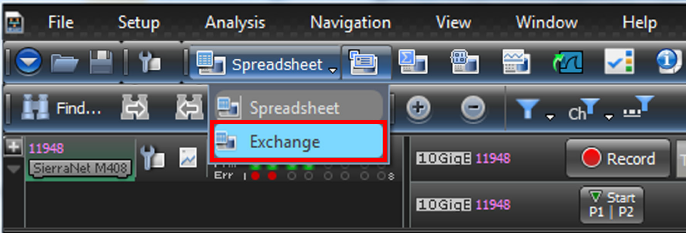
NOTE: Exchange View only works when both sides of a link are captured on a single port pair.
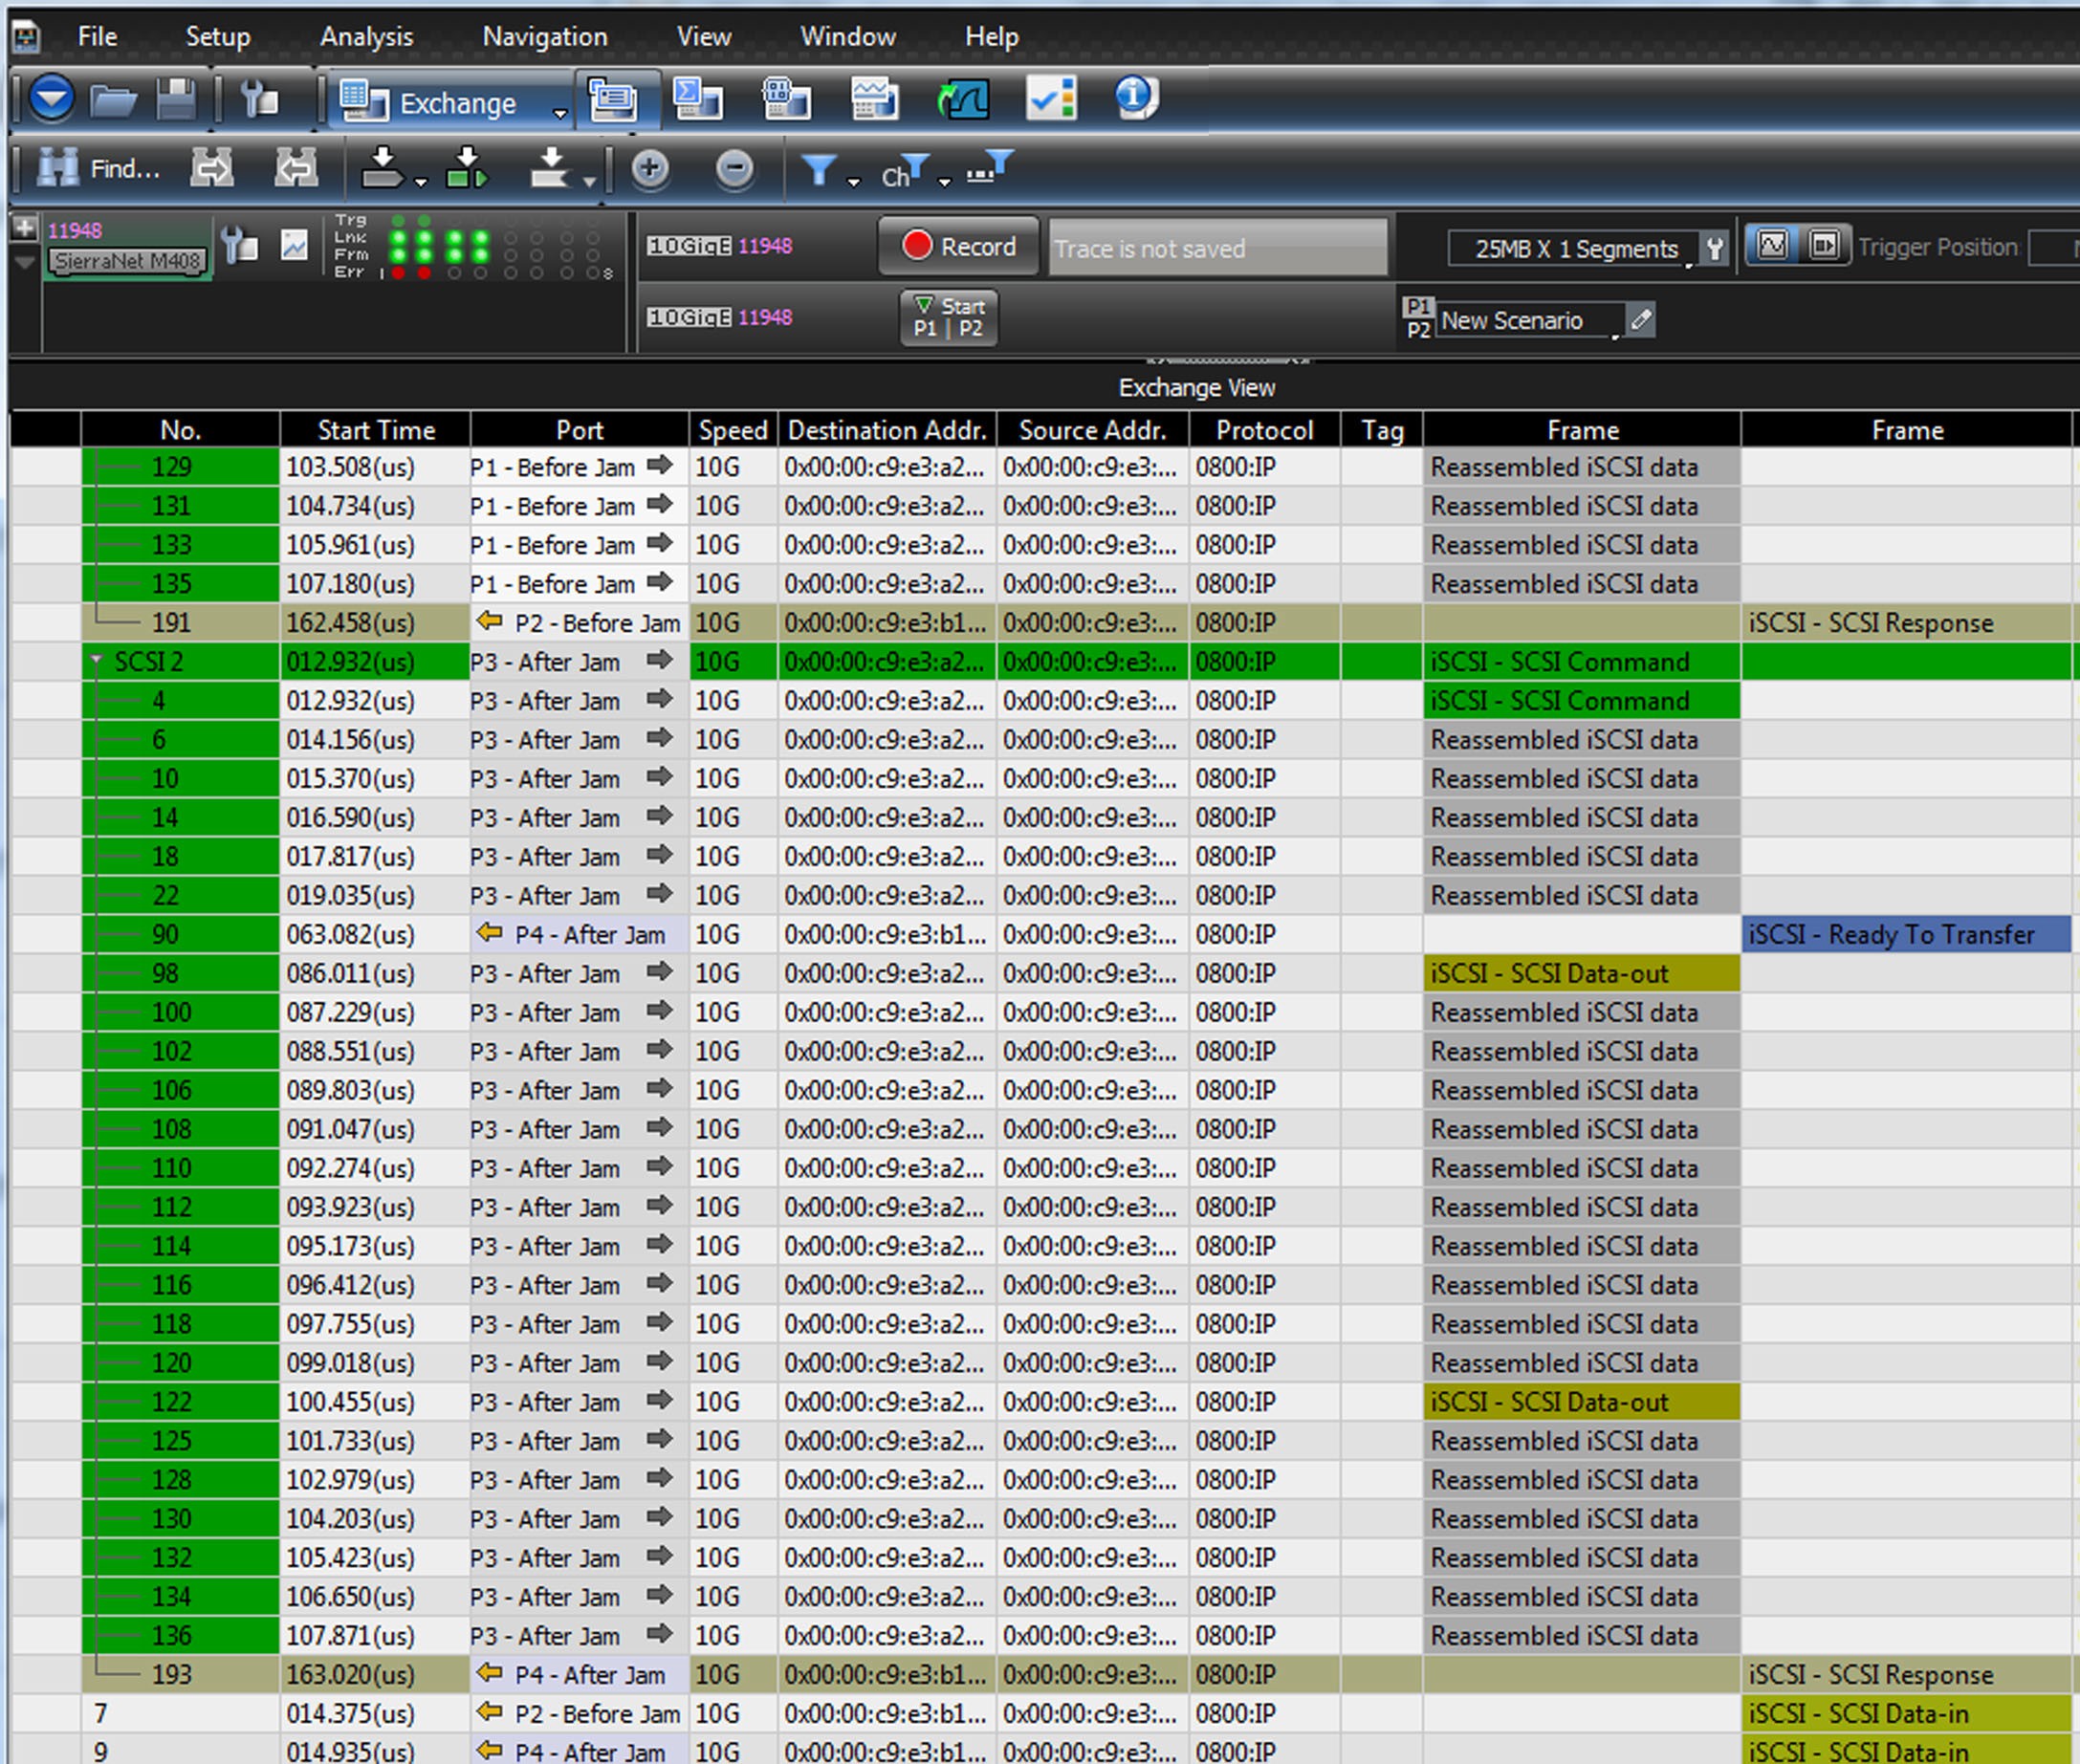
In Exchange View, events are arranged logically, so that all the events that are a part of SCSI command #1 are grouped together and all the events that are part of SCSI command #2 are grouped together, hierarchically rather than sequentially.
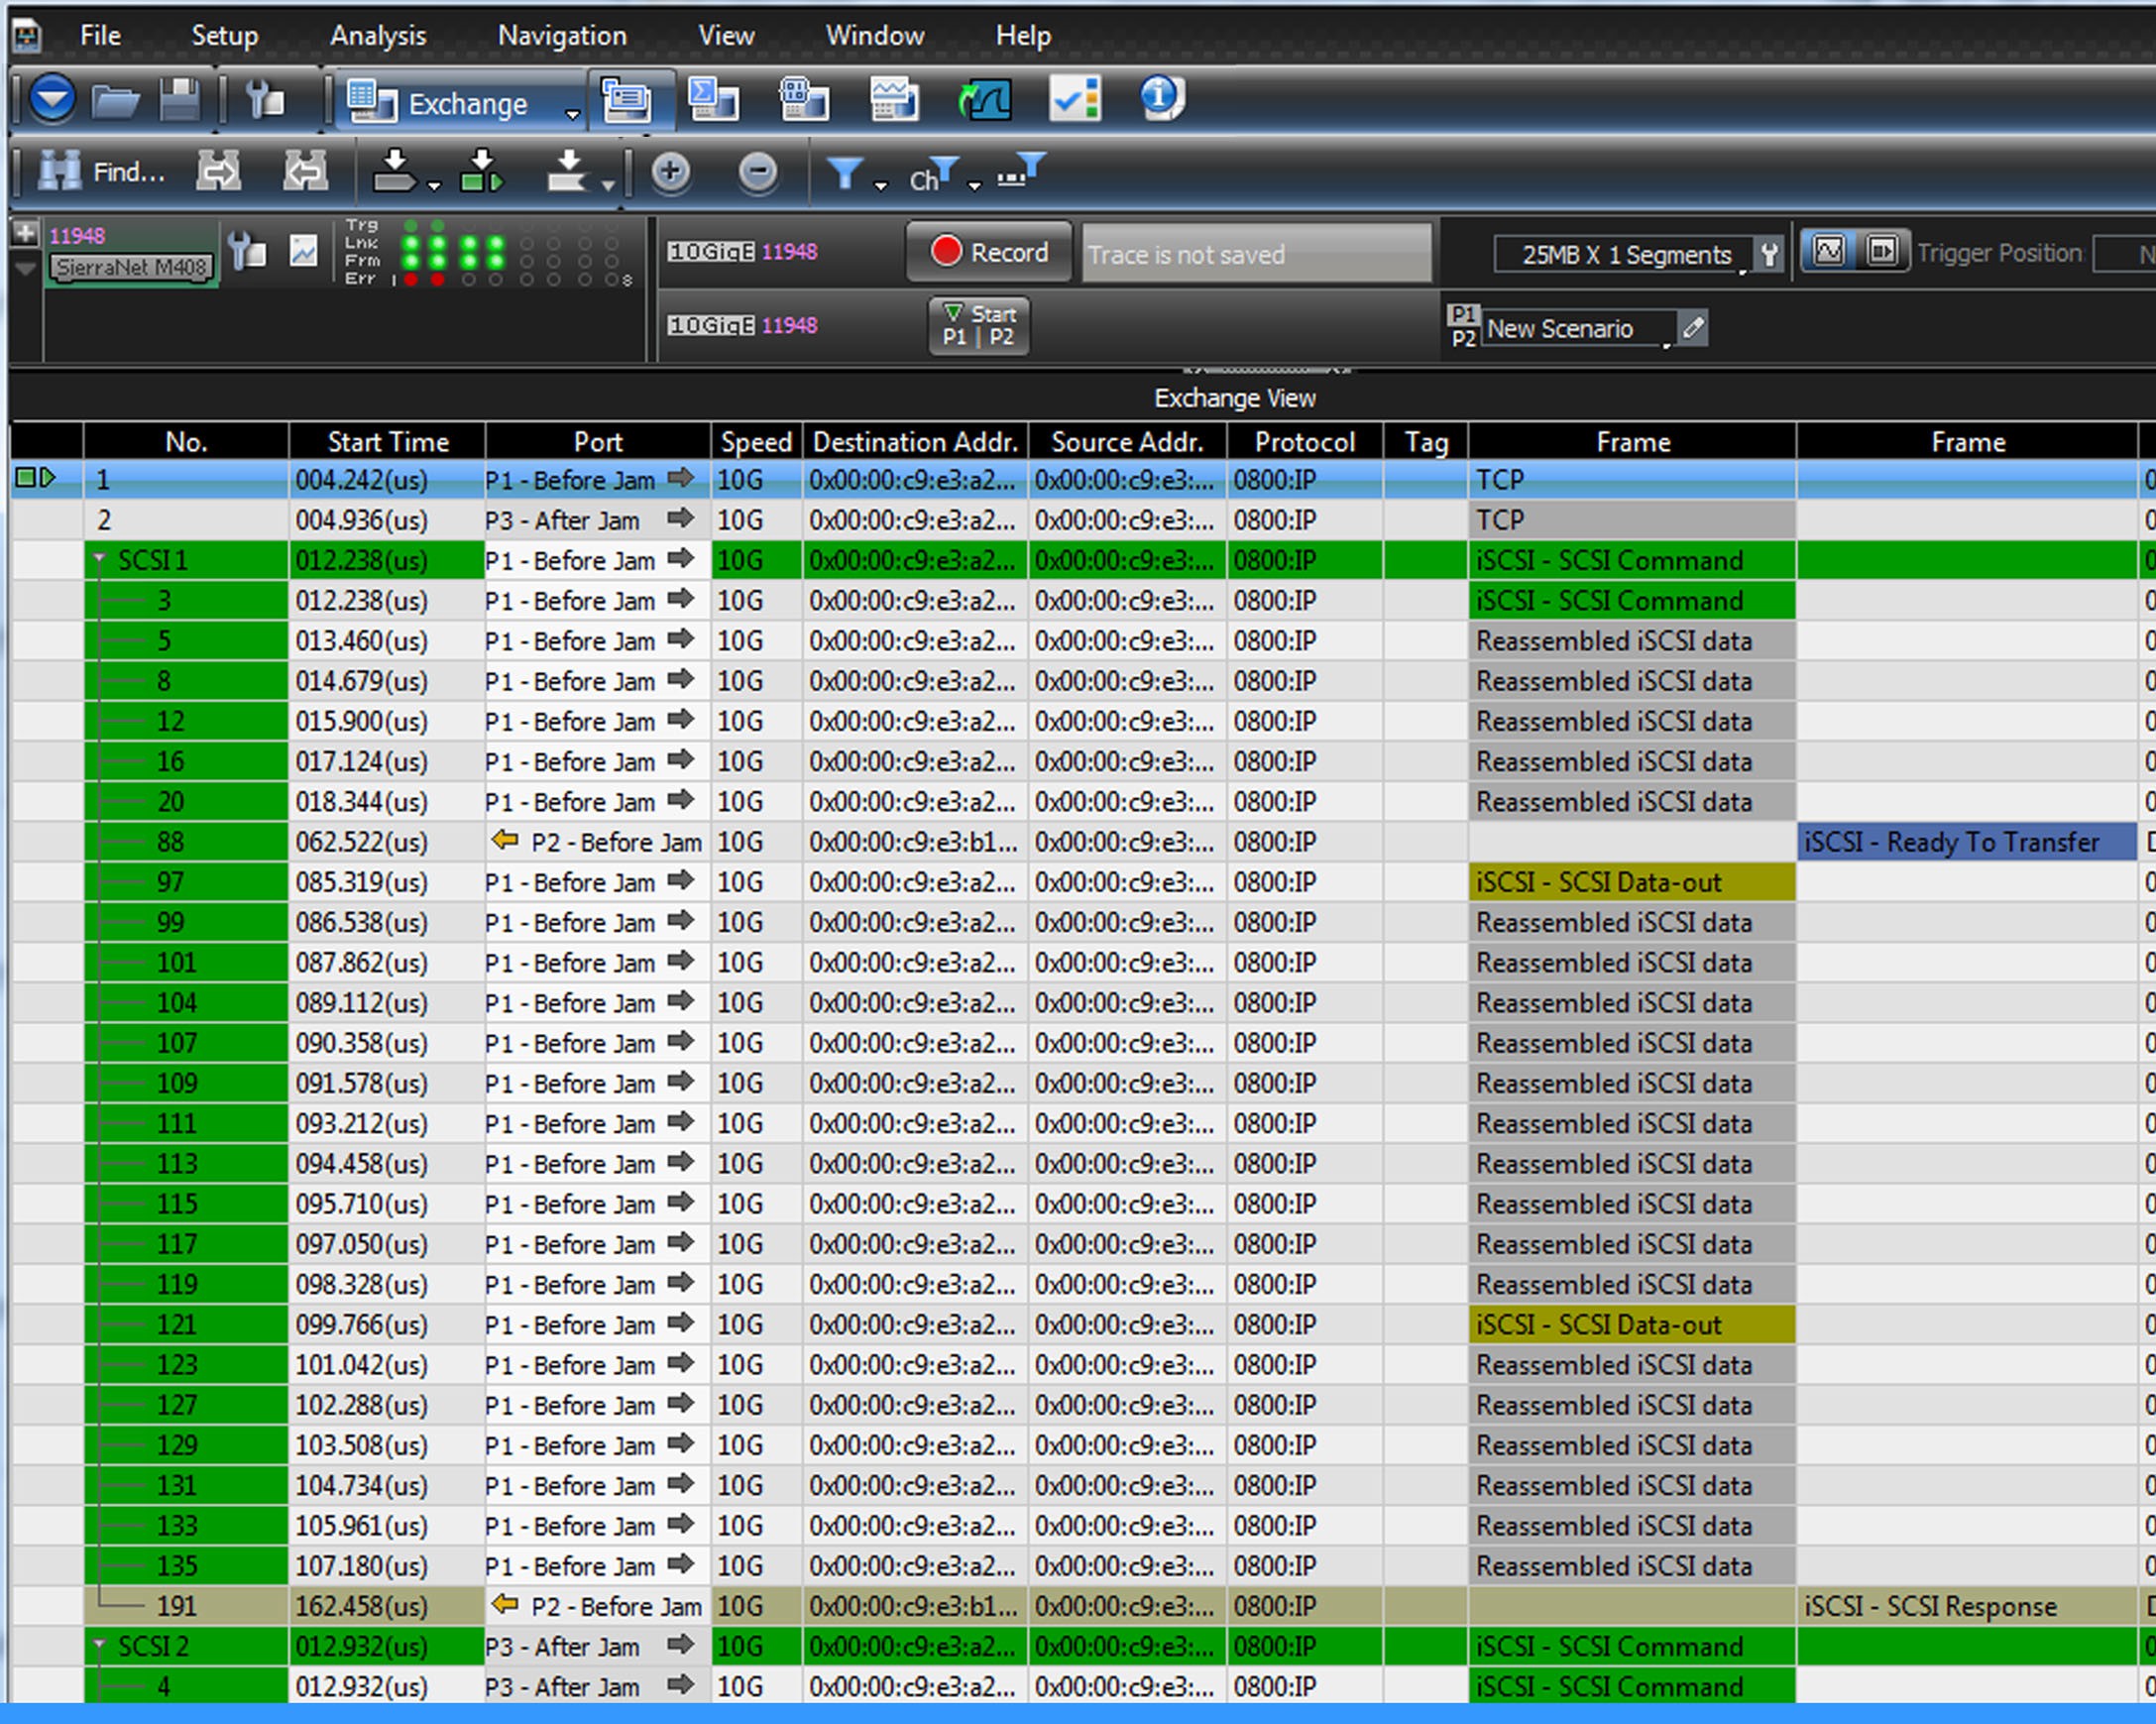
The first SCSI Command that starts with event 3, but the elements of that command are not sequential. As seen in the Frame column, data on the bus includes information from other SCSI commands. In the Exchange view, you can see that the first SCSI command has reassembled iSCSI data and iSCSI commands in events 3, 5, 8, 12, 16, 20, 88, 97, 99, 101, 104, 107, 109, 111, 113, 115, 117, 119, 121, 123, 127, 129, 131, 133, and 135 before a final SCSI Response is returned in event 191.
SCSI command 2 starts with event 4, but elements of that command are interspersed with commands and data from events 6, 10, 14, 18, 22, 90, 98, 100, 102, 106, 108, 110, 112, 114, 116, 118, 120, 122, 125, 128, 130, 132, 134, and 136 before a final SCSI Response is returned in event 193.
In this simple example, SCSI commands and data are interspersed with events from a variety of other commands, but in Exchange View you can see which events should be arranged logically to form a single transaction.
Exchange View offers you a powerful debugging capability.
NVMe Transactions
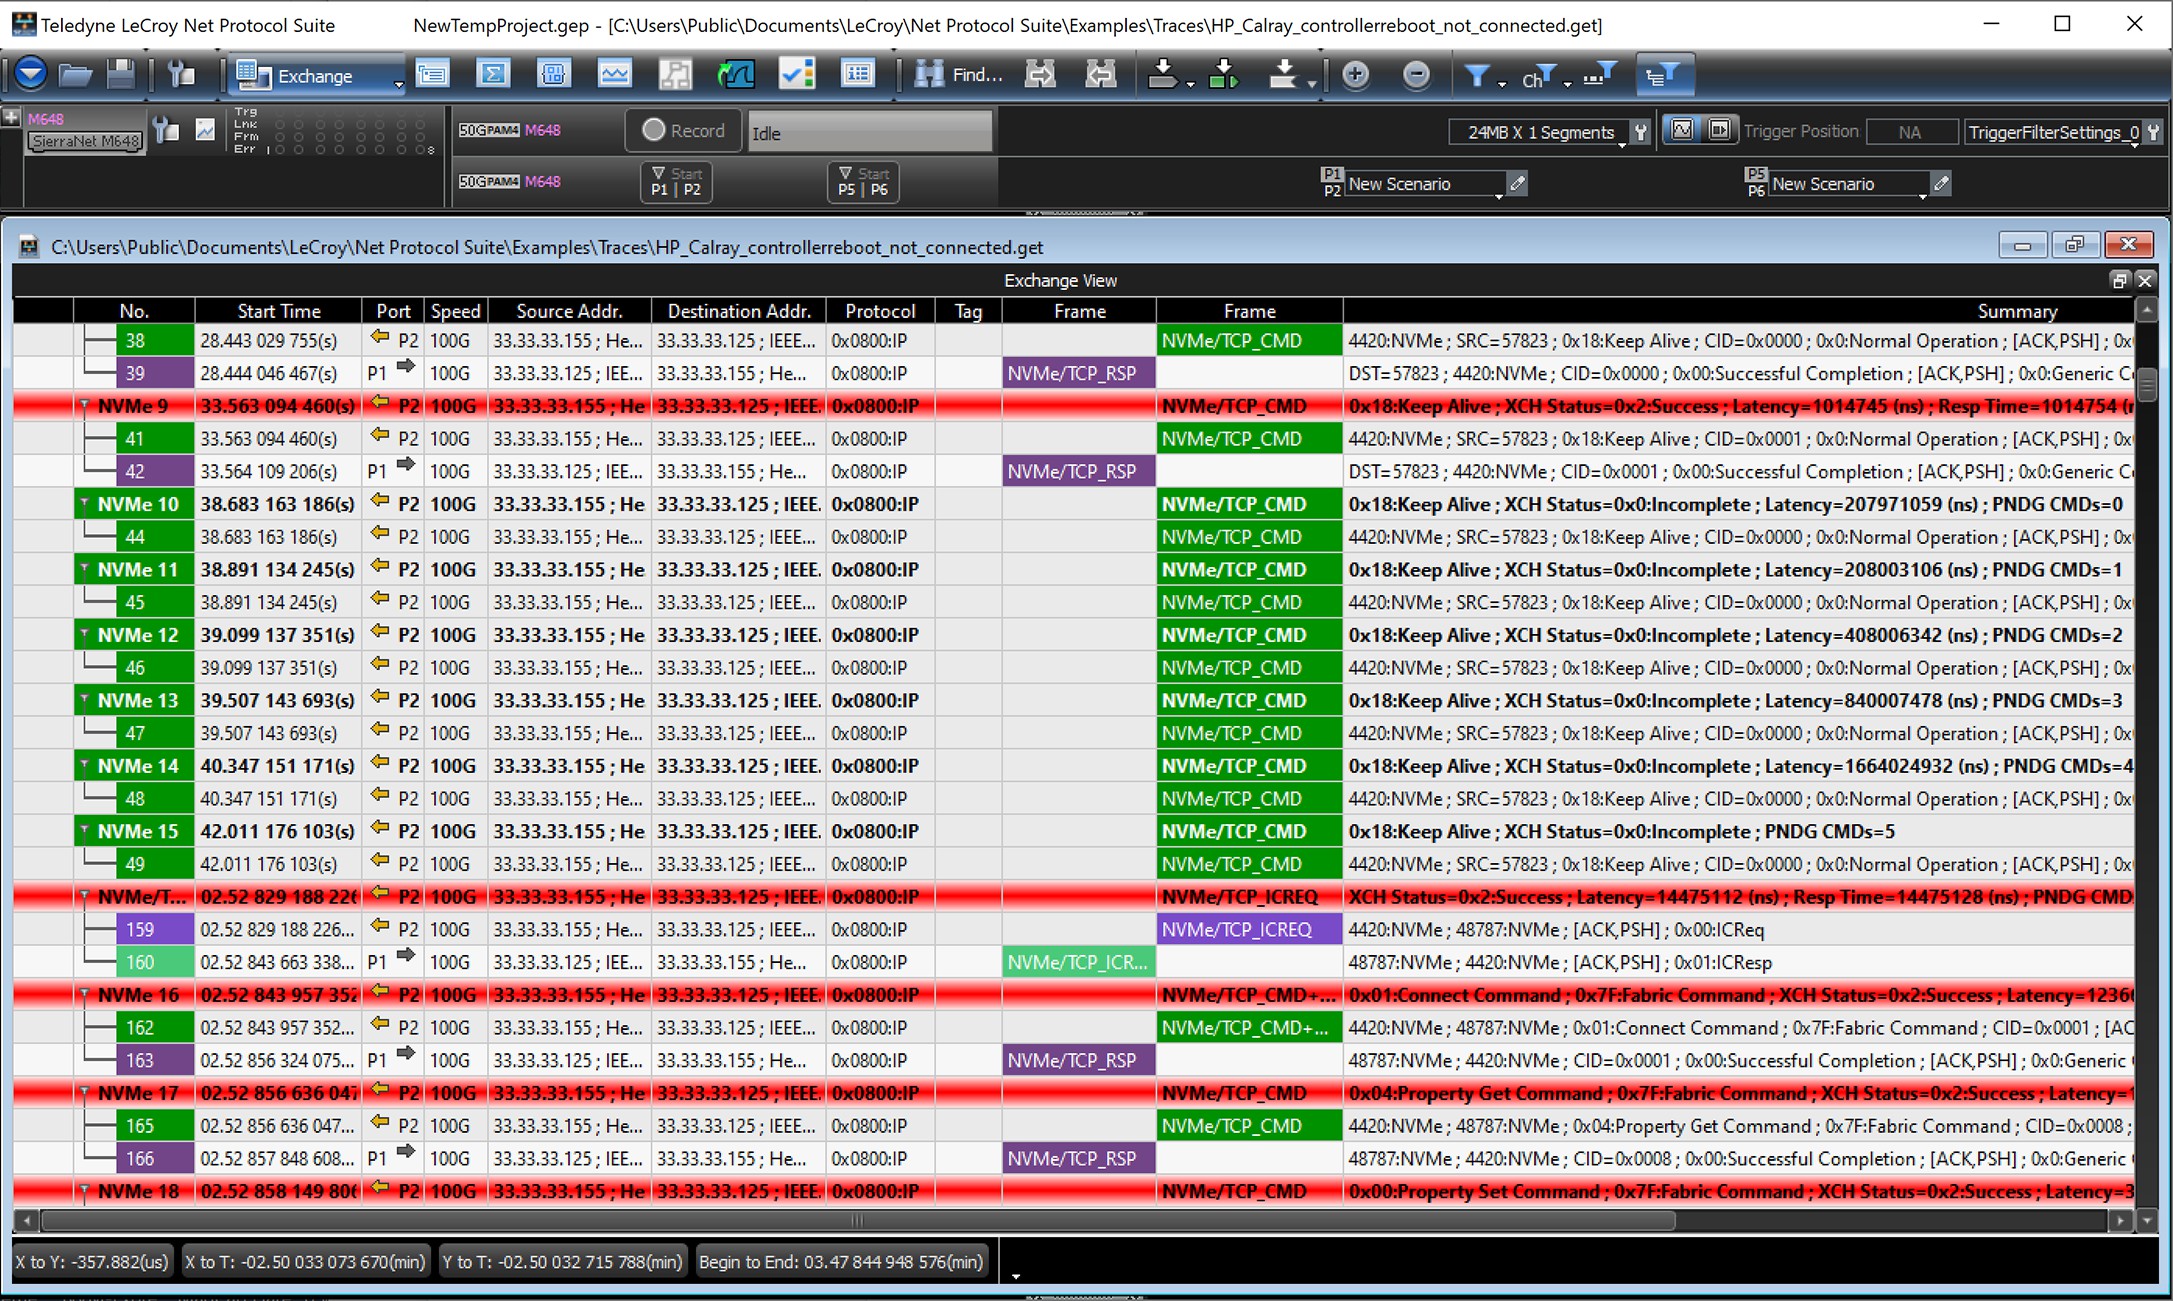
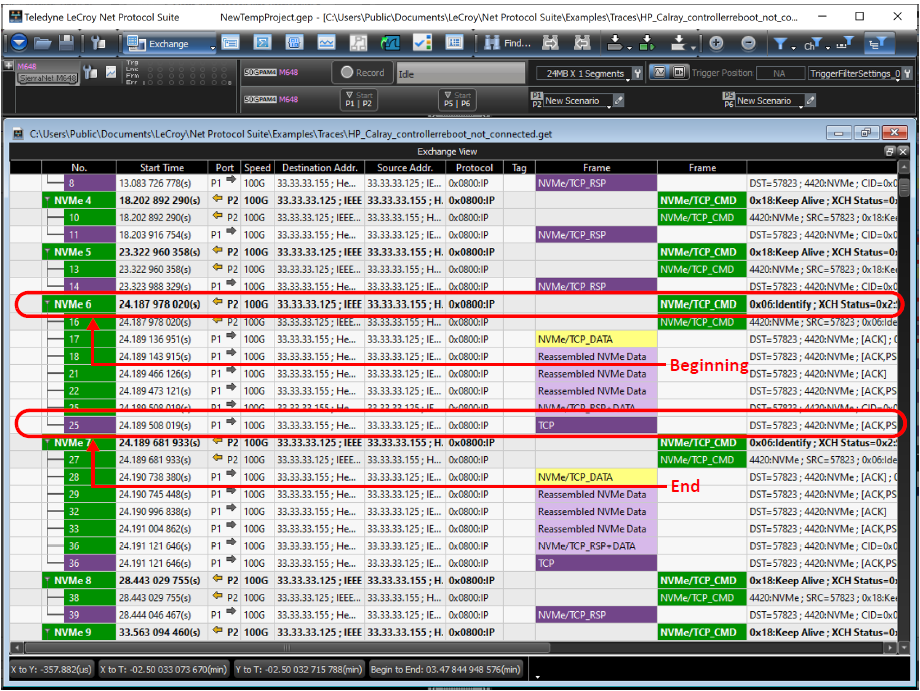
For NVMe transactions, the start and end of the transaction are clearly displayed in Exchange View.
Thresholds: Errors and Warnings
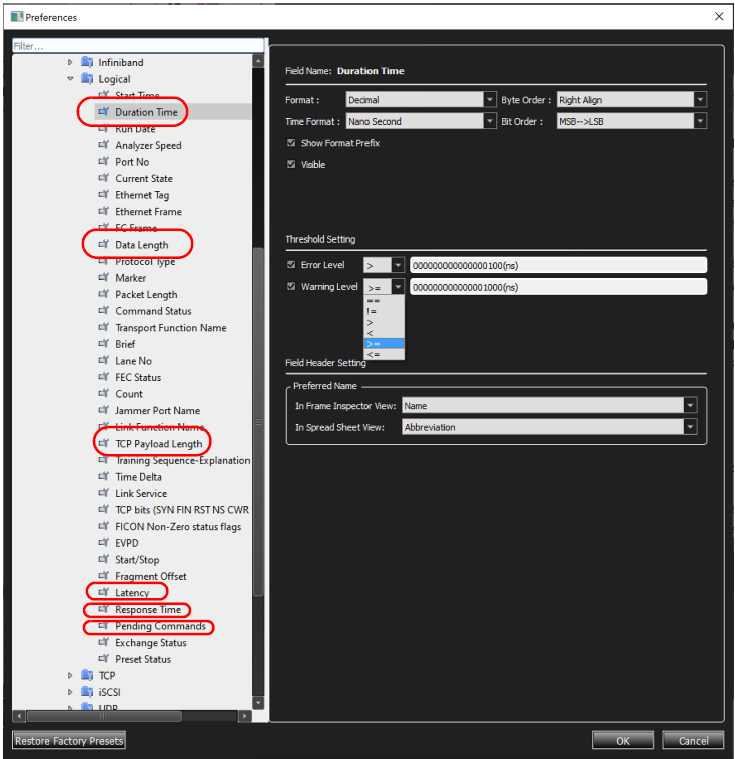
You can set Error and Warning thresholds for the following Logical Fields:
-
Duration
-
Data Length
-
Packet length
-
TCP Payload length
-
Latency
-
Response time
-
Pending commands
To set the Threshold values, go to the Preferences icon 
After you set up Thresholds, they will show up in the recorded trace if exceeded. You can see typical results of setting Thresholds below.