Spreadsheet View displays captured events sequentially, one per line. The events are decoded and event fields are displayed column by column.
To display the Spreadsheet View of the current capture, click Analysis > Spreadsheet View or click the 
Column Set
Spreadsheet View columns are created based on a specific column set. Modify the column set by adding columns, removing columns, or updating fields in a column. Next time the trace is opened, it will show the columns from the previous session, even if it’s opened using another machine.
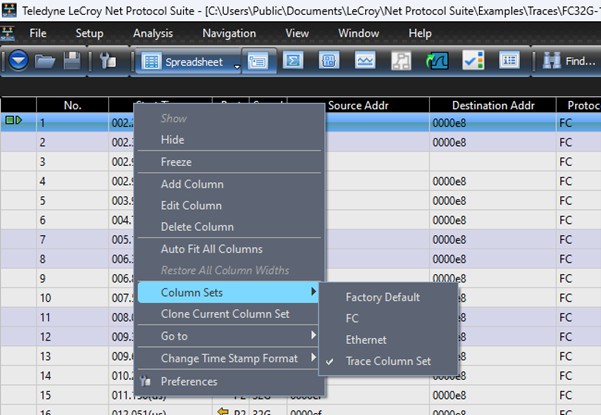
Right-click the header of the Spreadsheet View to display the context menu.
Column sets: Shows all defined column sets in the Net Protocol Suite. You can switch between the sets to change the display in the viewer.
-
Factory Default: The factory default column set
-
Trace Column set: The column set that was saved in the trace file. It is the default column set when the trace is opened.
-
Others: The list of created column sets such as FC and Ethernet.
Clone Current column set: Clones the current column set in case user needs to generate a column set based on the existing one.
Active Column Set
When a new trace is recorded, the Active Column Set is used to show the Spreadsheet View. The life cycle of the active column set is from launching Net Protocol Suit till closing application. It is updated based on below:
-
When Net Protocol Suite opens, the active column set is cloned from default col-umn set. See Save a Set of Column Settings to learn how to create a default column set.
-
When the application is active, any updates to any column set in any trace file make that column set the active column set.
-
When the application is closed, the active column set is removed.
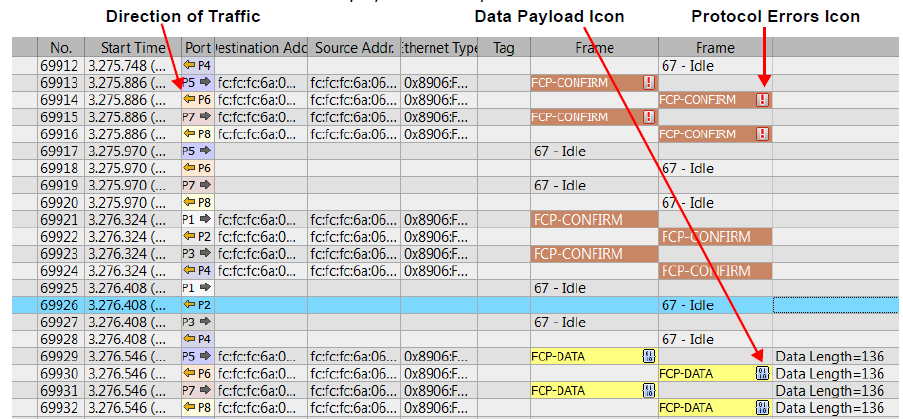
Data Payload
-
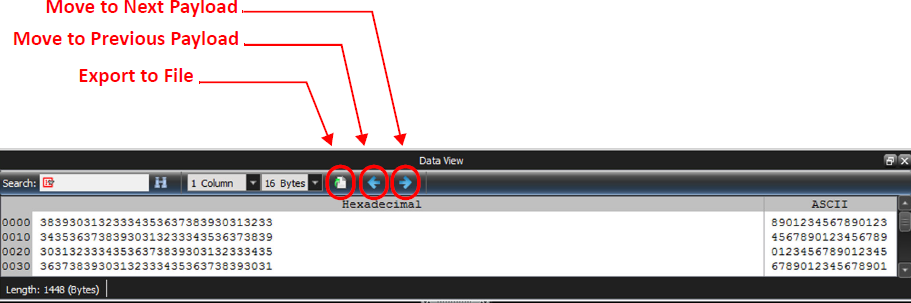
Click the

-
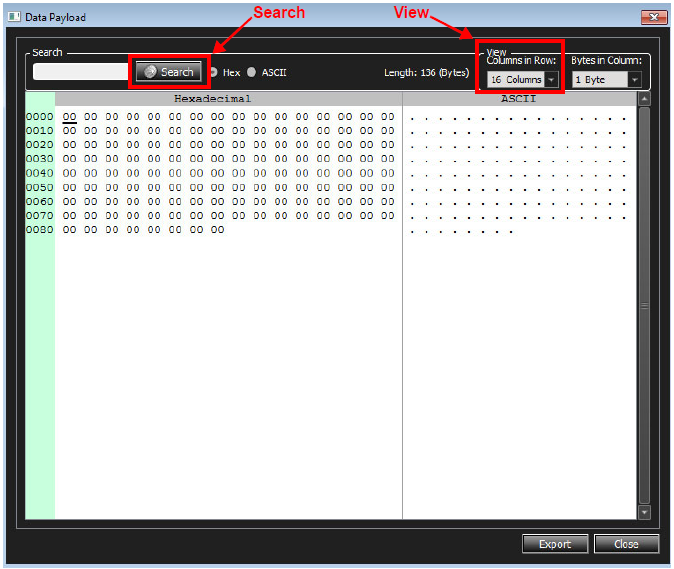
Click the Export button to export the data payload to a text file.
-
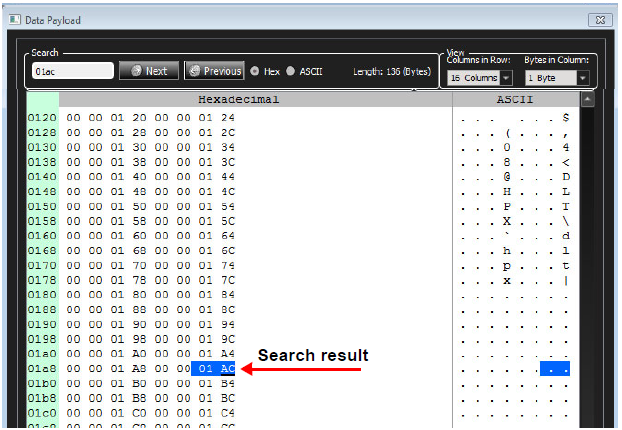
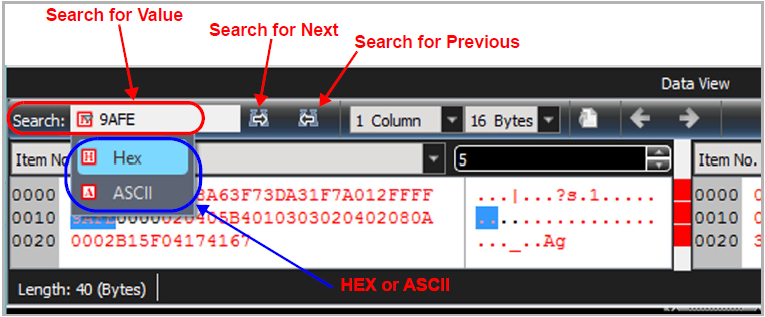
Enter a value and click the Next or Previous button to search the data payload in Hexadecimal or ASCII format.
The application looks for byte boundaries while searching. Hence, searching for ‘1A’ will not result in a match because it spans two bytes, whereas searching for ‘01AC’ will result in a match.
-
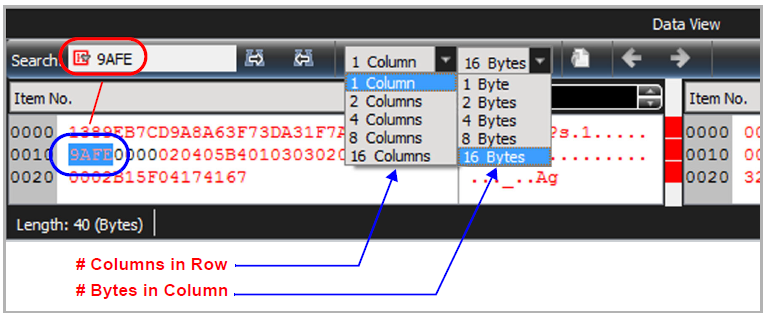
Click the Columns in Row and Bytes in Column drop-down menu lists in the View pane to configure the display.
-
Click Hex or ASCII to specify the search criteria.
-
To configure the display, click the Columns in Row and Bytes in Column drop-down lists in the View pane.
Protocol Errors
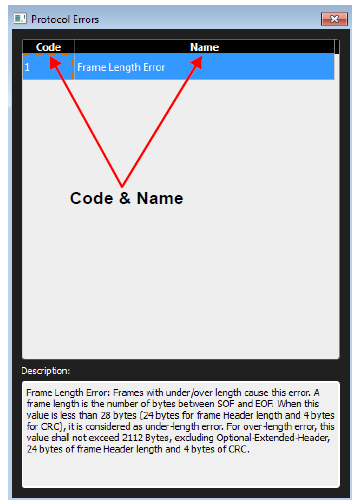
Click the 
Viewing Ethernet and Fibre Channel Traces
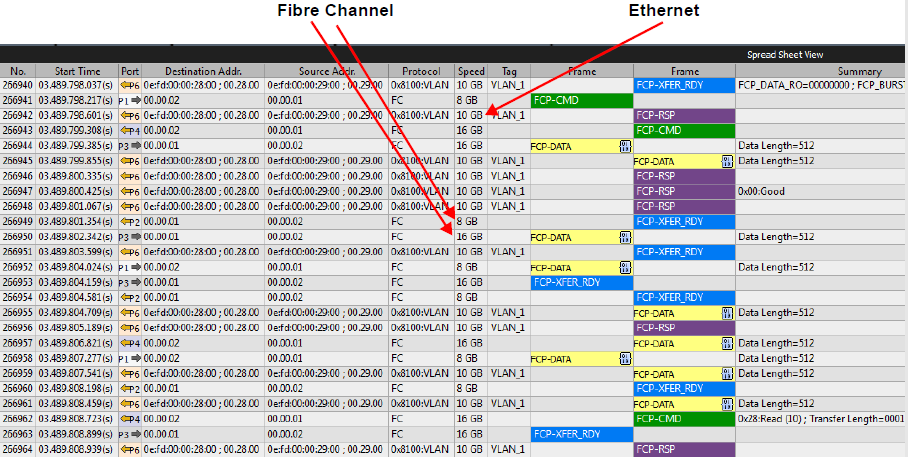
The application captures and displays both Ethernet and Fibre Channel data.
Spreadsheet View Options
Right-click in any row of the Spreadsheet View to display the context menu. Byte Oder is displayed for destination and source columns only.
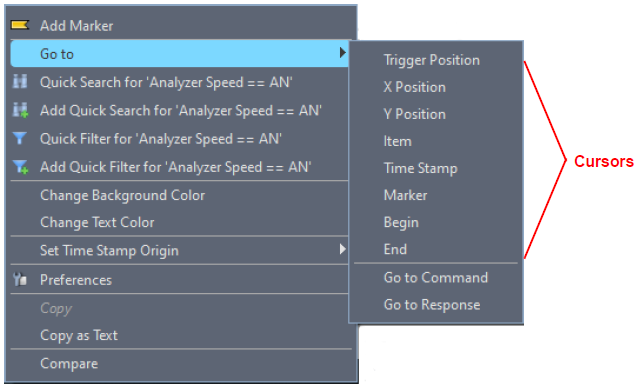
Spreadsheet View Menu Options
|
Menu Option |
Description |
|
Add Marker |
Opens the Marker List dialog. You can add and delete markers (see Markers.) |
|
Byte Order |
This option is context sensitive. This option allows a you left/ right align the data display in each cell. |
|
Go to |
The Go to option jumps to a related frame in the viewer. It displays the following sub-menu options to Go to Trigger, X or Y Position, Event, Time Stamp, Marker, Begin and End, which are all Cursors. See Cursors. |
|
Quick Search |
Pops up the Quick Search Dialog. |
|
Quick Filter |
Pops up the Quick Filter Dialog. |
|
Change Background Color |
Displays colors to change the background. |
|
Change Text Color |
Displays colors to change the text. |
|
Set Time Stamp Origin |
There are four options to set time stamp origin. See Set Time Stamp Origin. |
|
Preferences |
Displays the Preferences window |
|
Copy |
Copies the frame to allow you to paste it in the Trigger settings and/or InFusion Scenario events. |
|
Copy as Text |
Copies the information from the frame and allows you to paste it into any text editor. |
|
Compare |
Compare data payload from two different transactions. See Compare (Data Payloads). |
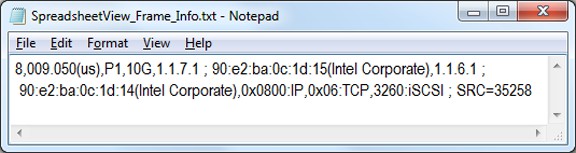
Copy as Text
Allows you to select a frame from the Spreadsheet View. Then you can copy and paste the information into any text editor.

Compare (Data Payloads)
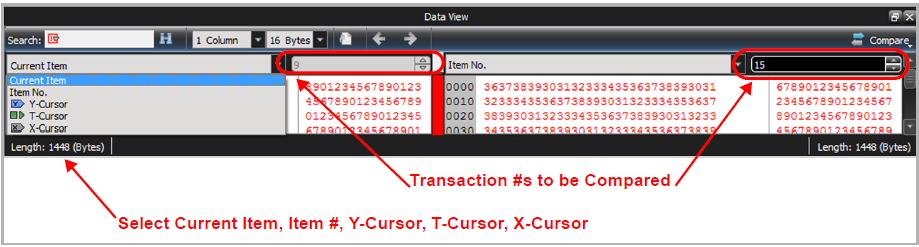
The Compare function allows you to select two different transactions and compare their data payloads. After loading a trace and selecting the Spreadsheet View, right-click in the Spreadsheet View to bring up the context menu.
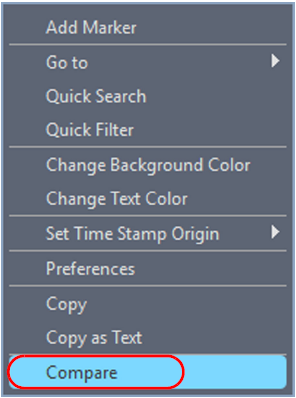
Click the Compare tab and the Data View will show data from two items.
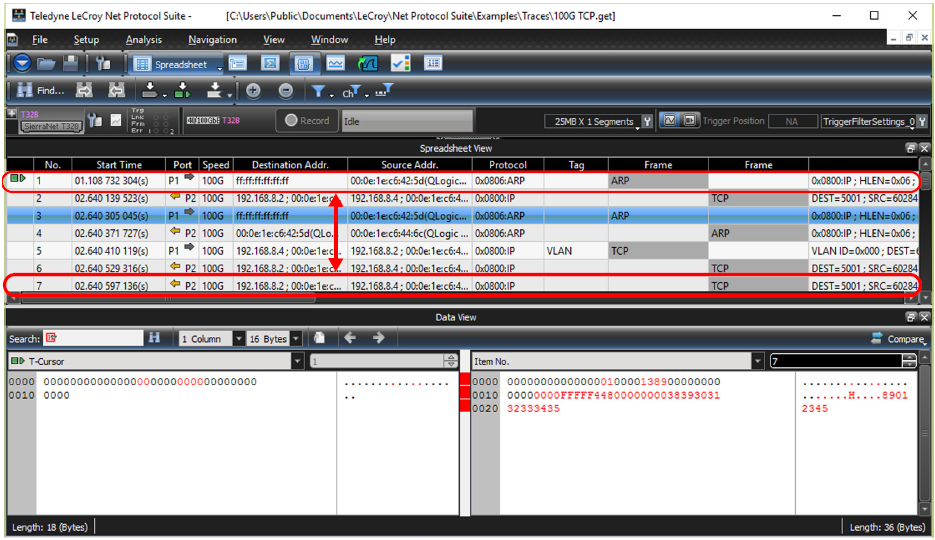
The Compare Data View shows you the payloads of two different transaction so you can explore their differences. In the case shown above transaction #1 is compared to transaction #7.
The differences in their respective payloads are highlighted in red. Data that is the same is displayed in black.

Data View Toolbar
The Data View toolbar has the following features:
-
Search (Entry window: HEX or ASCII), Search Next, Search Previous
-
# Columns in Row
-
# Bytes in Column
-
Item No. (Current Item, Item No., Y-Cursor, T-Cursor, X-Cursor)
-
Display HEX and ASCII
-
Exit Compare
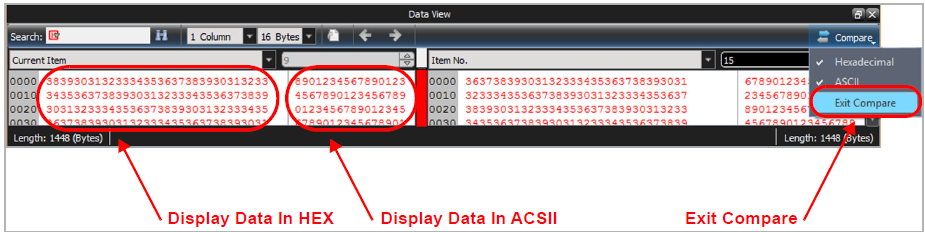
If you select Exit Compare, the display will return to Data Display for a single item.
Markers
Markers are a convenient way to mark a point in the trace with your own label, so that you can rapidly return to that point. To create markers for your data:
-
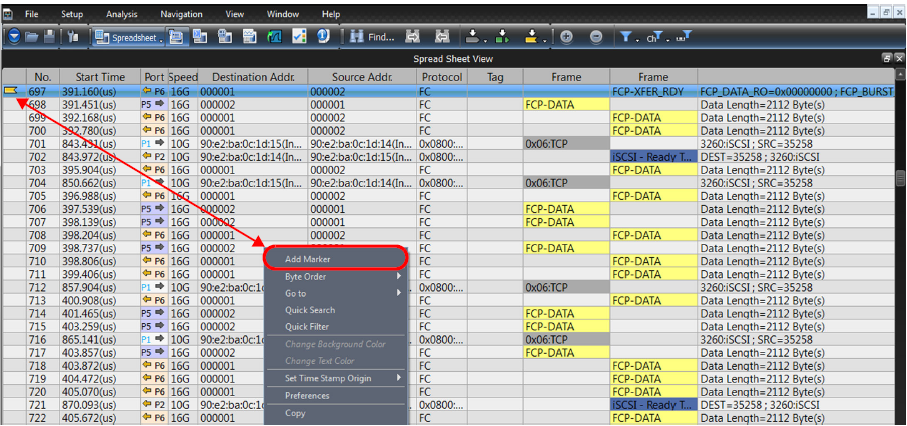
Right-click anywhere in the data in Spreadsheet view and select Add Marker.
-
Enter a Name and description for the Marker, then click Add. Once you have a list of Markers, you can delete, edit or go to a specific marker.
-
Right-click on a frame in the Spreadsheet view, then click Add Marker from the drop-down menu. A dialog box opens, which can be populated with a name and description.
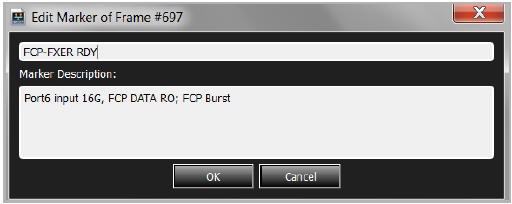
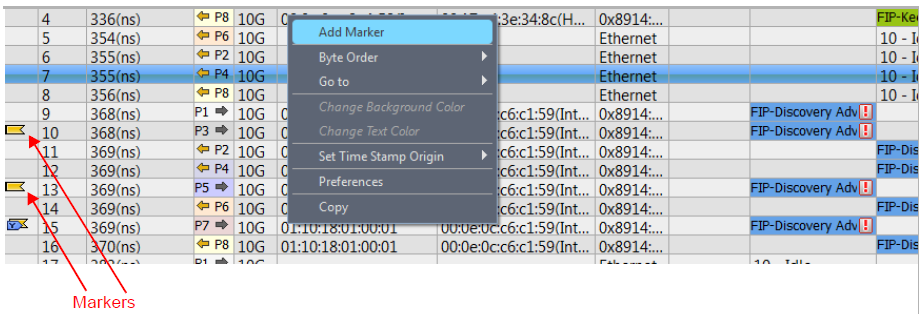
Once markers are created, they are displayed in the left column of the rows as shown below.
-
Hover the mouse over these markers to quickly see their name and description.
Finding a Marker
To find a marker in the Trace:
-
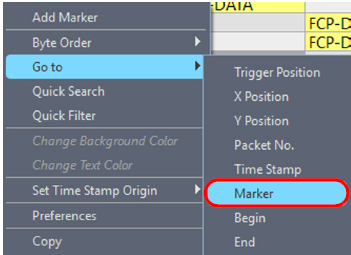
Right-click in the trace viewer and select Go to > Marker.
-
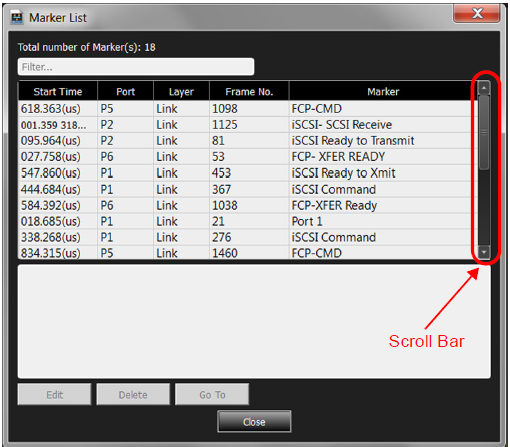
A window appears that contains all of the Markers in the Trace.
Sorting the Marker List
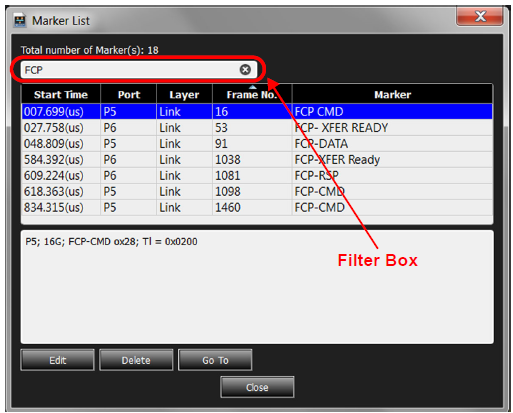
There are several ways of sorting the Marker List. One is by using the Filter Box at the top of the Marker List window. In this case, all Markers of type FCP are displayed.
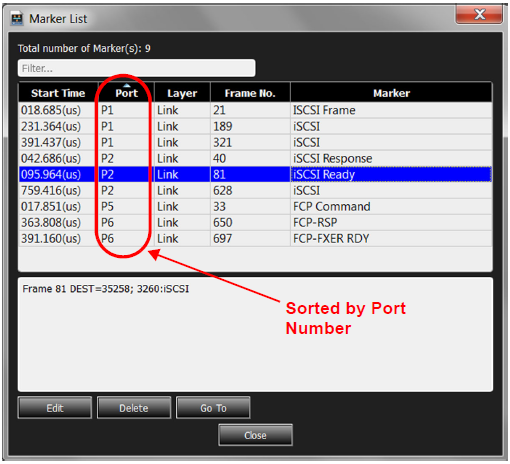
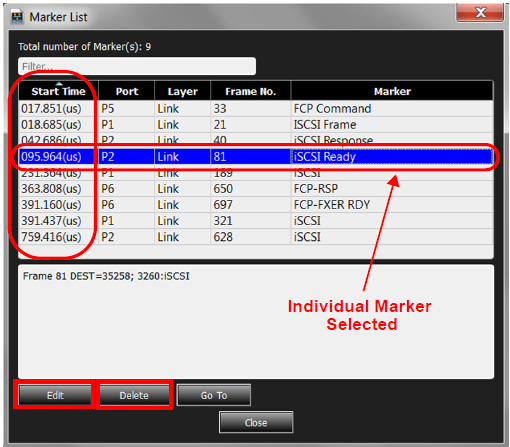
You can also sort by each column header of the list (Start Time, Port, Layer Type, Frame #, or Marker text in the last column) can be used to sort the list by that column header in ascending or descending order.
Selecting/Go To a Marker
In the image below, the Marker in Frame 81 has been Selected. After being Selected, a Marker can be Edited or Deleted by clicking on the appropriate button.
Another option is to use the Go To button, which moves the Spreadsheet view to the specific frame selected by clicking the Go To button. In this case, Frame 81 was selected and is shown at the top of the Spreadsheet view.
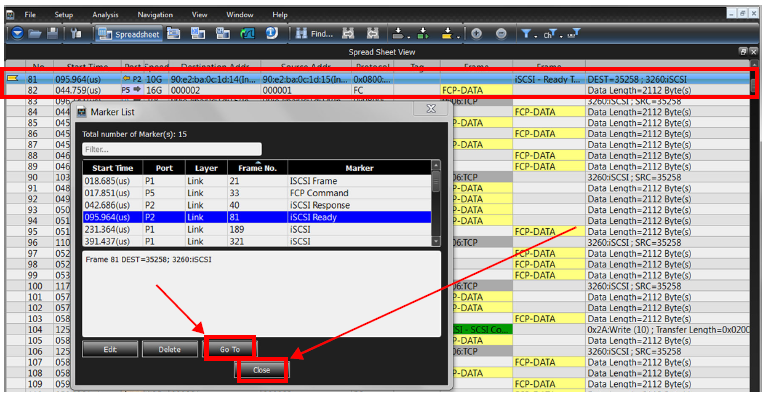
After working with the Markers, click the Close button to close the window.
Cursors
The spreadsheet view display incorporates three cursors labeled X, Y, and T. All cursors are initially overlaid and positioned at location 0, which is the trigger position of the display. The Trigger, or T, cursor is the measurement reference and is always at location 0 in the display.
Positioning the X Cursor
To position the X-Cursor within the viewer data display, click the left mouse button in the gray bar on the left side of the trace viewer next to the line in which to place the cursor.
Positioning the Y Cursor
To position the Y-cursor within the viewer data display, click the right mouse button in the gray bar on the left side of the trace viewer next to the line in which to place the cursor.
Locate Cursors
To quickly locate any cursor within the data viewer display, right-click and select the Go To X or Go To Y option and choose the cursor to locate. You can also locate a cursor by selecting Go To from the Navigation menu and choosing the cursor to locate.
Spreadsheet Context Menu
To access the Spreadsheet context menu, right-click anywhere in the Spreadsheet View.
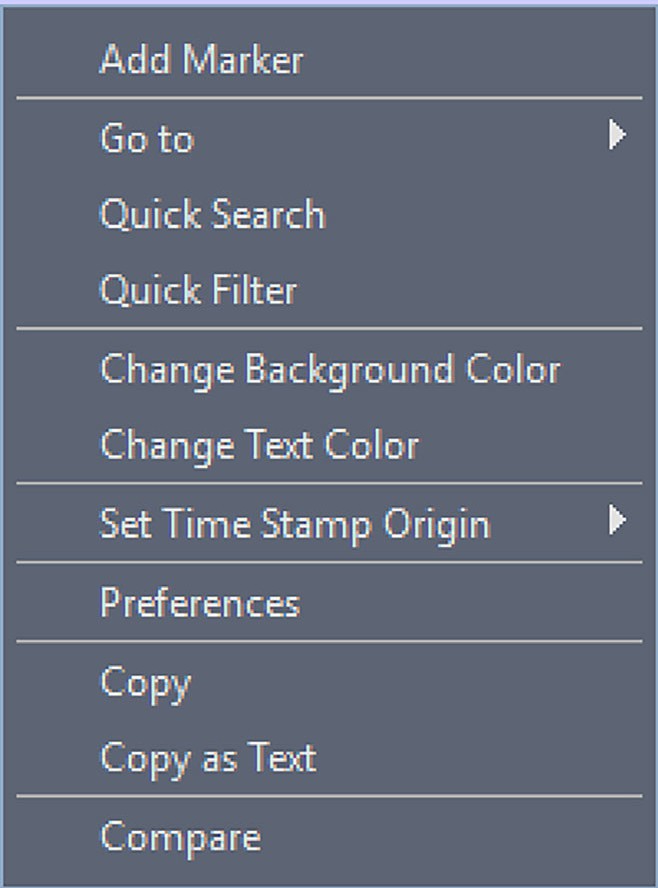
Add Marker Option
See Markers for information on adding Markers.
Go To Options
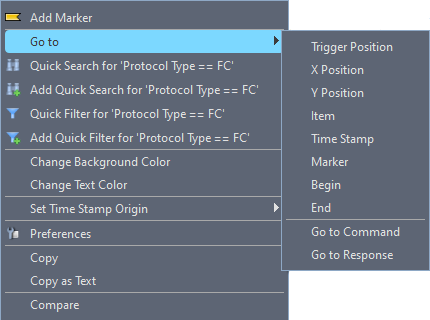
The following options are available:
-
Trigger Position
-
X Position
-
Y Position
-
Item
-
Time Stamp
-
Marker
-
Begin
-
End
-
Go to Command
-
Go to Response
Go to Trigger Position
To go to the Trigger Position of a trace, click the Go To button and choose Trigger Position.
Go to X Position
To go to the X Position of a trace, click the Go To button and choose X Position.
Go to Y Position
To go to the Y Position of a trace, click the Go To button and choose Y Position.
Go to Item
-
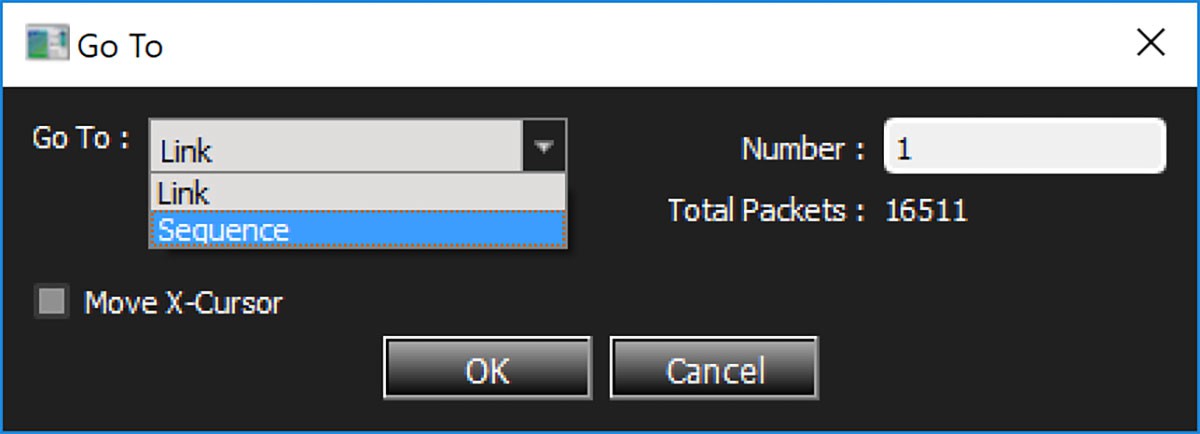
To locate an Item, select Go To Item or click the down arrow to select Links or Sequences.
-
Enter the Type and Number of Items you need in the Go To dialog box and click OK.
Go to Time Stamp
To go to a specific Time Stamp of a trace, click the Go To button and choose Time Stamp.
Go to Marker
To go to a specific marker of a trace, click the Go To button and choose Marker (see Markers).
Go to Begin
To go to the beginning of a trace, click the Go To button and choose Begin.
Go to End
To go to the end of a trace, click the Go To button and choose End. Go to Command
Go to Response
Set Time Stamp Origin
Right-click and choose Set Time Stamp Origin).
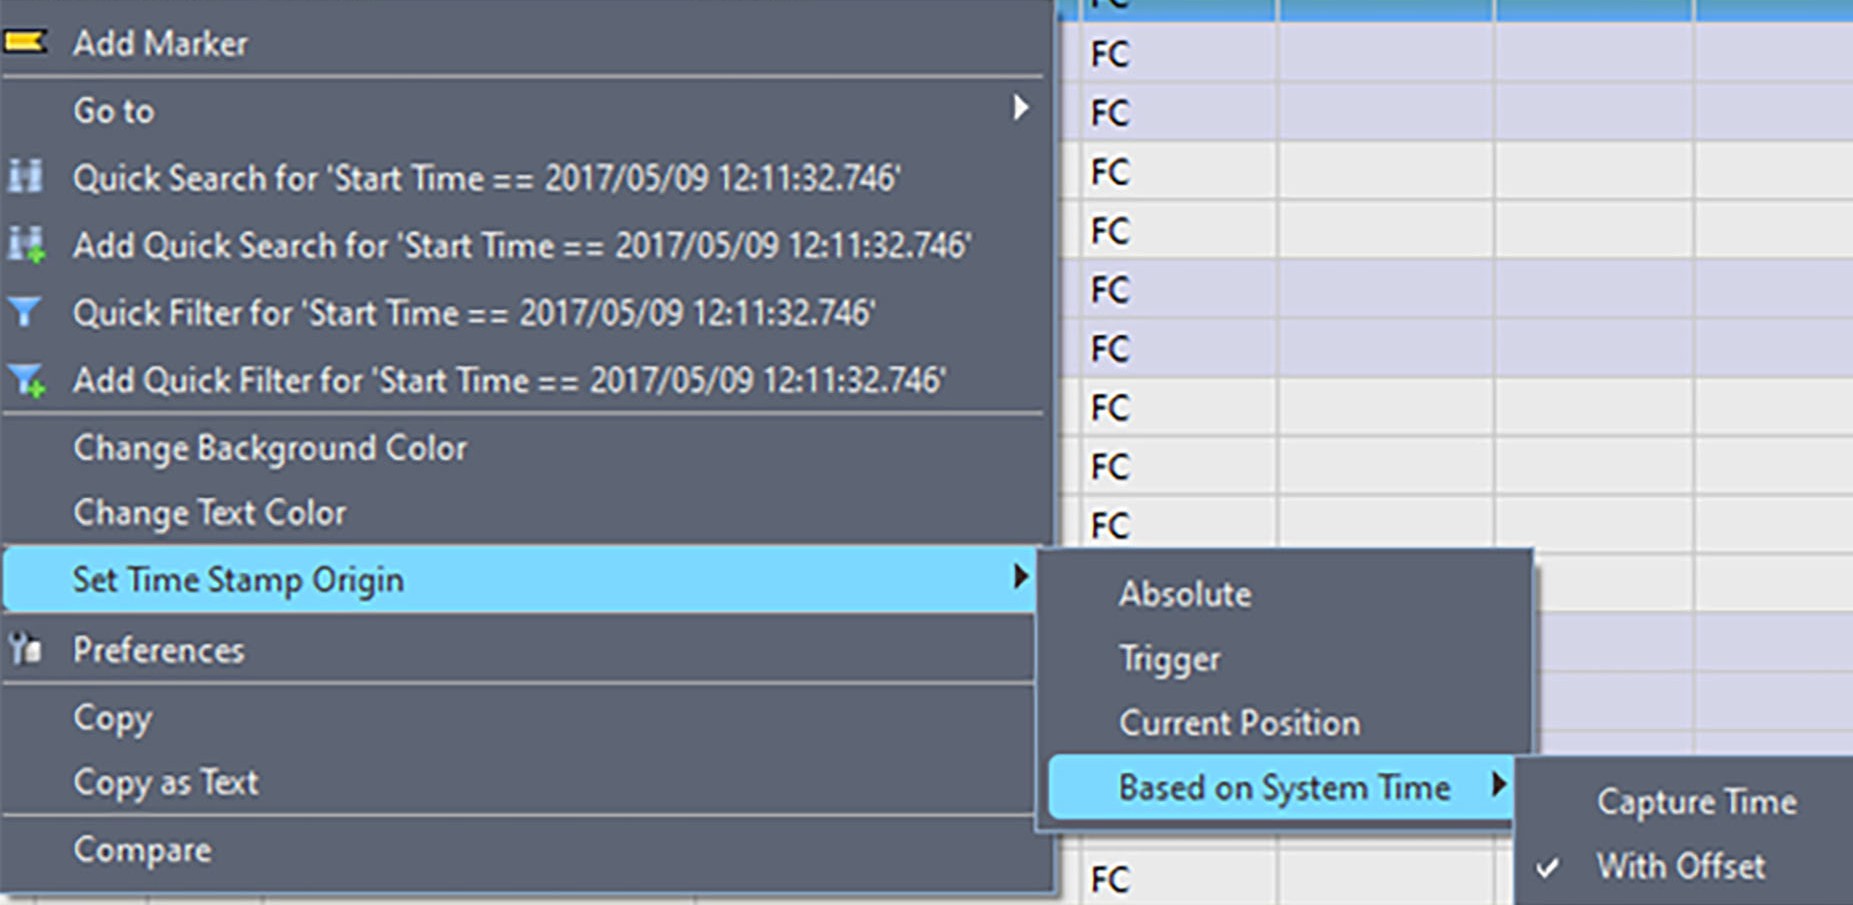
The following options are available:
Absolute: Sets the time stamp to zero when the recording starts.
Note: The first frame in the trace might have a time stamp larger than zero due to filtering, hiding, or other reasons, i.e., if recording started in the middle of a frame.
Trigger: Sets the time stamp to zero when the trace was triggered. Current Position: Sets the time stamp to zero from the current position. Based on System Time
Capture Time: Sets time based on the system capture time
With Offset: Sets time based on the system capture time with the specified offset. By clicking it, user can input offset or add offset to existing offset.
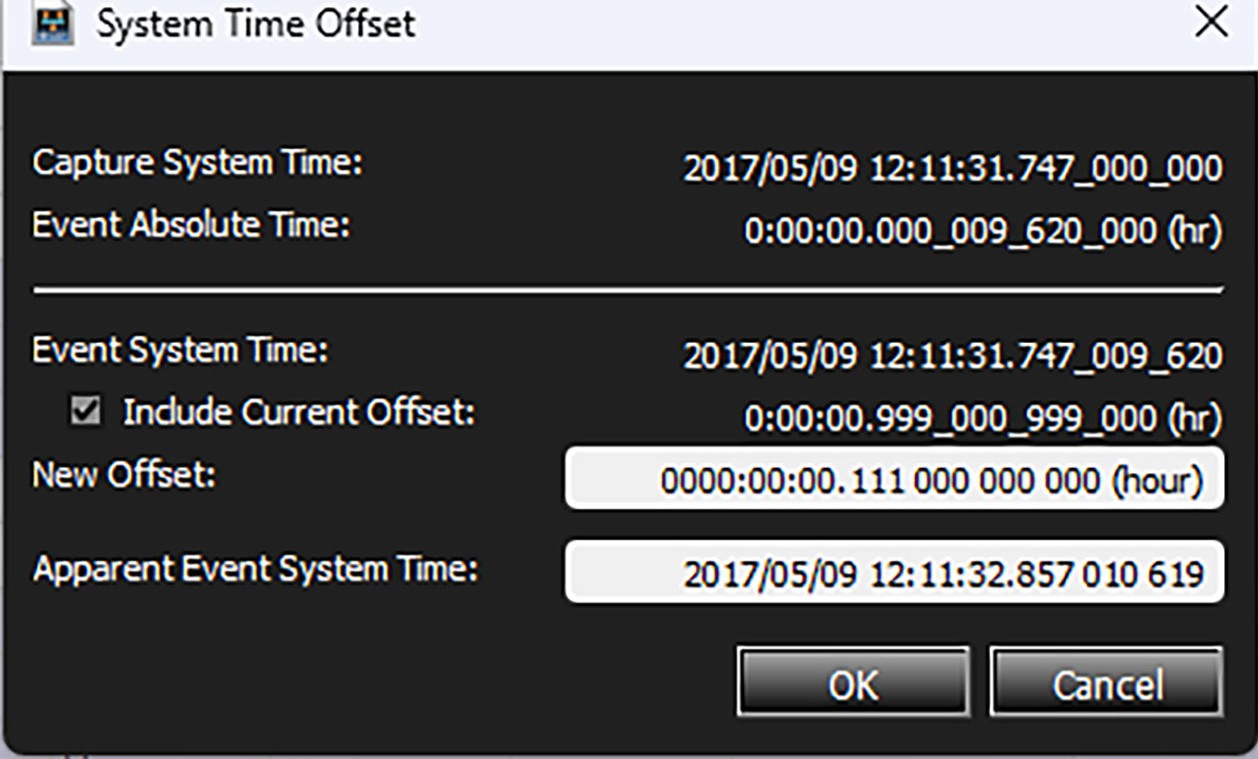
Note: The applied time offset will be saved in the trace file and will be applied after reopening the trace file.
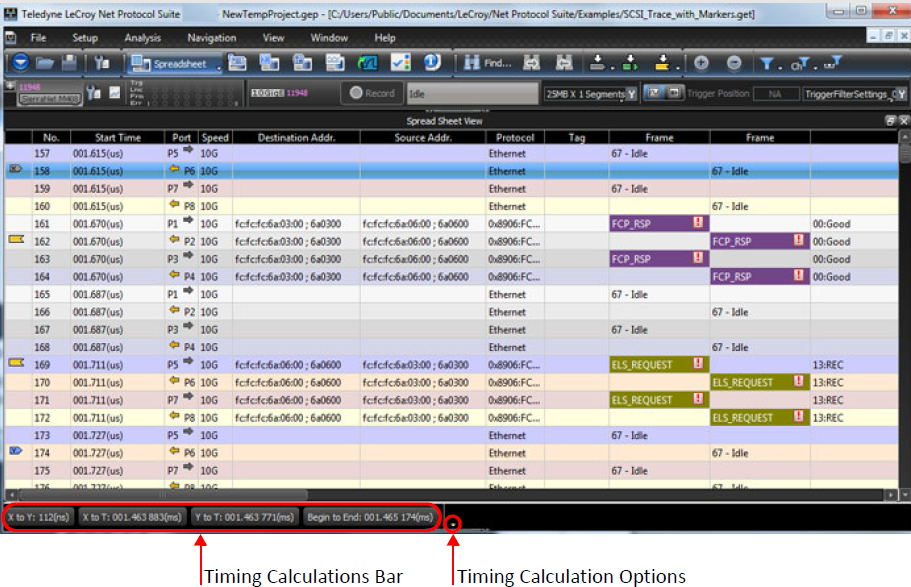
Cursor/Marker Timing Calculations Display Bar
A Timing Calculator Display Bar is located at the bottom of the Net Protocol Suite Main Menu, after a Trace is recorded or loaded.
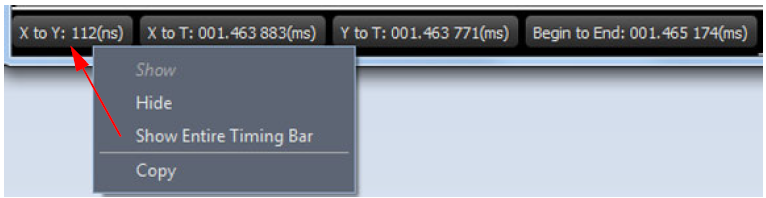
Default Timing Calculations
The default times displayed are:
-
X to Y
-
X to T
-
Y to T
-
Begin to End
Each of the Default Timing Display Options can be seen more detail below.
-
Show
-
Hide
-
Show Entire Timing Display
-
Copy
Customize Timing Calculations Bar
There is also a Customize option – click on the small white triangle to the right of the Timing Bar.
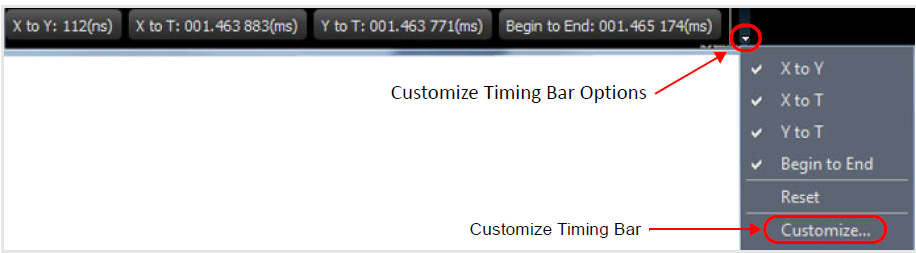
The Customize option allows you to specify Markers, enabling you to find the exact time between any two Markers.
-
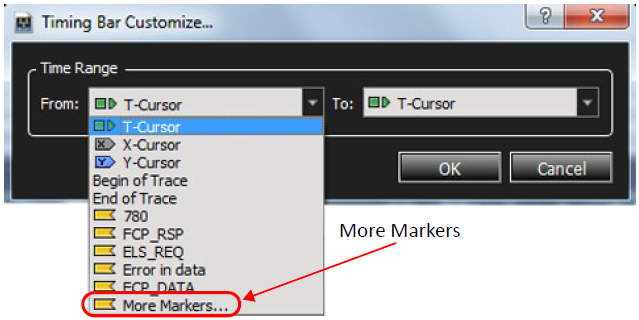
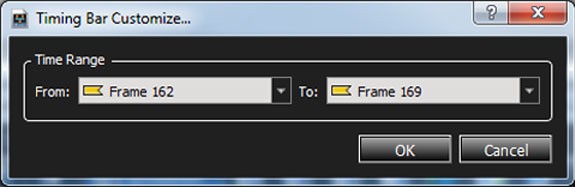
Click the Customize Option and the Timing Bar Customize window opens.
-
To choose a range, select More Markers. The Marker List window containing All Markers appears.
-
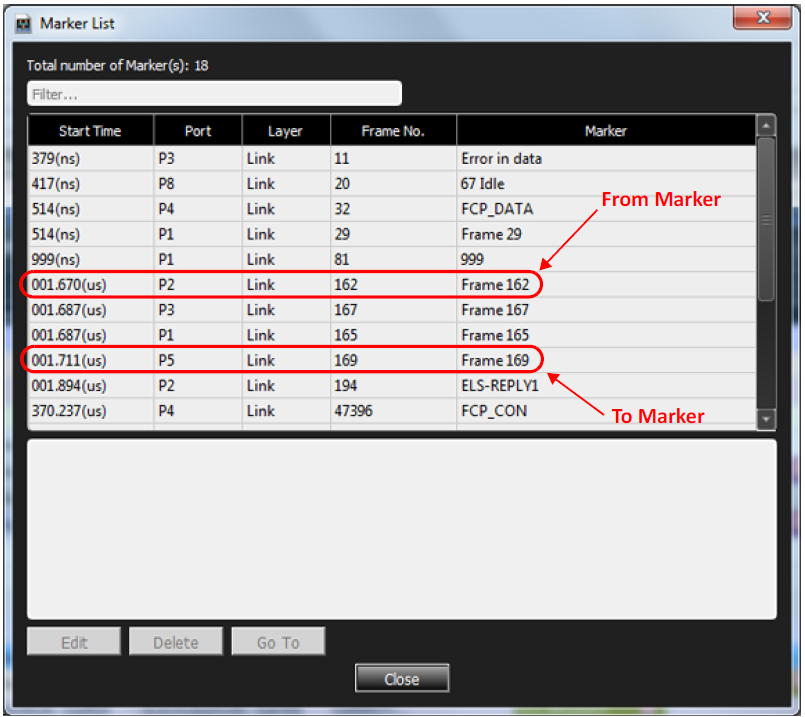
Choose any Marker for From and any Marker for To.
For example:
-
Frame 162 is selected for the From Marker and Frame 169 is selected for the To Marker. The Timing Bar Customize dialog box displays the two Markers of interest.
-
Click OK to show the time between the two markers in the updated Timing Bar.

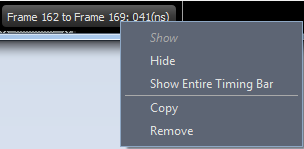
Options for Customized Timing Bar
The options available for a Customized Timing Bar are shown below.
Column Display Options
You can customize the columns display by showing/hiding, adding, editing or deleting columns. Right-click in the column header and select an option.
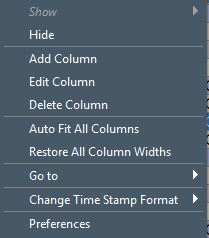
Spreadsheet Column View Options
|
Menu Option |
Description |
|
Show |
Displays a hidden column. |
|
Hide |
Hides a column. |
|
Add Column |
Allows you to add a column (see Add Columns to Spreadsheet View). Select Field, Column Name, Source Direction, foreground and back ground Colors, choose And/OR, display Data Payload Protocol Error icons, apply Frame and Port color, enable Time Format, display Field name, set column Alignment and Width and Add to Pre-defined Columns. Columns can also be added to the Pre-defined columns list. This list is a flat list where you can keep columns you might want to toggle on/off. |
|
Edit Column |
Allows you to edit column properties. It has the same functionality as Add Column above (see 5.2.1.17, Editing Items in a Column). |
|
Delete Column |
Allows you to delete the selected column. |
|
Auto Fit All Columns |
Adjusts the column widths to fit the text. |
|
Restore All Columns Widths |
Restores the column widths to the previous size. |
|
Go to: |
Displays options to go to Trigger, X or Y Position, event No., Time Stamp, Marker, Begin and End. |
|
Change Time Stamp Format: |
Displays options to select the time stamp format. |
|
Preferences |
Displays the Preferences window |
Add Columns to Spreadsheet View
Select Add Column to open the following dialog.
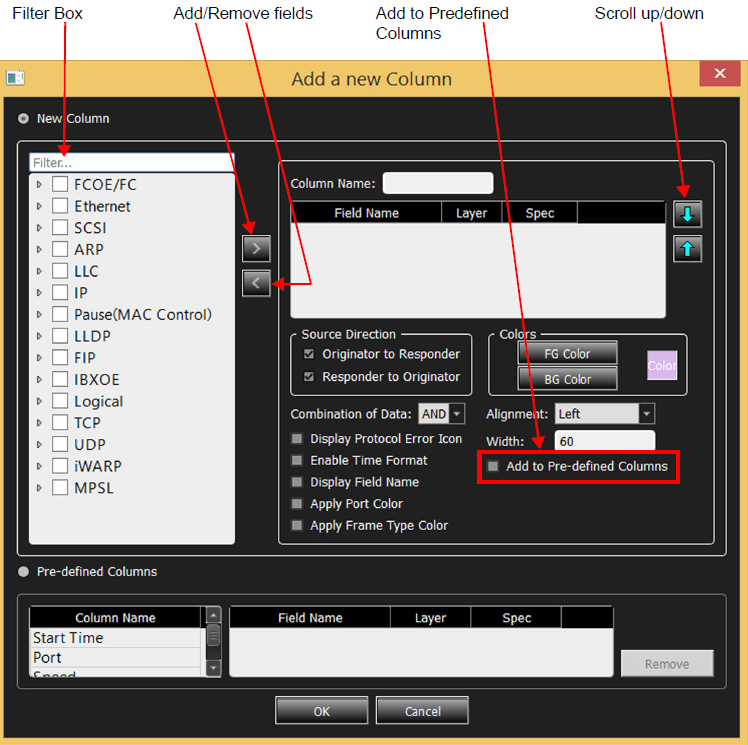
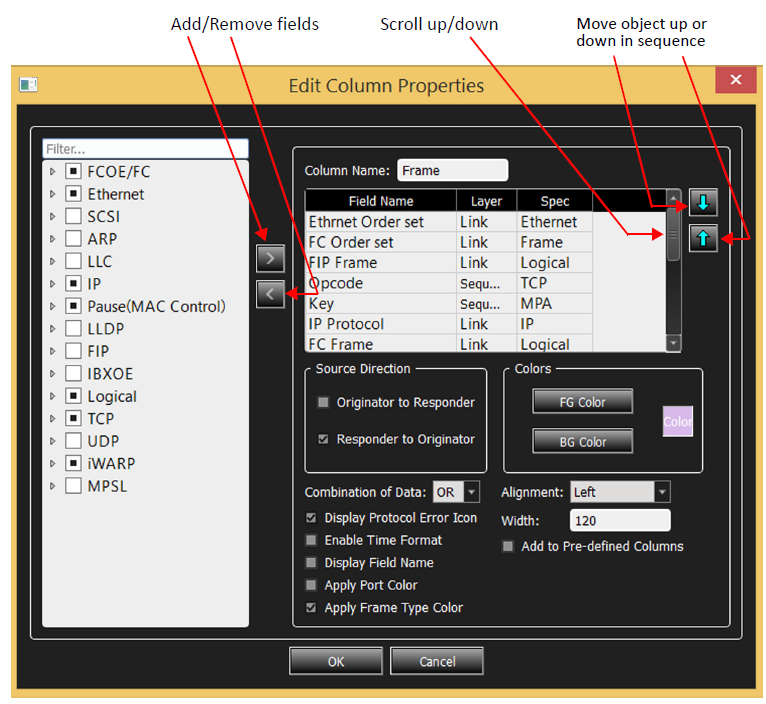
You can select any combination of fields to fill the content of the column. Use the Filter text box above the Fields tree list to more easily find the fields you’re interested in. In case you select multiple fields, the up/down buttons enable you to specify in which order they should be displayed in the column. Desired columns can also be added to the pre-defined columns. Pre-defined columns are ones that contain metadata (such as timestamp, port number, etc.) or custom ones that have been added by selecting Add to Predefined Columns.
Select Edit Column to open the following dialog.
Decode MAD Headers
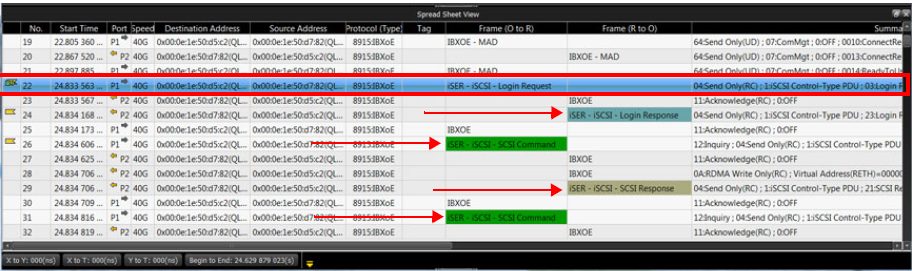
MAD Headers can be decoded and located in a Trace.

Decode iSER Headers
iSER Headers can be decoded and located in a Trace.
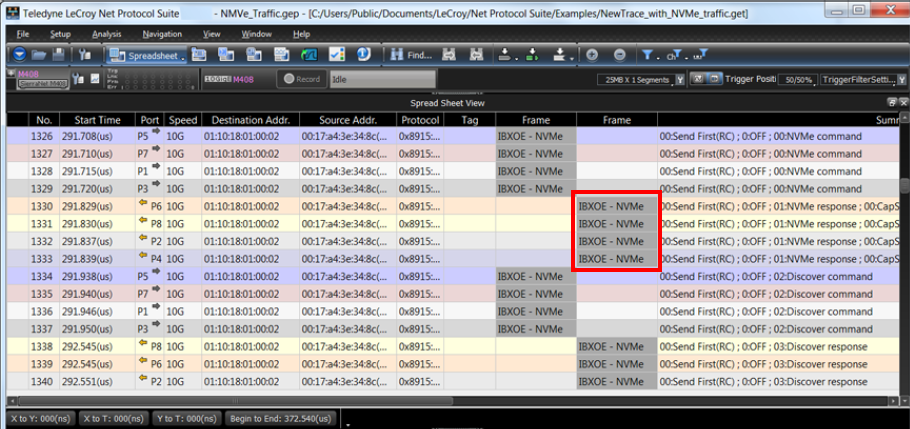
Decode NVMe Transactions
NVMe transactions can be decoded and displayed in Spreadsheet Mode.
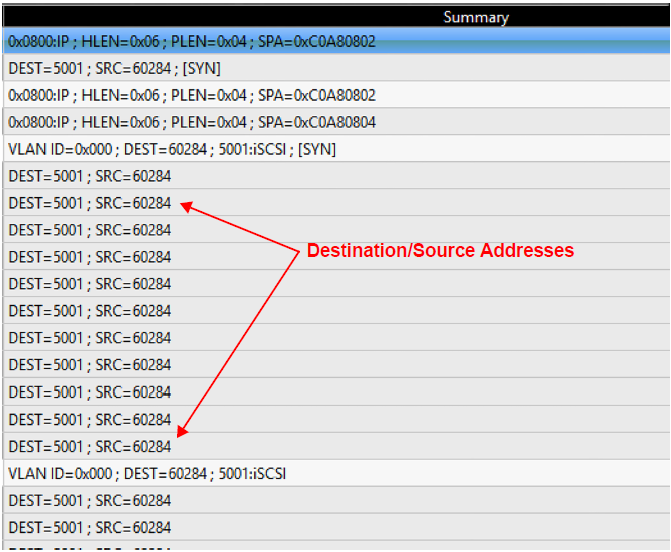
Edit Items in a Column
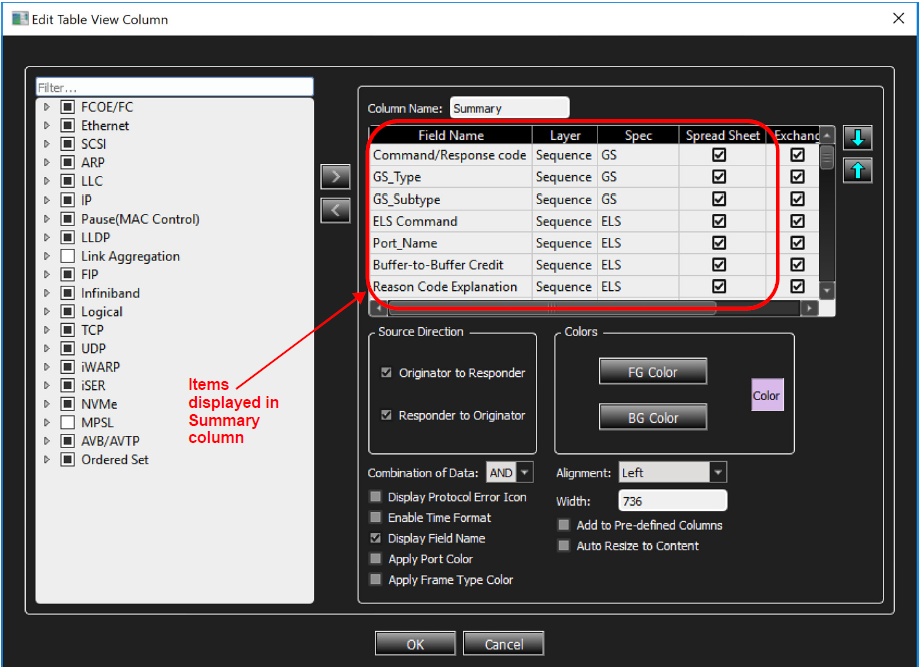
You can choose any information available and add it to a column. In this example the Summary column has been selected for editing. A sample Summary column is shown below.
To edit items in a column:
-
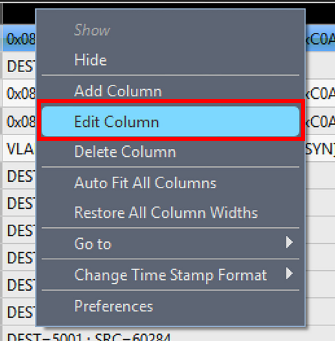
Move the cursor to the top of the Summary column you want to edit, then right-click in the column title area.
-
Select Edit Column. The Edit Table View Column window opens.
-
Scroll down to see all of the items that will be displayed in the Summary column.
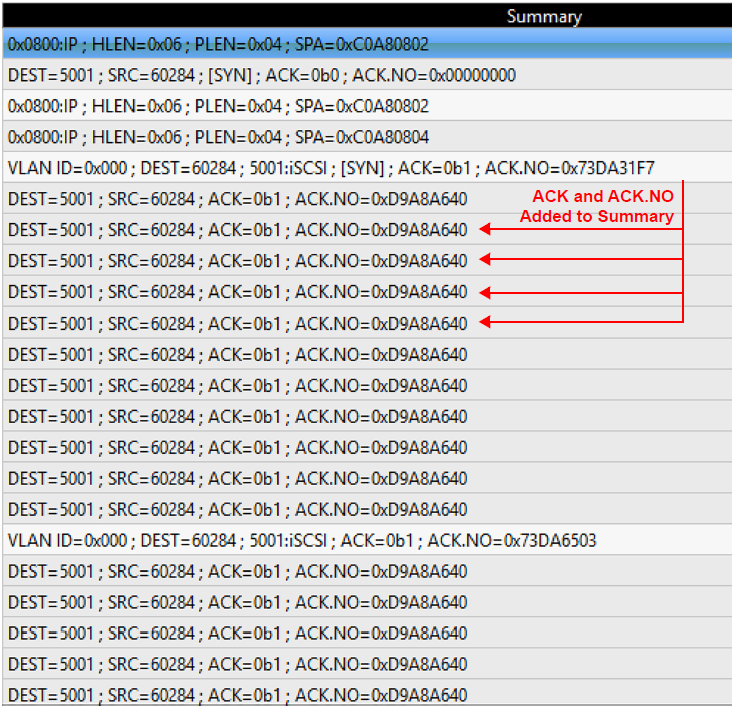
Example: Add ACK and ACK.NO to Summary Column
-
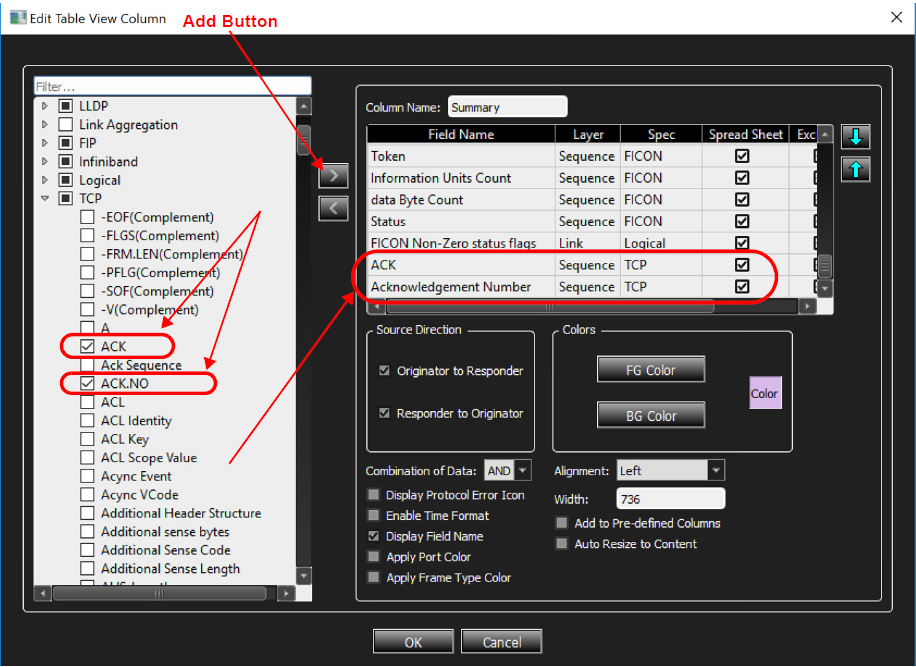
Scroll down to the bottom of the item list.
-
In the left pane, click the down arrow next to TCP to display its items.
-
Check the boxes for ACK and ACK.NO, then click OK. ACK and ACK.NO are added to the Summary Column.