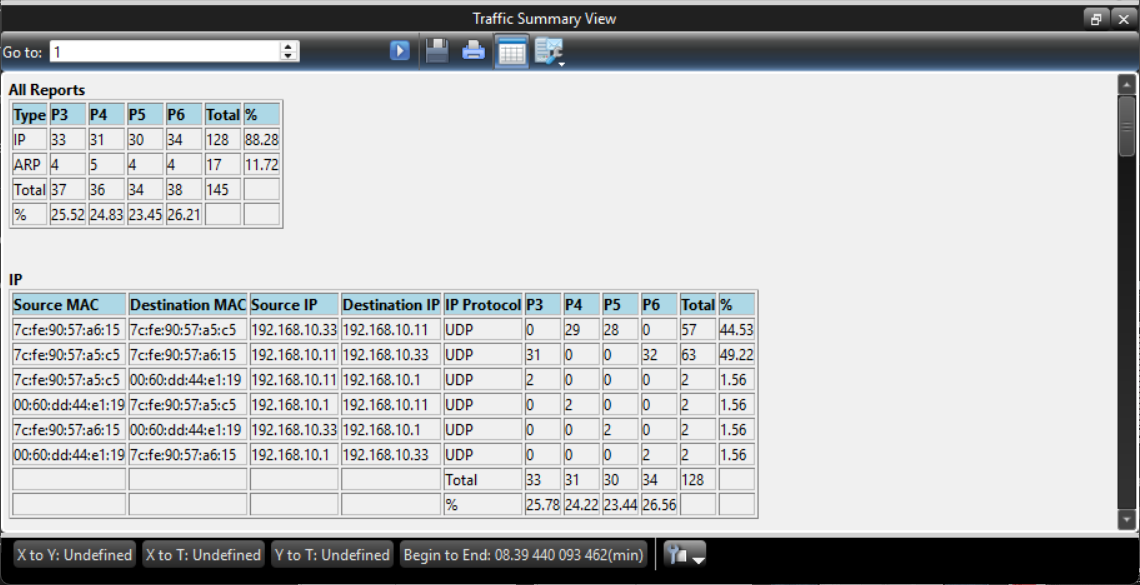
To open a Traffic Summary of captured Traces, go to Analysis > Traffic Summary. This Summary View displays the port number, statistics, and the percentage of the total count.
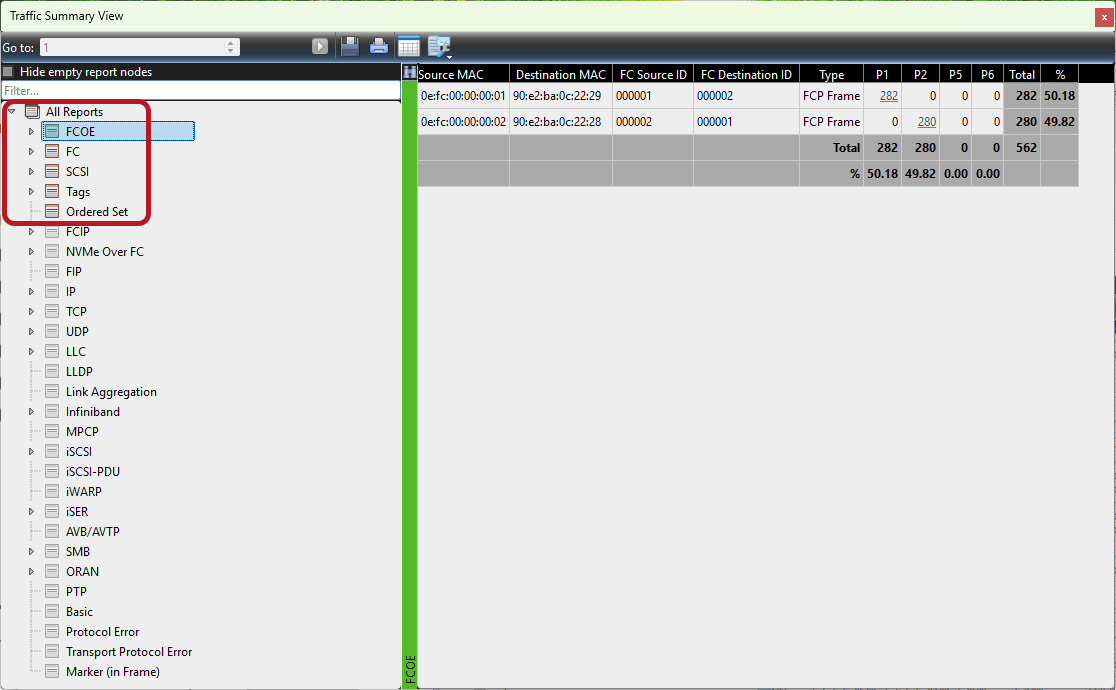
The Reports pane, at left, lists all available report types. Reports with values are sorted to the top of the column automatically, as shown in the red box below.
Traffic Summary Toolbar

The Traffic Summary Toolbar has the following options:
-
Go to: Instance Number
-
Save: Saves the Traffic Summary as an HTML file that can also be opened in Excel.
-
Print: Print Traffic Summary Report
-
Text: Re-Format Traffic Summary Report into readable text
-
Format:
-
Grid Lines: Toggle Grid Lines ON or OFF
-
Tight Columns: Toggle Tight Columns ON or OFF
-
View Ethernet and Fibre Channel Traces
The application captures and displays both Ethernet and Fibre Channel data. The screenshot below shows all available report categories.
Performance Metrics
-
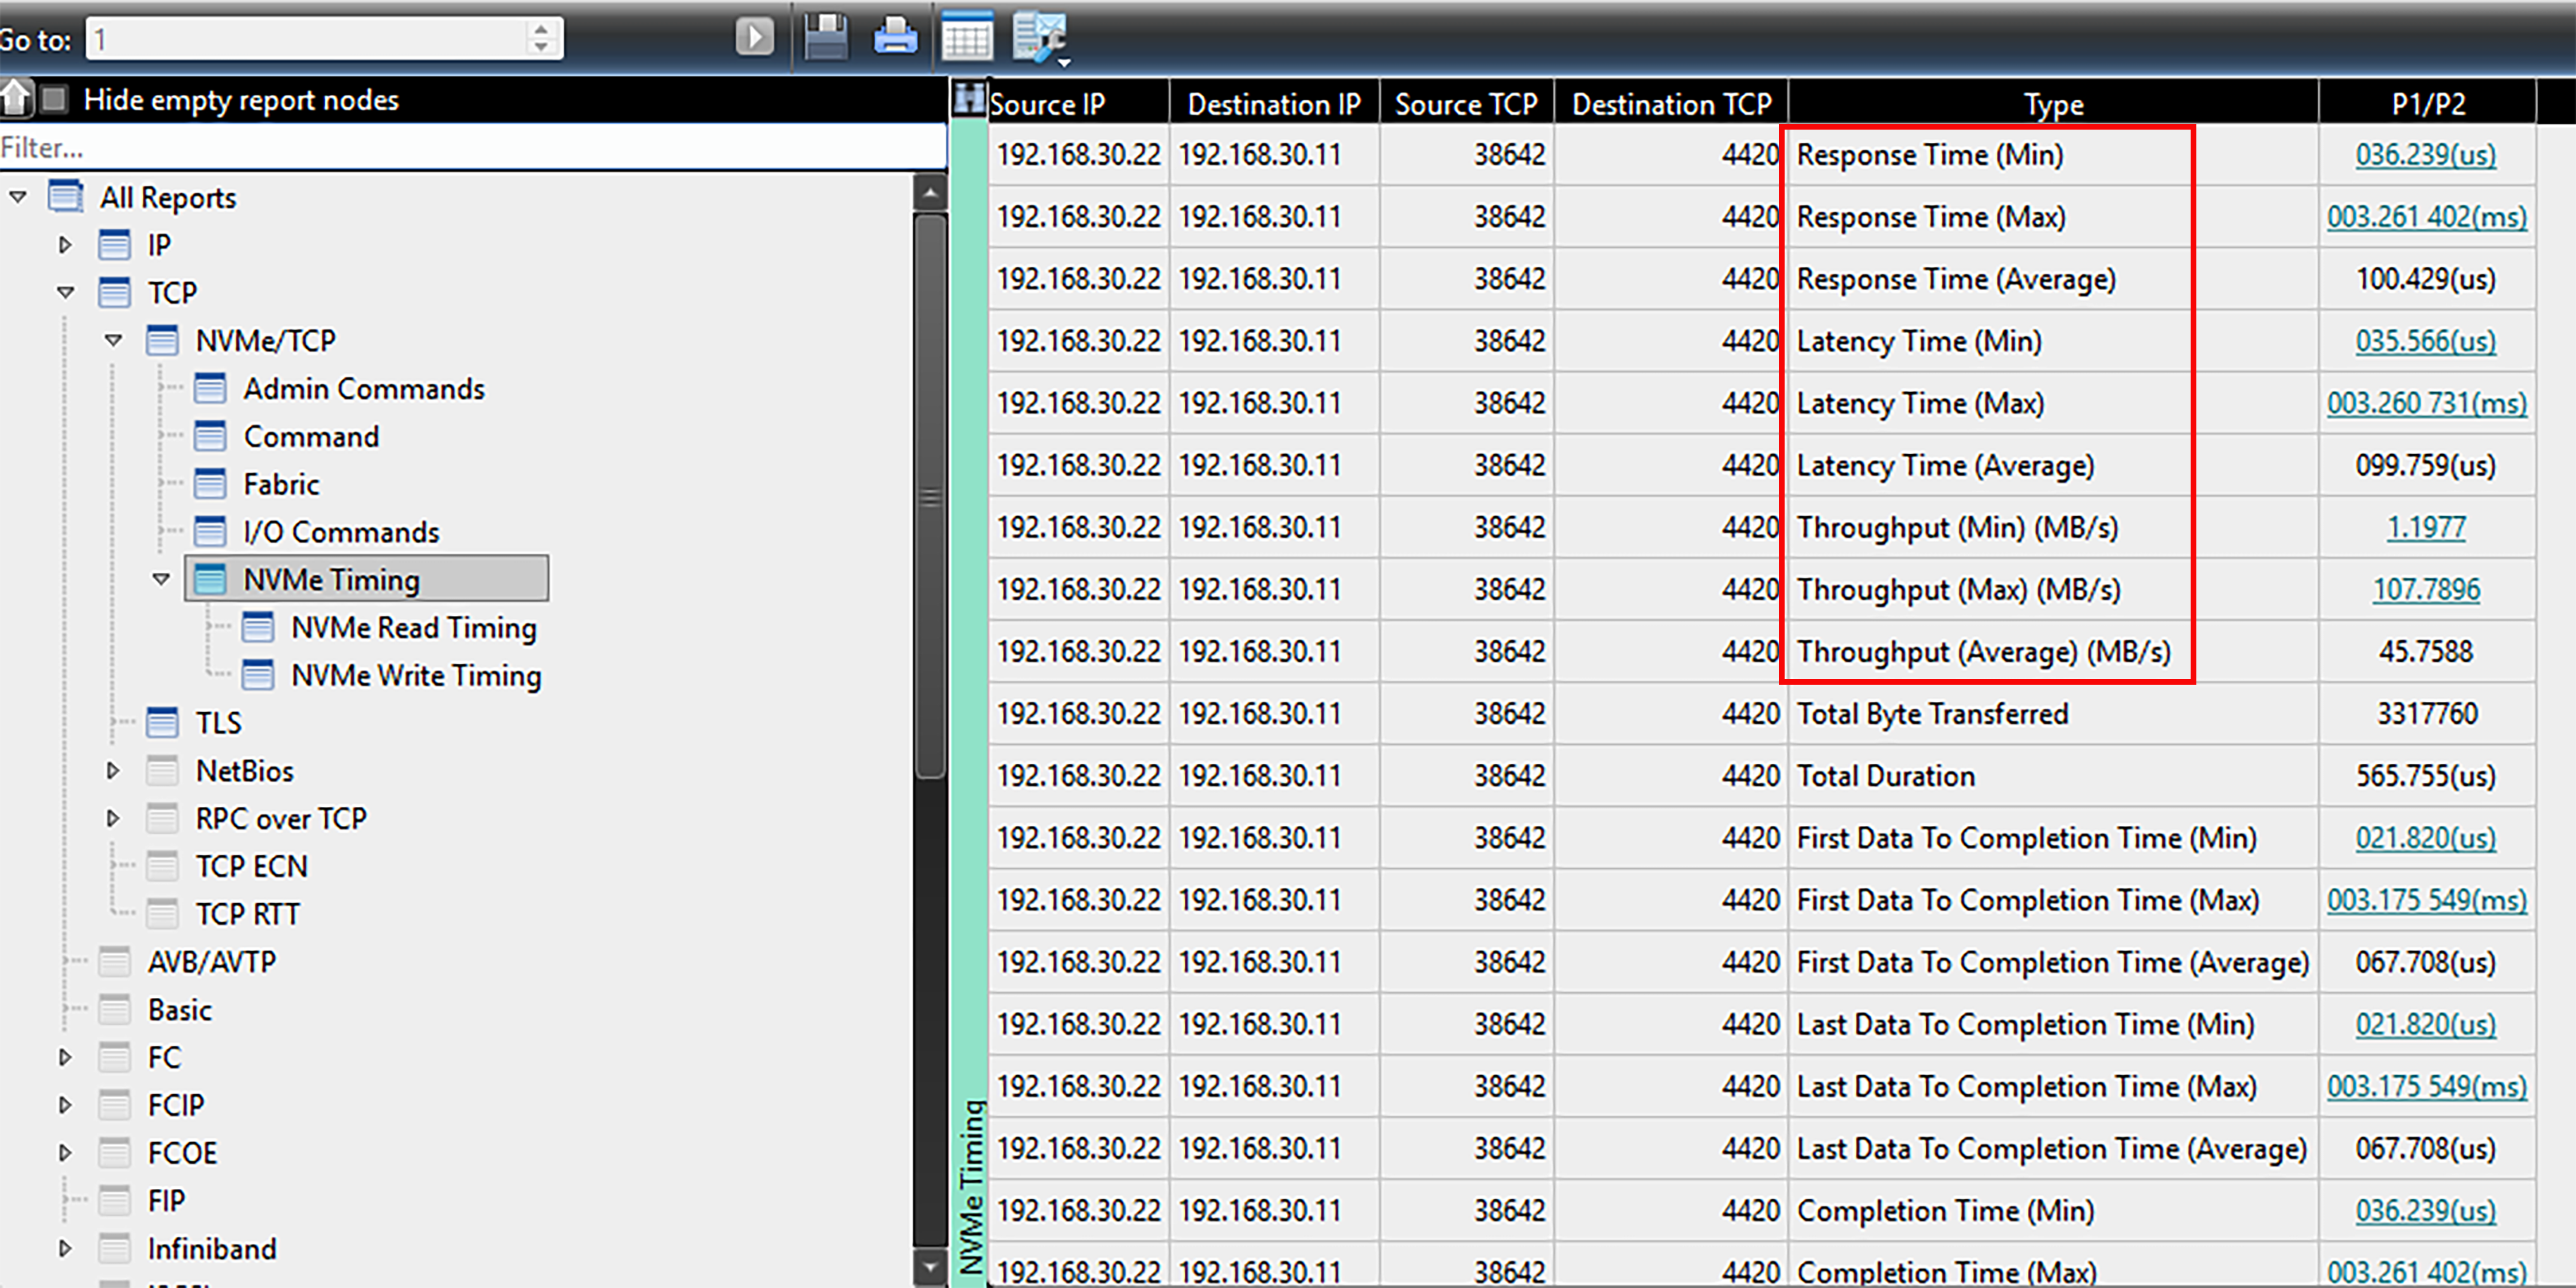
Latency: The time between the first frame of the exchange and the last frame of the exchange.
-
This value is valid for first frame of an exchange; it is not applicable for other frames of the exchange.
-
The latency time of an exchange is expressed in nanoseconds.
-
-
Response Time: Time between the command and response in an exchange.
-
Specifies the response time of an exchange in nanoseconds
-
Applicable for the first frame of each exchange; null (0) for other frames of the exchange
-
-
Throughput: The total number of transferred bytes of an exchange divided by the duration of the exchange. In MB/s.
Search Capability
The Traffic Summary View highlights the types of transactions present in the currently loaded Trace. It has a Reports Filter Window in the left pane of the dialog and a Find Tool Filter Window in the right pane of the dialog to help searching for specific commands.
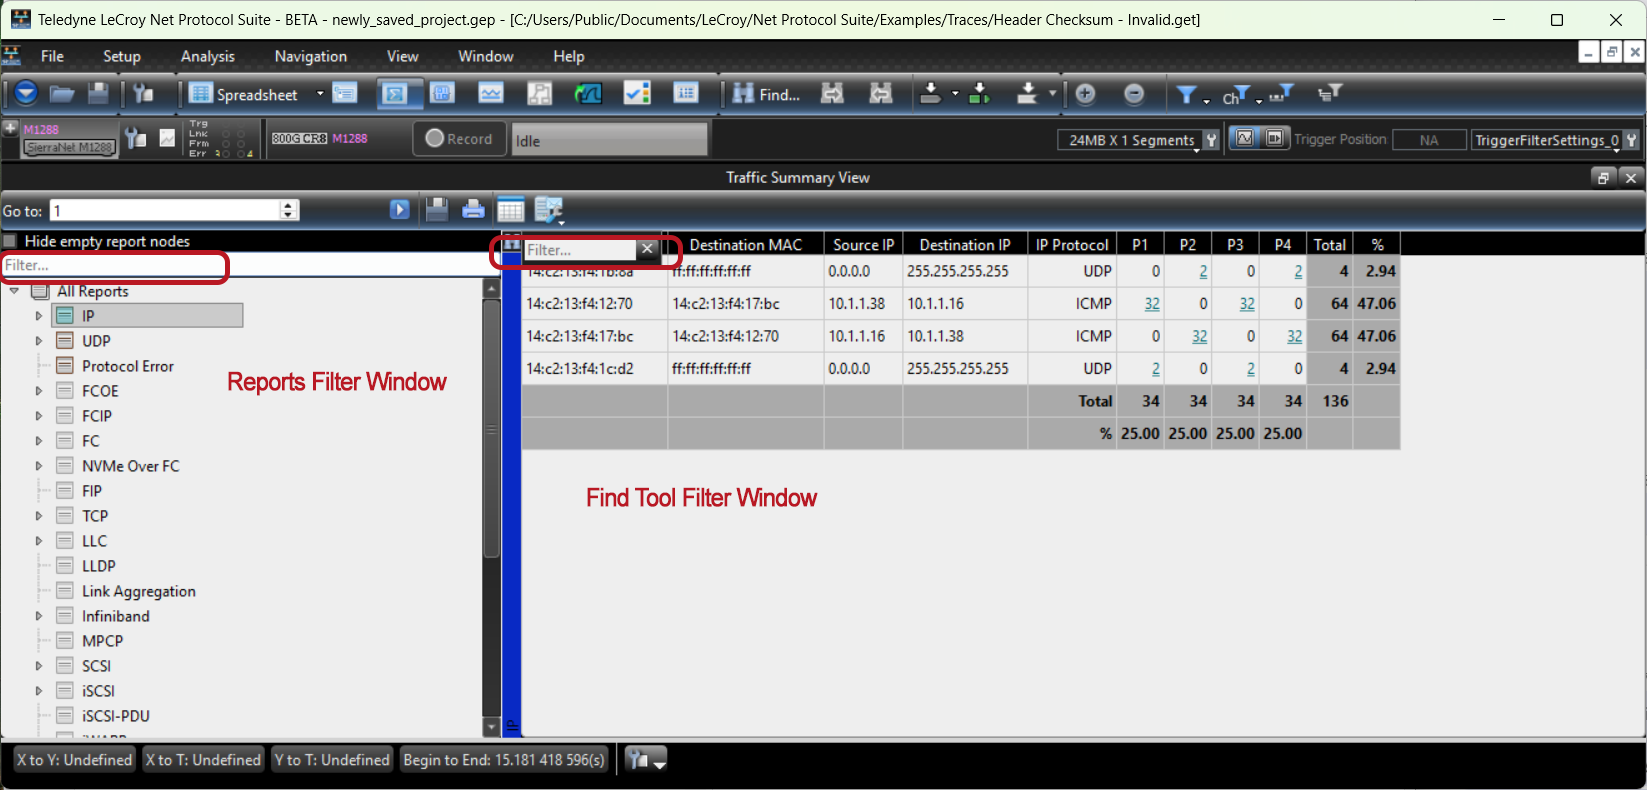
The following examples show specific commands within specific types of transactions. These are just a few examples of the types of transaction reports available in the Traffic Summary view.
FCOE Reports
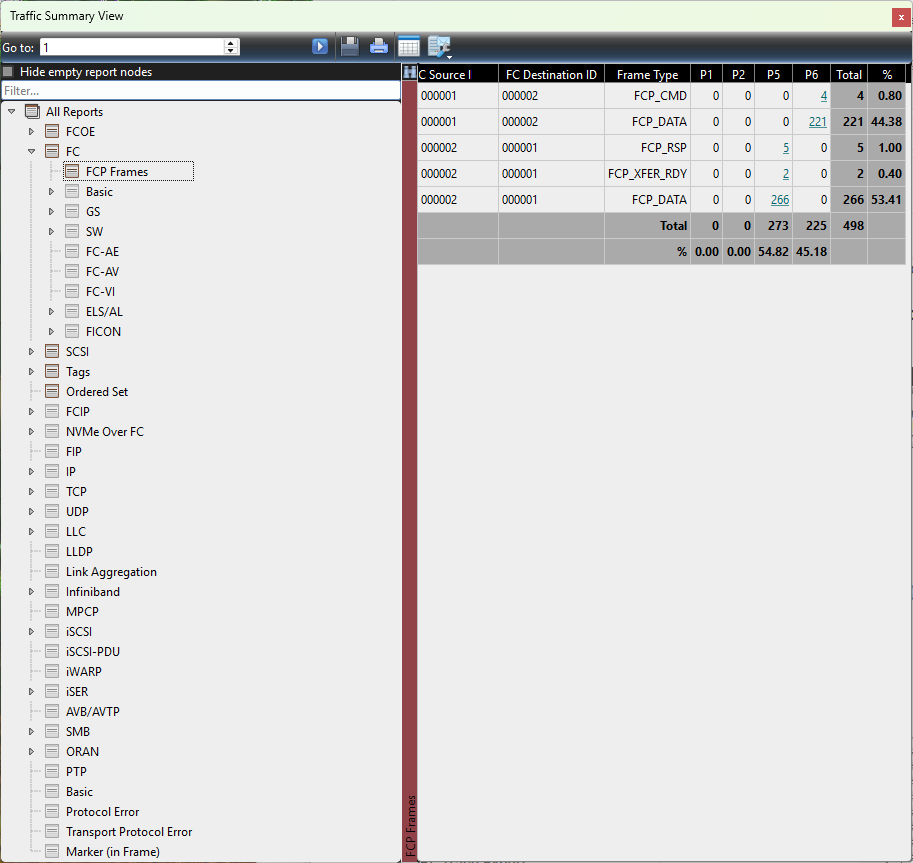
If you select FCOE Reports > FCP Frames, those types of transactions show up in the right side window.
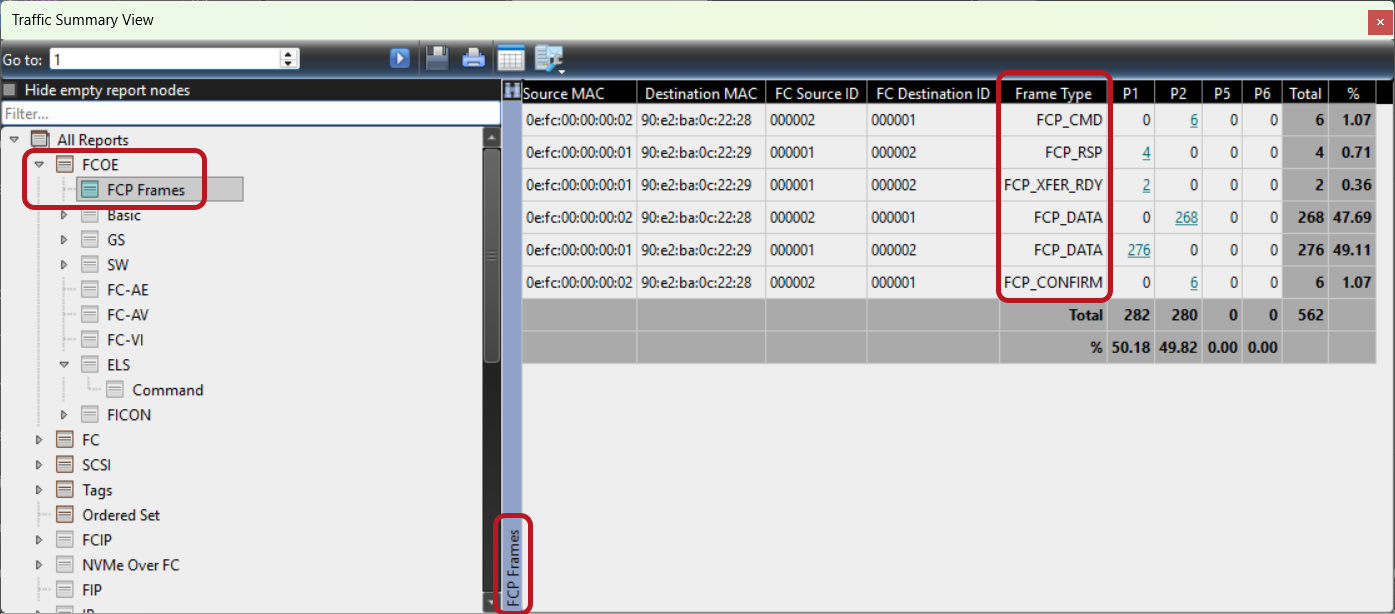
You can use the Find tool to look for a specific Frame type.
FC Reports
If you select FC > ELS/AL > Commands those types of transactions show up in the right side window.
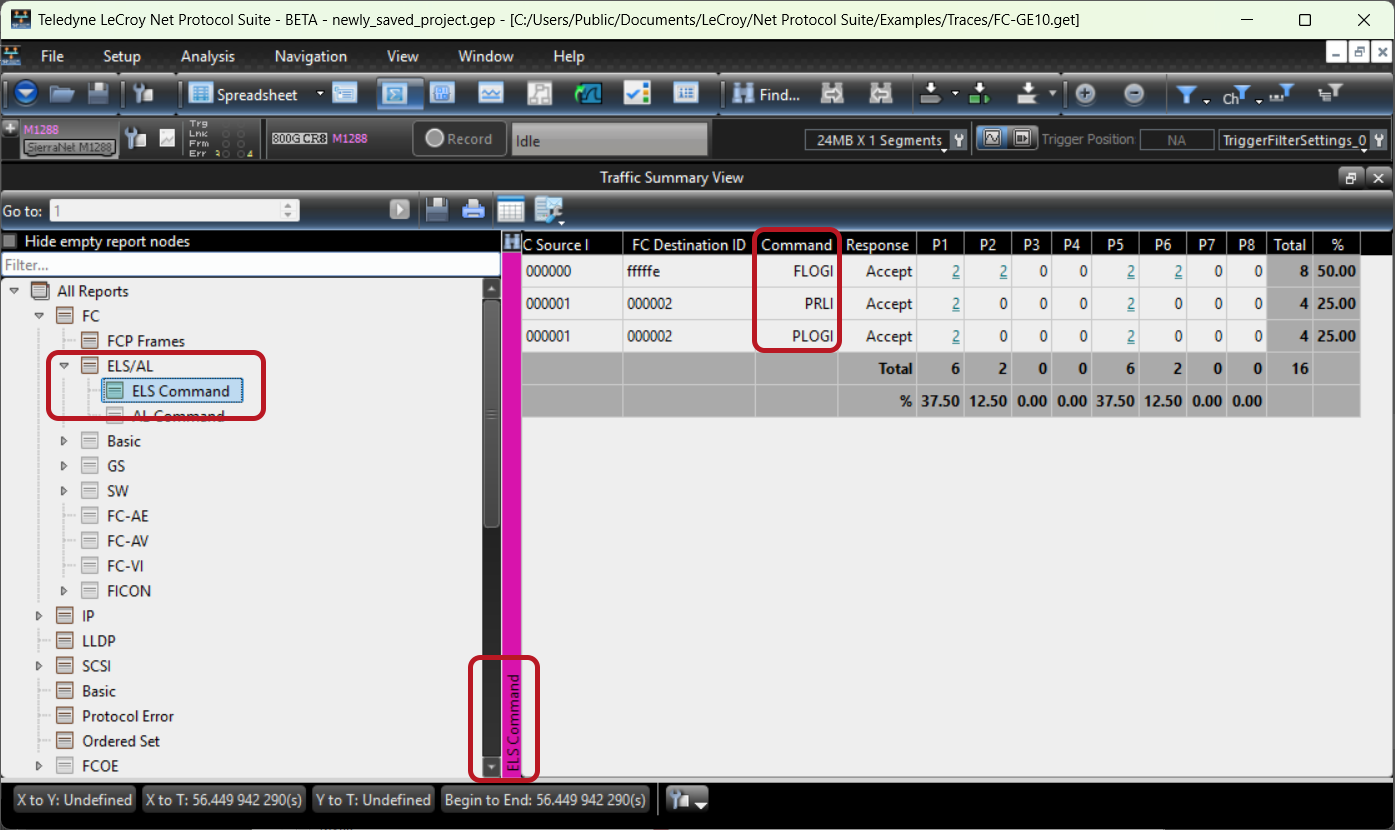
You can use the Find tool to look for a specific command type.
NVMe Traffic Summary Reports
NVMe traffic can be decoded and displayed in the Traffic Summary window.
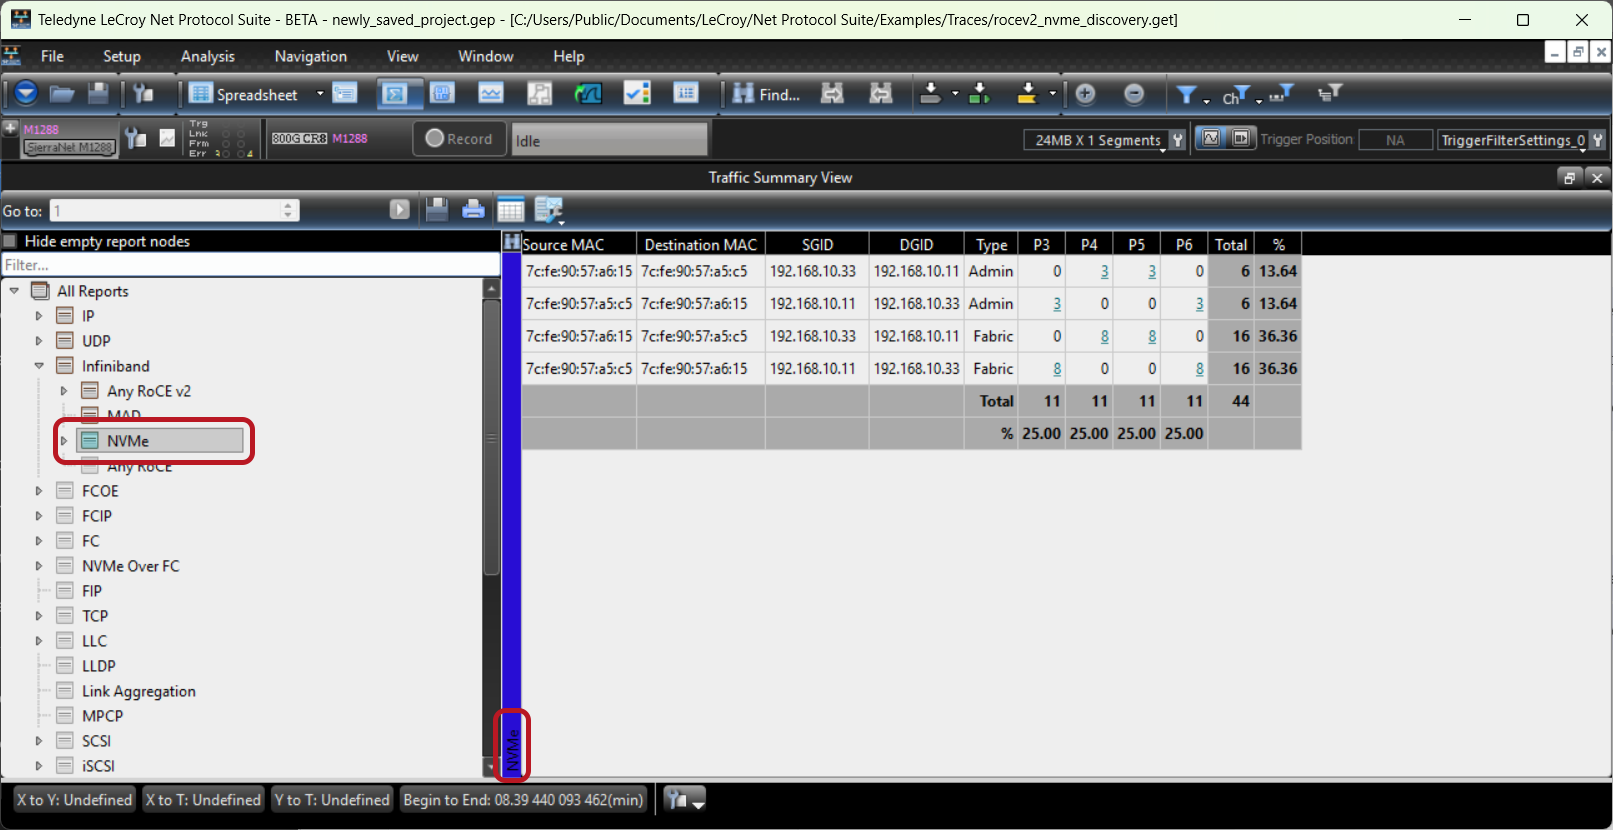
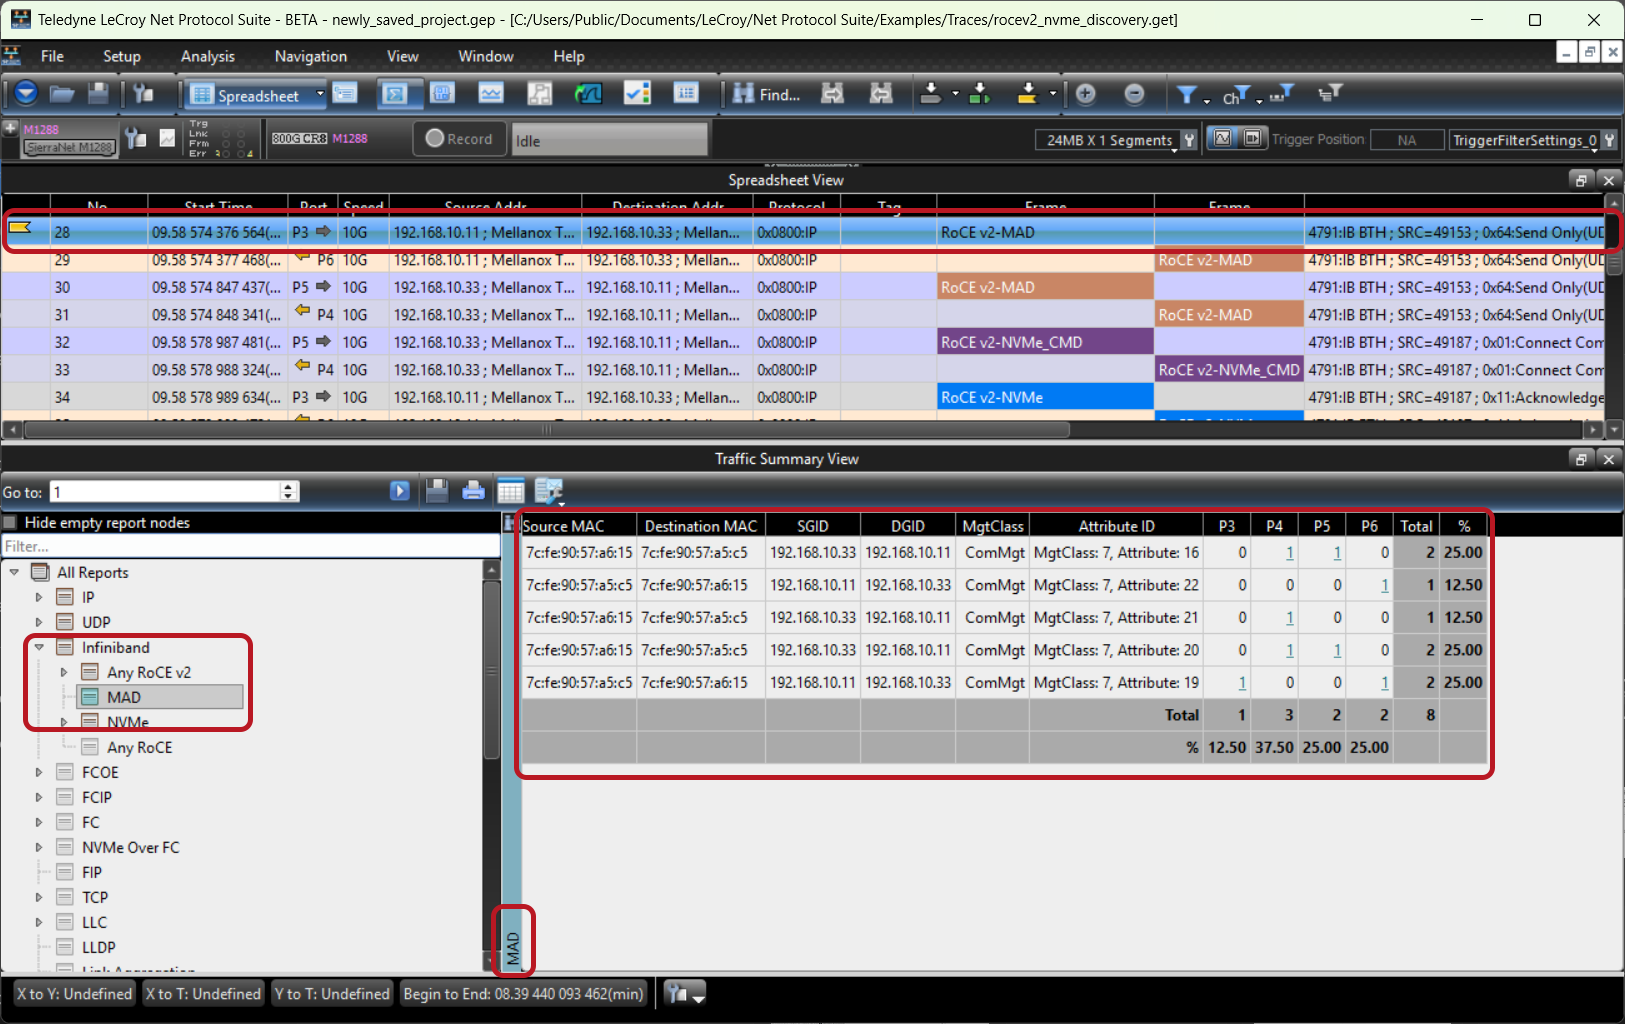
MAD Header Decoded: Traffic Summary View
Another example of the Traffic Summary View is shown below with an MAD header decoded.
Source and Destination Columns
Traffic Summary displays Source and Destination addresses.

Text Reports
Click the Text button 
MAD Header Decoded: Text Report
This example shows the Traffic Summary for a MAD traffic trace viewed as text.