
Zoom In
Clicking on the 
Zoom Out
Clicking on the 
Enable Hide/Show (Filter Events)
The Enable Hide/Show icon 
To set up filtering, you must have a viewer display open.
Filter Setup
To display the Quick Filter dialog, click the drop-down arrow 

You can use the Quick Search and Filter dialog on a Frame by right-clicking on it in the trace and selecting Quick Search. Select a field to filter/search for. Click in between the two lines in the center to display logical operators to select from the drop-down list.

Click the Advanced button in the Quick Filter dialog to display the Advanced Filter dialog.
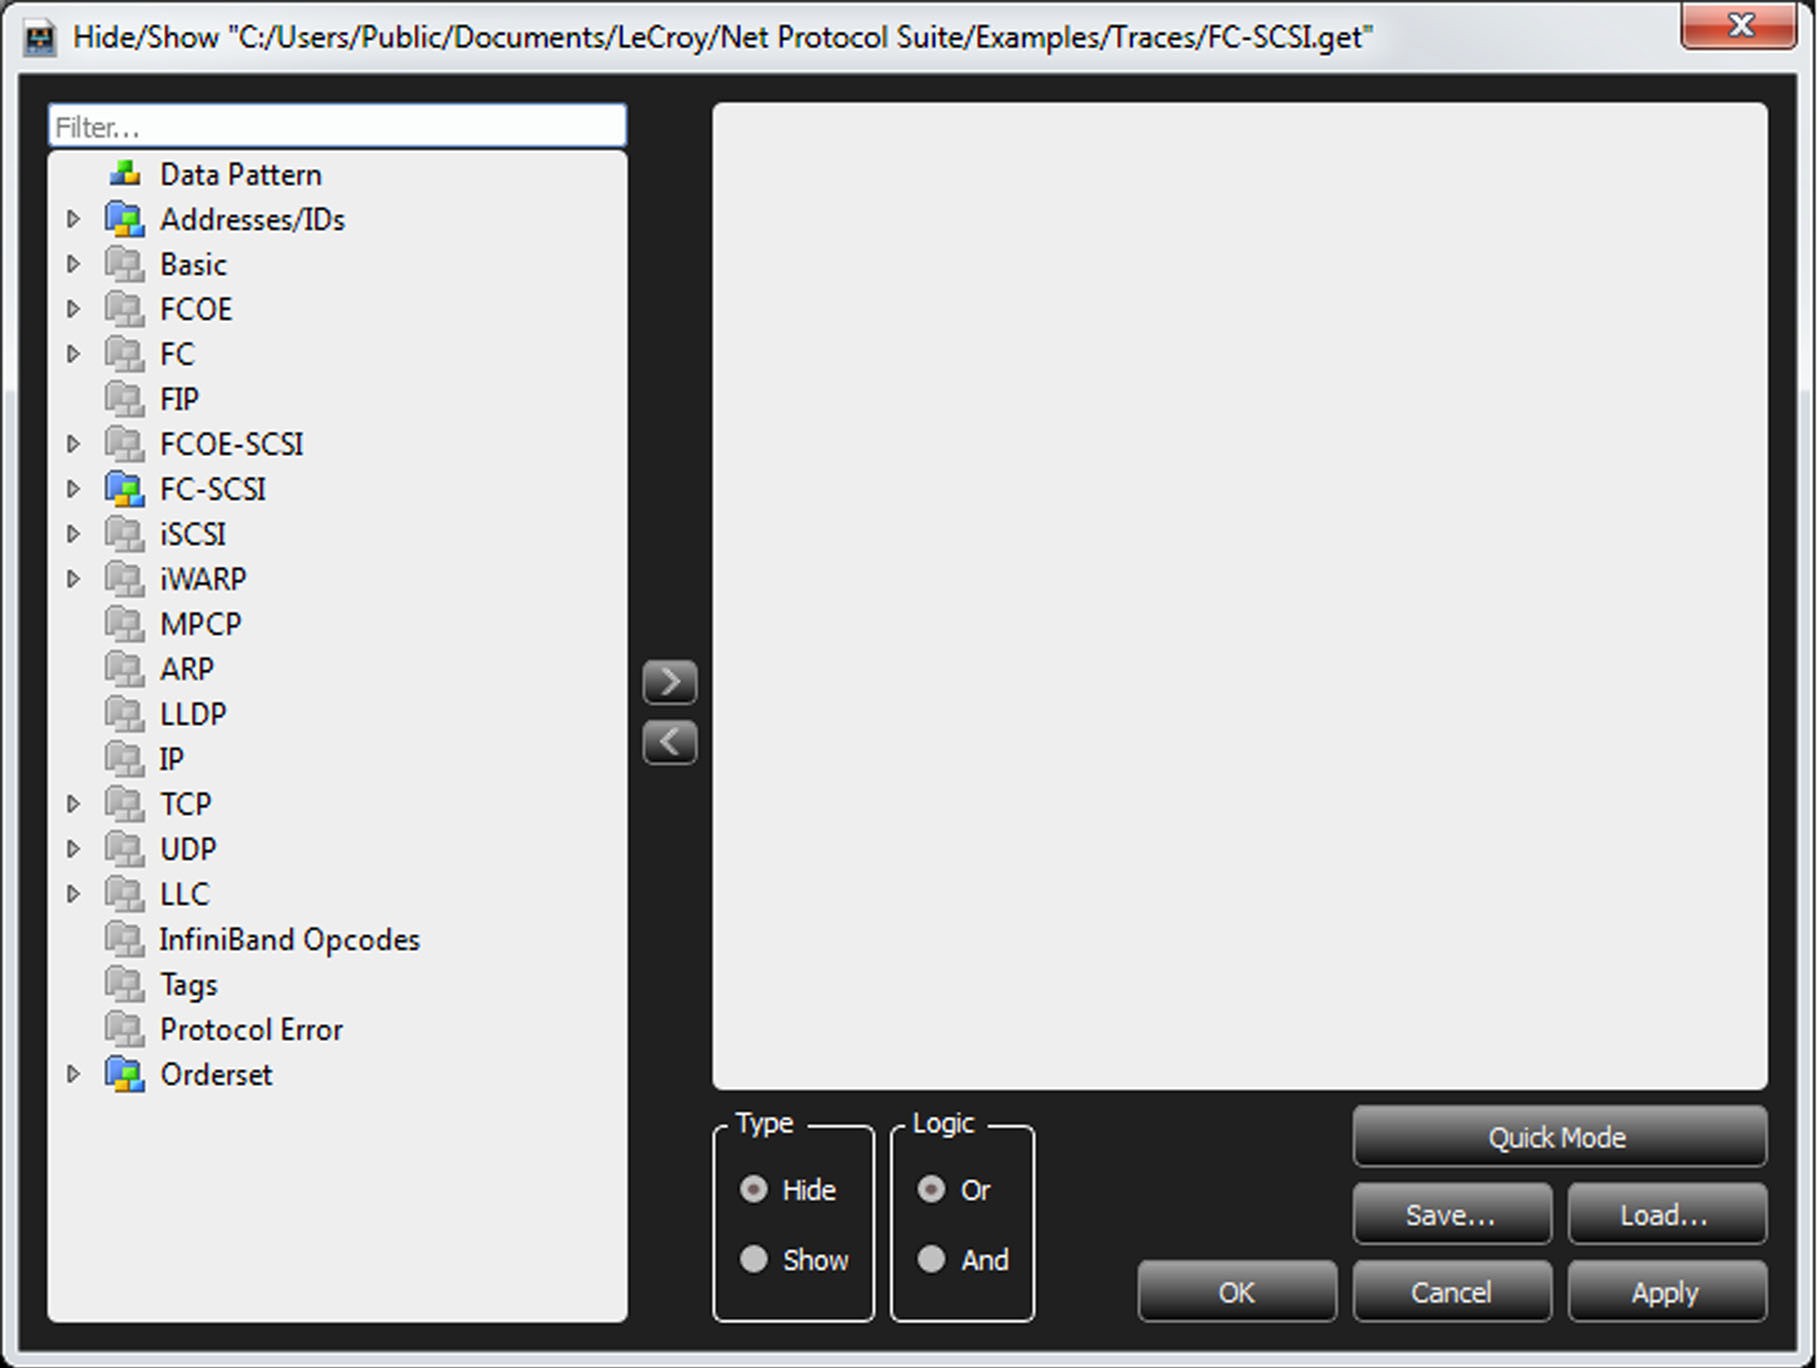
You can select or deselect each of the items shown in the left pane for filtering. Items not in the current trace are grayed out.
Note: If you select a group, that also selects all child items.
-
Only events captured at run time are available for selection for filtering.
Filter Type: You can choose to show or hide the Filter Type items by checking the Show or Hide option button.
Filter Logic: After you have set up Filter options, you can set filter logic to And to apply “AND” logic on related selected options or OR to apply “OR” logic on all selected options.
Save Filter: After you have set up a Filter configuration, you can save it as a Filter file by clicking Save.
Load: Click to use a previously saved filter.
Apply: Click to apply the current filter.
Filtering LUNs and LBAs
Perform the following steps to filter for LUNs and LBAs:
-
Click the drop-down arrow of the Enable Hide/Show button

-
Click Advanced to display the Hide/Show dialog.
-
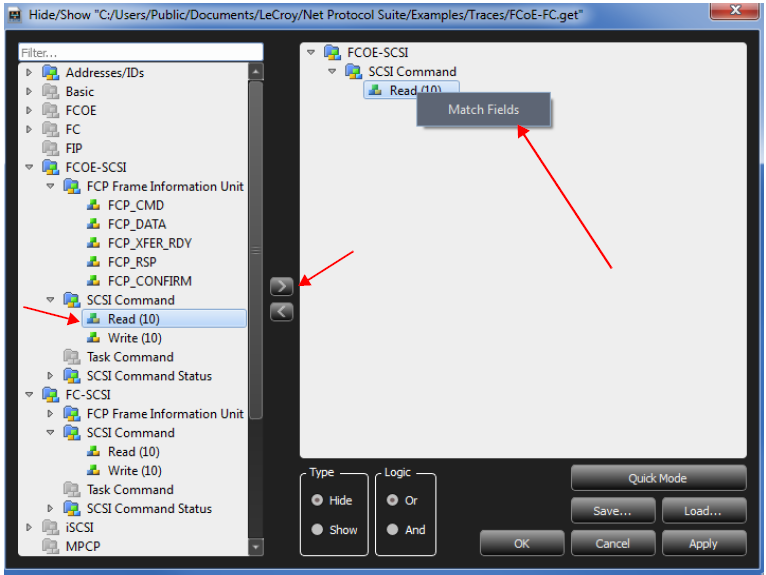
Select FCP_CMD in the left pane and drag it in to the right pane or click the right arrow.
-
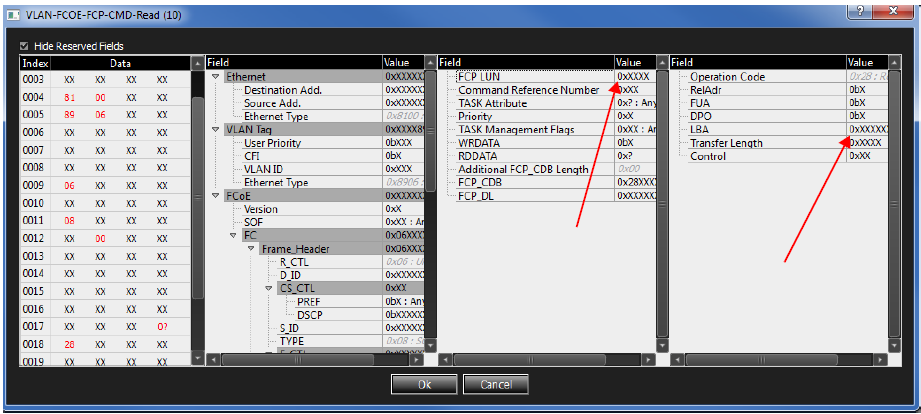
Select the command, double-click or right-click, and select Match Fields. The following filter dialog appears.
-
Enter the values in the field.
-
Click OK twice.
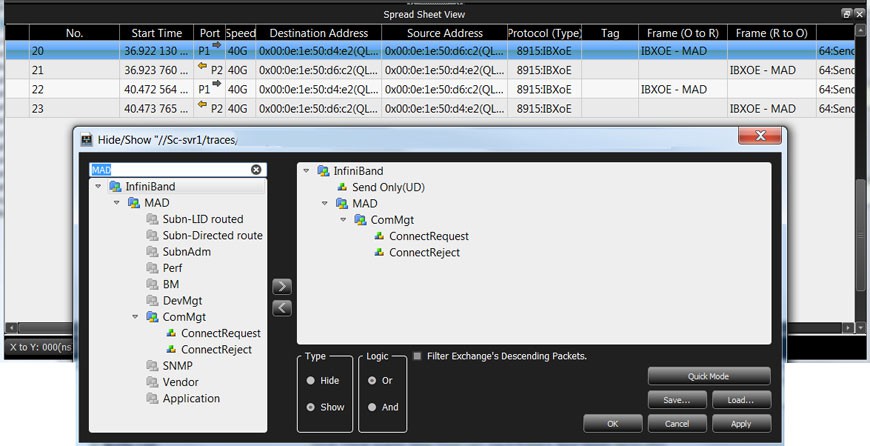
Filter MAD Headers
Another use of Filters is to find Decoded MAD Headers.
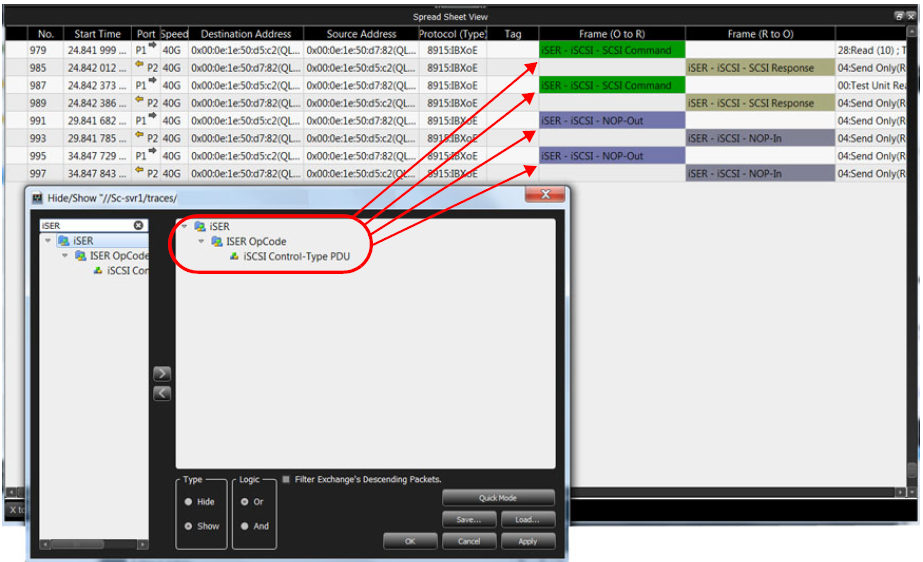
Filter iSER Header
The Filter function can also be used to find Decoded iSER Headers.
Ports
All active ports are highlighted on the Show/Hide Ports toolbar. Click the Ports 

Show/Hide Non-Frames
You can show or hide Non-Frames by clicking the 
Toolbars
Enabling Toolbars
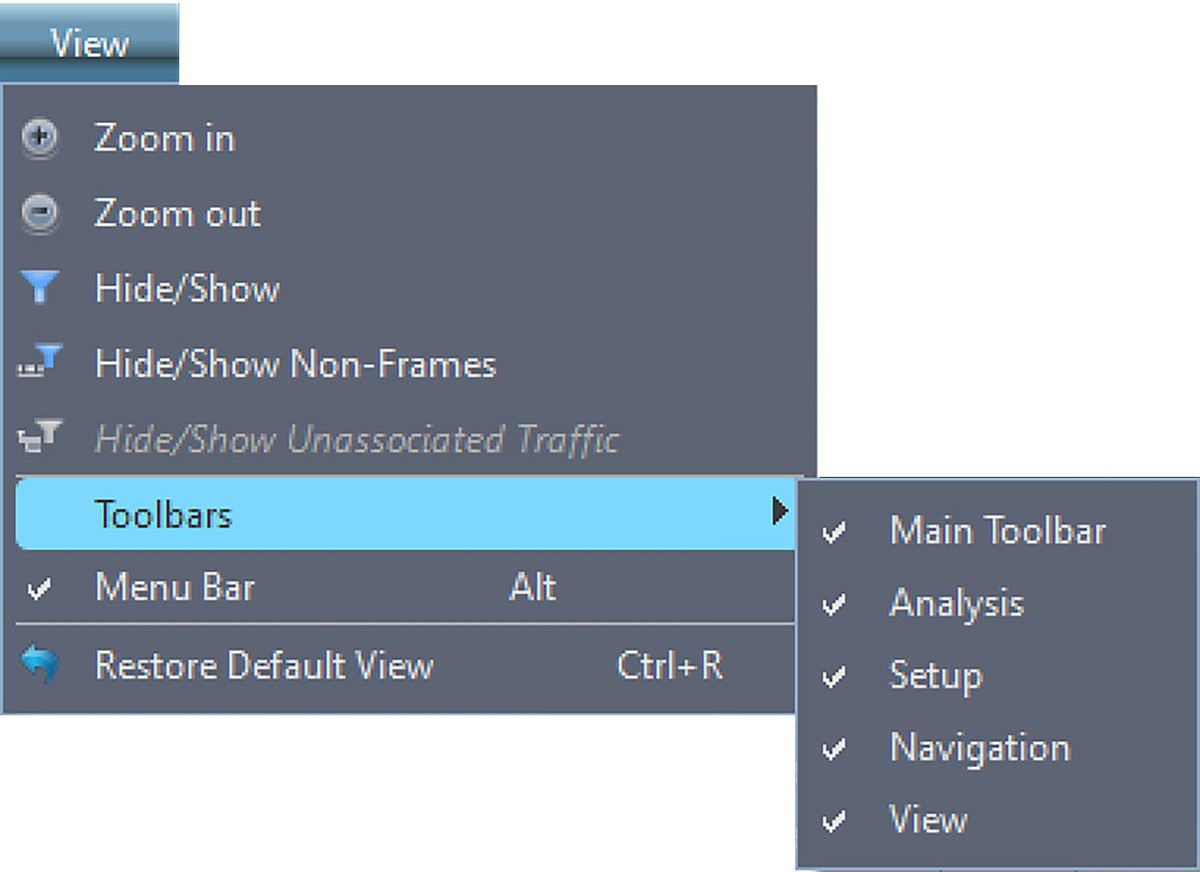
You can enable and reposition the available toolbars to customize the Viewer Display workspace. To display or hide toolbars, select View > Toolbars, then check or uncheck toolbars.
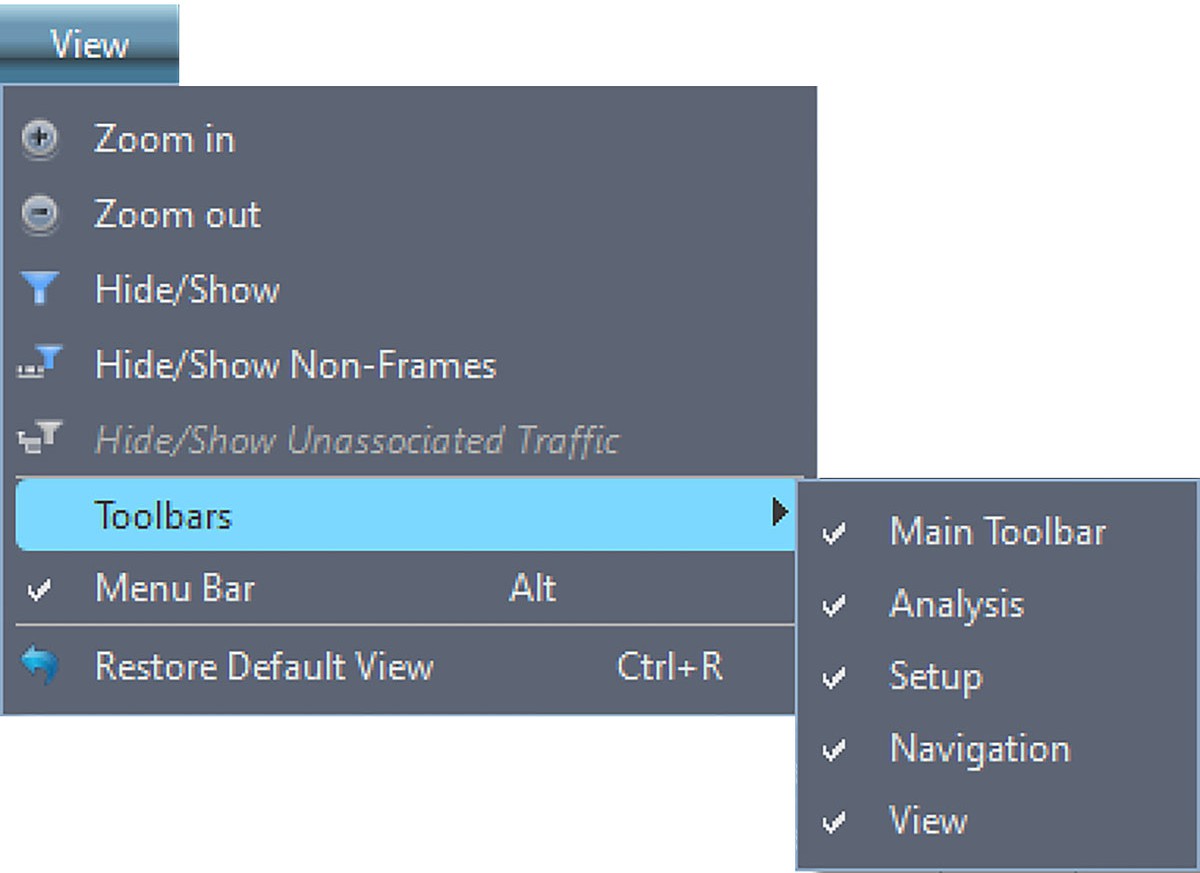
Available toolbars are:
-
Main Toolbar
-
Analysis
-
Setup
-
Navigation
-
View
Once enabled, the toolbars can dock at the Viewer Display window or float on the windows desktop.
Main Toolbar
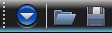
The Main or standard toolbar has the Hide Menubar, File Open and File Save. See Toolbar Options for more information.
Analysis Toolbar
The Analysis toolbar displays various views. See Switching Analysis Views for more information.

Navigation Toolbar
The Navigation toolbar allows searching, filtering, collapsing/expanding, and data reporting. See Navigation Toolbar Icons for more information.

View Toolbar
The View toolbar allows wrapping, zooming, and configuration. See View Menu for more information.
Setup Toolbar
The Setup toolbar is used to set preferences.
Restore Default View
If you added a number of different views and the screen has become cluttered, you can select View > Restore Default View to declutter the display.
Status Bar
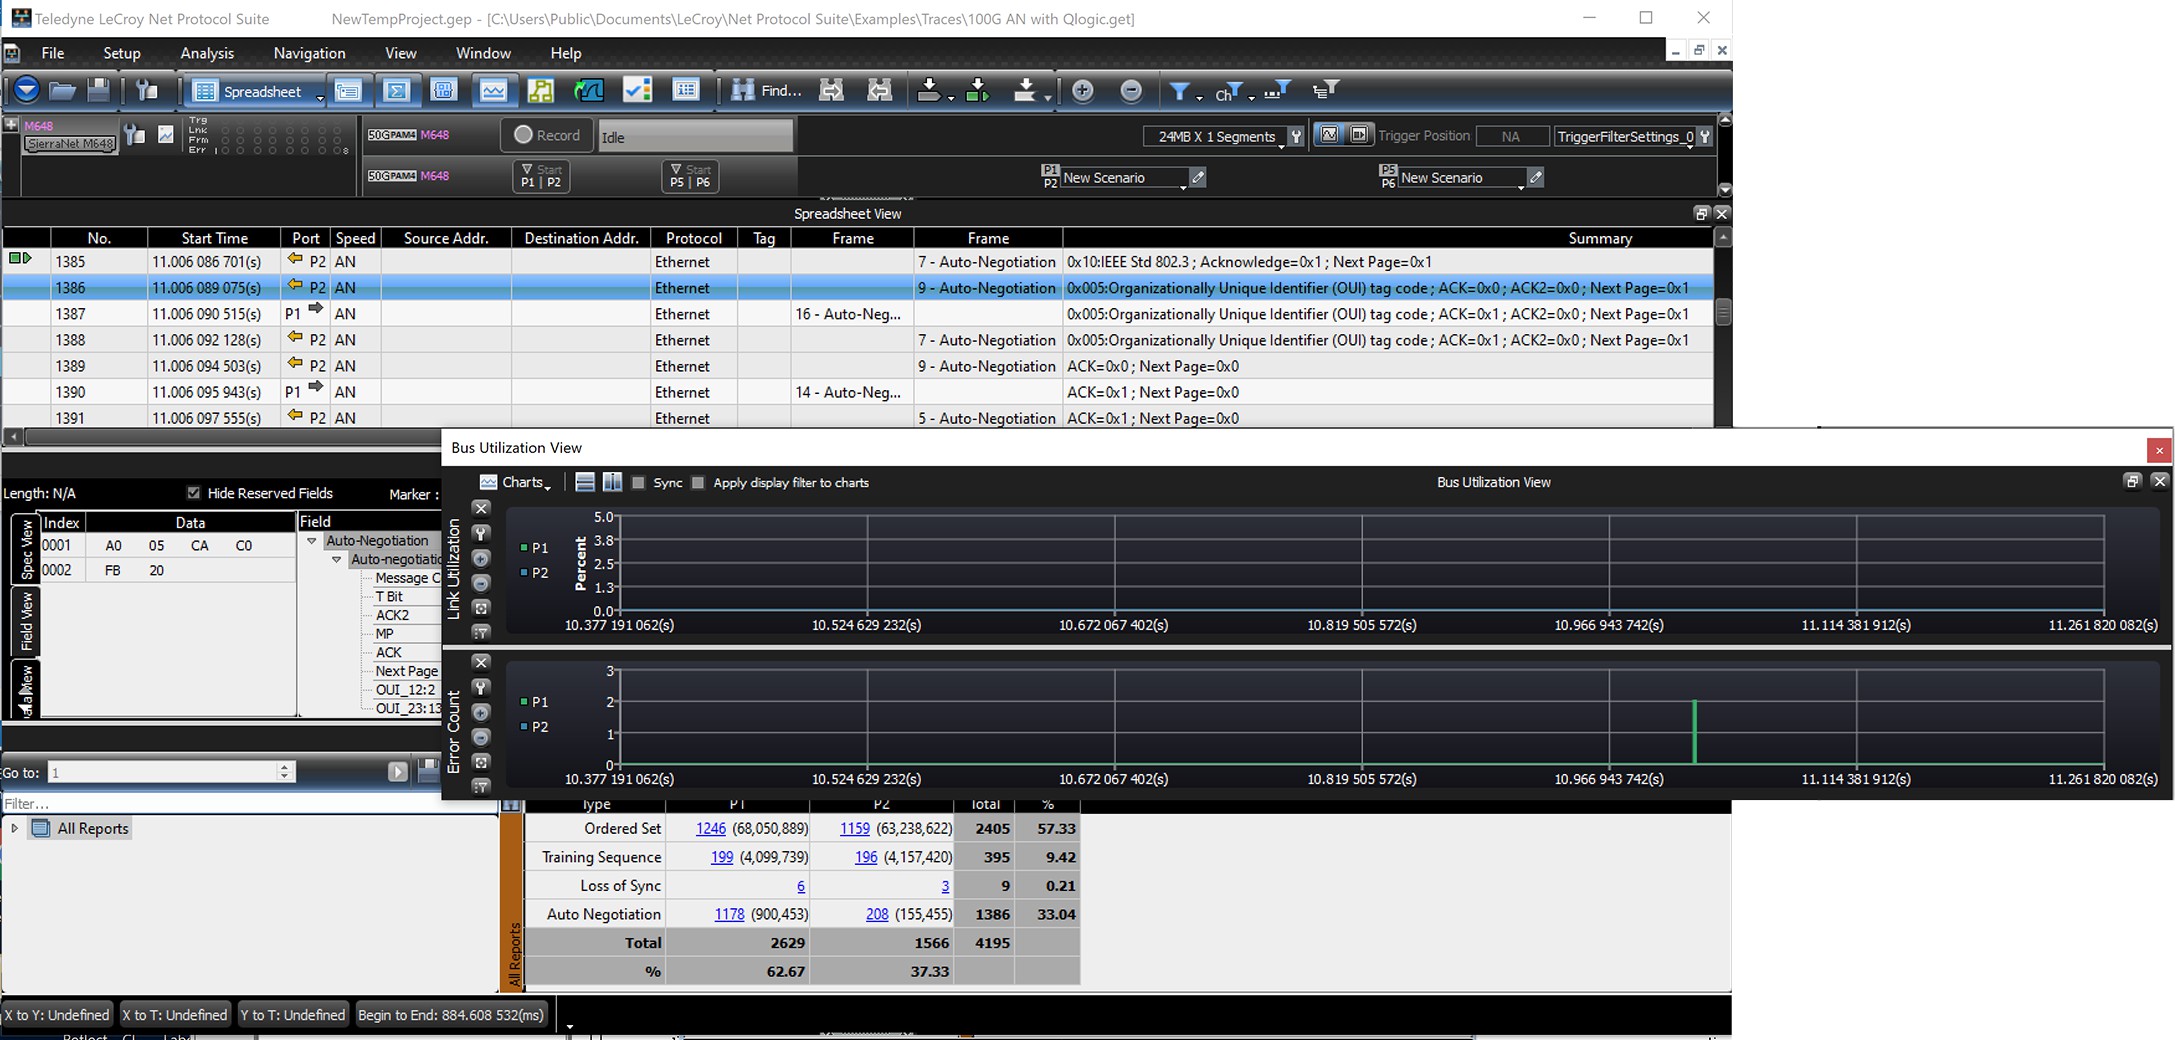
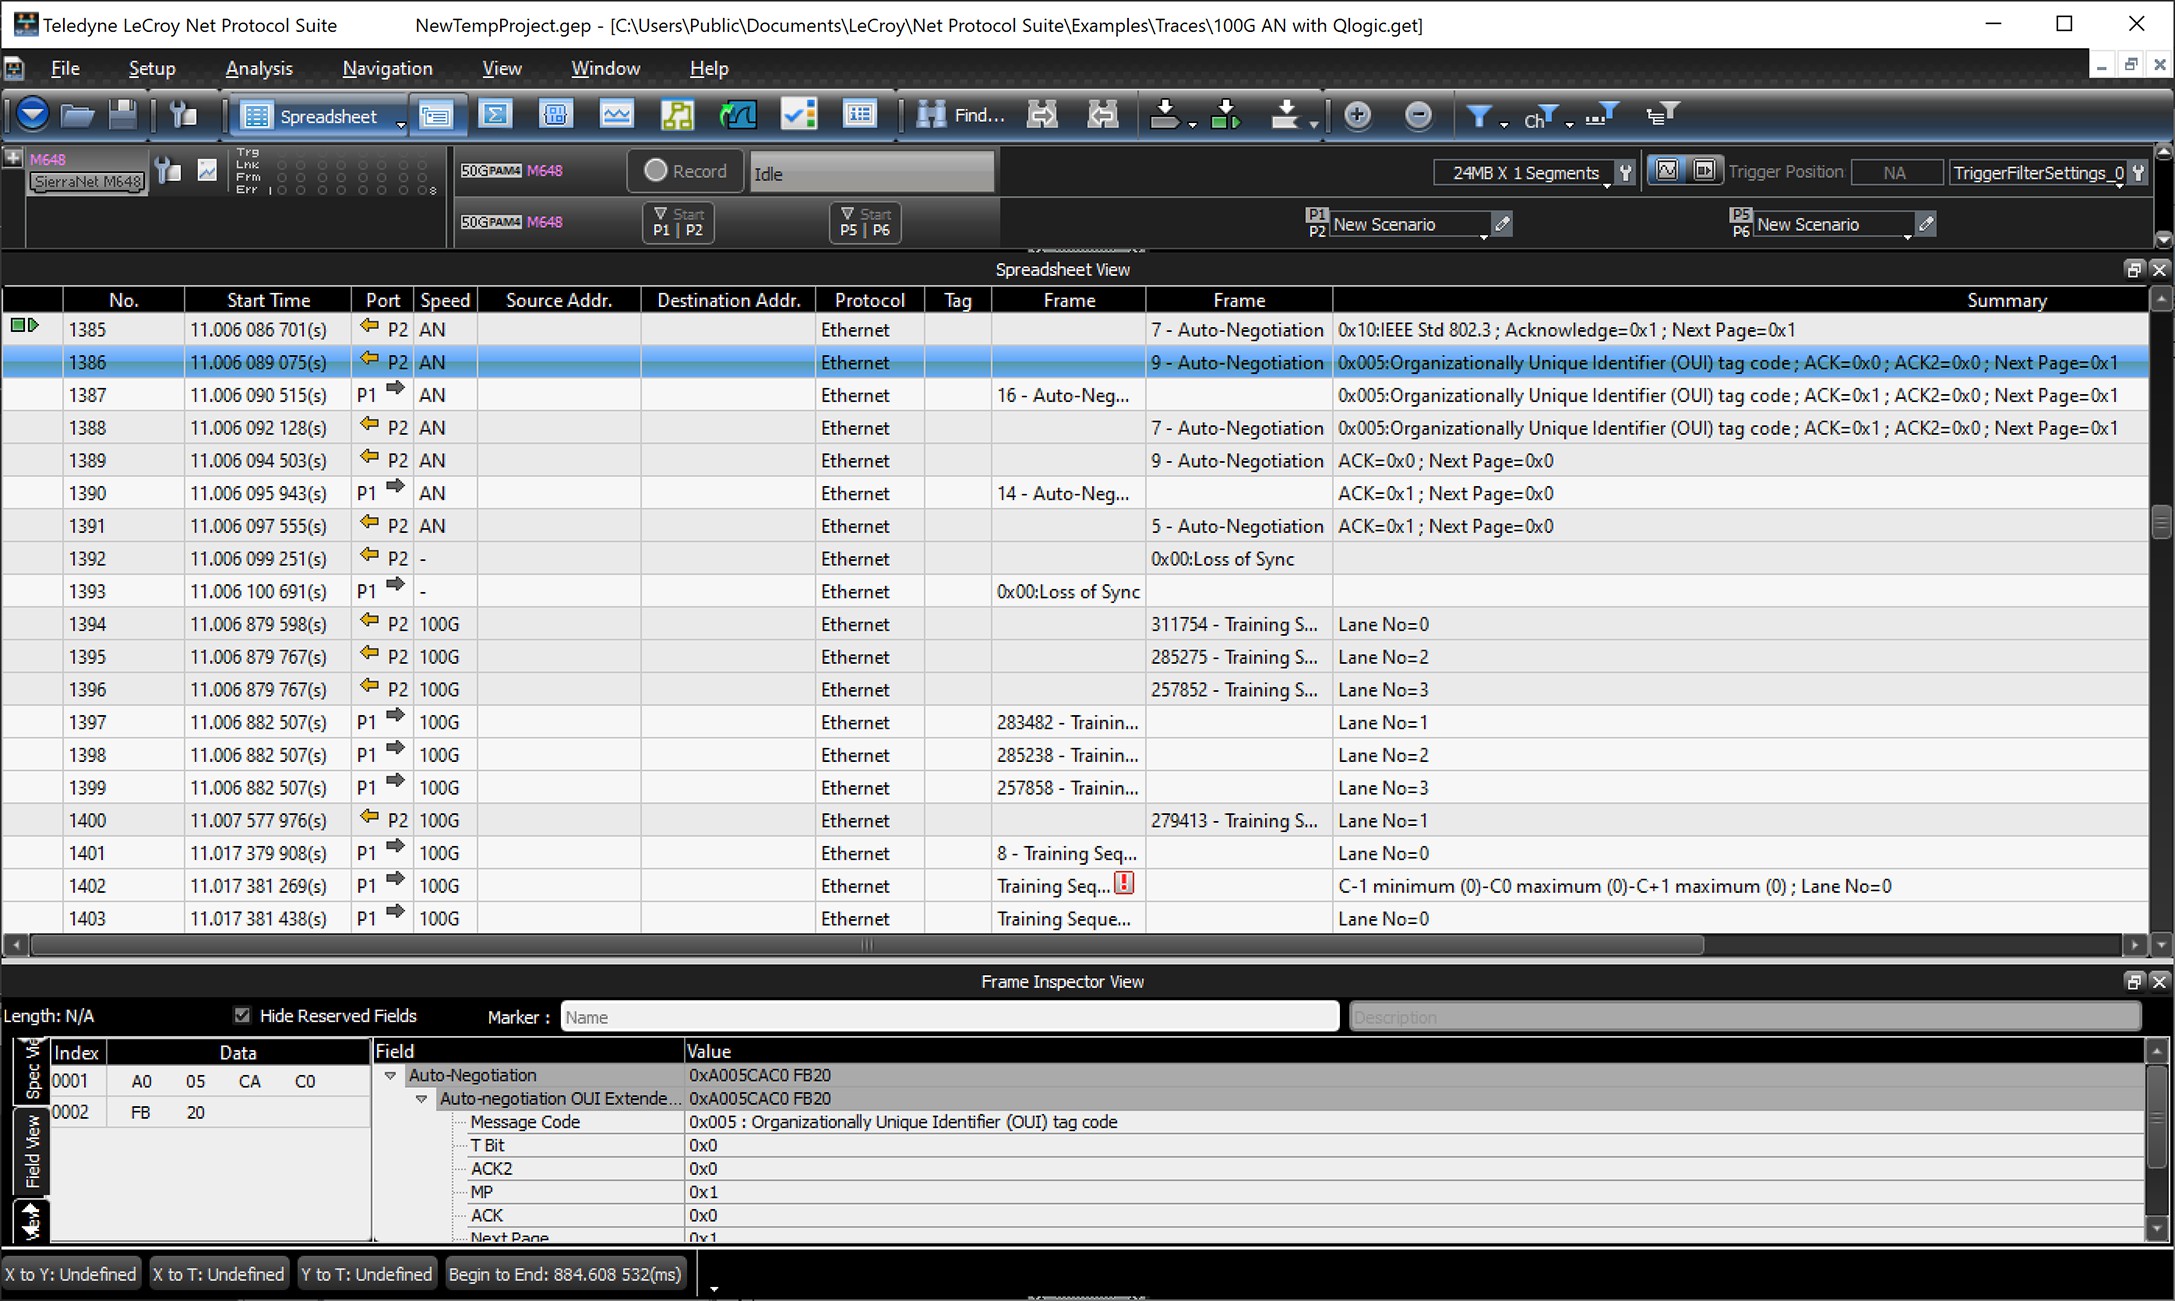
The Status bar is located at the bottom left of the main display window. Depending on the current activity, the bar can be divided into as many as four segments.
