
This section describes the menus and their functions.
File Menu
|
Option |
Function |
|
New .utg file. |
Creates a new, empty traffic generation file. Available only if a trace file (.usb) is open. To edit a .utg file, click Edit as Text in the toolbar. |
|
Open |
Opens a file. |
|
Open Examples Folder |
Opens a folder containing example traces and scripts. |
|
Close |
Closes the current file. |
|
Save As |
Saves all, or a range of, packets from the current file. |
|
|
Prints part or all of the current traffic data file. |
|
Print Preview |
Produces an on-screen preview before printing. |
|
Print Setup |
Sets the options for the current or new printer. |
|
Edit as Text |
Opens the Script Editor. Available only when a traffic generation file (.utg) is open. See Edit a Generation File. |
|
Edit Comment |
Creates or edits the Trace file comment field. See Edit Comment. |
|
Check Syntax of .utg file |
Reads open .utg file and checks syntax for errors. Available only when a traffic generation file (.utg) is open. |
|
Export >> Packets to Text (Packet View Format) |
Saves all or part of a trace to a text file or generator file. Saves trace as a text file in Packet View Format. |
|
Packets / Transaction /Spreadsheet to .CSV |
Saves trace as a comma-separated-values text file for use with Microsoft® Excel. See Exports to .CSV. |
|
Packets to USB 2.0 Host Traffic Generator Text File (.utg) |
Saves trace as a script file that can be used by a Generator to generate a trace. See Exporting Packets to USB 2.0 Host Traffic Generator Text File (.utg files). |
|
Packets to USB 2.0 Device Emulation Traffic Generation Text File (.utg) |
Exports packets to Device Emulation files. This option does not export transactions. See Exporting Packets to USB 2.0 Host Traffic Generator Text File (.utg files). |
|
USB4 Tunneled PCIe Traffic to PCIe Protocol Suite Trace File (.pex) |
Exports USB4 Tunneled USB traffic to PCIe Protocol Suite Trace File (.pex). This allows you to export ONLY PCIe Protocol SuiteTraffic from a USB4 trace. See Export USB4 Tunneled PCIe Traffic to PCIe Protocol Suite Trace File. |
|
USB4 Tunneled USB Traffic to USB 3.2 Native Trace File (.usb) |
Exports USB4 Tunneled USB traffic to USB 3.2 Native Trace file. This allows you to export ONLY USB 3.2 Native Traffic from a USB4 trace. See Export USB4 Tunneled USB Traffic to USB 3.2 Native Trace. |
|
USB4 Tunneled DP Traffic to DP Native Trace File (.usb4dp) |
Exports USB4 Tunneled DP traffic to DP Native Trace file. This allows you to export ONLY DP Native Traffic from a USB4 trace. See Export USB4 Tunneled DP Traffic to DP Native Trace. |
|
Data |
Exports Transfer data as a text or binary file. |
|
Merge Trace Files |
Merges two simultaneously recorded files into a single file. (This command does not work if the files were recorded at different times). |
|
Compare Endpoint Data |
Allows you to select two endpoints of different directions with the same address and verify that the data OUT/IN is identical to the data IN/OUT from the other endpoint. Used when running echo-types of tests for data integrity. Available only when a trace file (.usb) is open. (2.0 only) |
|
Import |
If you have exported simulations to a defined .csv format, you can import data from the .csv file to a BusEngine™ data file. To use this feature, you must contact support for information on how to export to a specific-format .csv file and then import the file. You can also import SimPass USB files. NOTE: The format of .csv export files is NOT compatible with that of files to be used for these Import functions. The Import .csv file is based on symbol streams at the 10 bit symbol level. The exports are based on decoded delimited packet bytes. |
|
Clean Up Decoder Temp Files |
Intelligently cleans up temp files created during the decoder process. This will free up disk space, but make re-loading Trace files much slower, because they will have to be re-decoded. |
|
Exit |
Exits the program. |
Setup Menu
|
Option |
Function |
|
Display Options |
Provides display options such as color, formats, and filters. See Display Options. |
|
Recording Options |
Provides setup options for recording, triggering events and filtering. See Recording Options. |
|
Update Device |
Updates the BusEngine™ and Firmware manually. See Manual Updates to Firmware, BusEngine, and Serdes BusEngine. |
|
Launch CrossSync Control Panel |
Opens the CrossSync multiple-analyzer traffic synchronization software (see CrossSync Control Panel ). For more information, refer to the CrossSync User Manual. |
|
All Connected Devices |
Opens a dialog box with a list of analyzers connected to the host machine. Lets you select an analyzer and update the BusEngine, firmware, and licensing information. See Analyzer Devices Window. |
|
Signal parameters |
Adds, removes, edits, loads, and saves USB4 and USB3.2 devices and lists the device name, device cable, host name, host cable, and to what the Profile Signal Settings apply. Used to calibrate 5, 10, and 20 Gbps connections. Also shows custom device-to-analyzer and host-to-analyzer signal settings. See Signal Parameters. |
Generate Menu
|
Option |
Function |
|
(See Traffic Generation 2.0) |
|
|
Start/Stop |
Starts traffic generation. After traffic generation has begun, the Start command becomes Stop and lets you stop traffic generation. |
|
IntelliFrame Generation Mode |
Sets the mode of generation to IntelliFrame. Use before Start. (2.0 only) |
|
Bitstream Generation Mode |
Sets the mode of generation to bitstream. Use before Start. (2.0 only) |
|
Repeat Mode |
Allows you to repeat once, a specified number of times, or an infinite number of times using the Generation Repeat Mode window. (2.0 only) |
Record Menu
|
Option |
Function |
|
(See Recording Status) |
|
|
Start |
Causes the analyzer to begin recording USB activity. |
|
Stop |
Causes the analyzer to stop recording. |
|
VBUS Disconnect |
See VBUS Disconnect under Recording. |
|
Manual Trigger |
See Manual Trigger under Recording. |
|
Upload Again |
Allows you to upload a different portion of the captured trace if the previous upload was only partially uploaded. |
Report Menu
|
Option |
Function |
|
File Information |
Displays information about the recording, such as the number of packets and triggering setup. See Trace Information. |
|
Error Summary |
Summarizes the errors throughout the recording. Allows for fast navigation to packets with errors. See Error Summary. |
|
Timing Calculations |
Calculates timing between two packets and bus utilization. See Timing Calculations. |
|
Data View |
Shows packet information. See Data View. |
|
Traffic Summary Report |
Summarizes the numbers and types of errors, packets, transactions, split transactions, and transfers that occurred in the open trace. See Traffic Summary Report. |
|
Bus Utilization |
Displays graphs of packet length, bus usage, and bus usage by device. See Bus Utilization. |
|
Link Tracker |
Opens a window for displaying a detailed chronological view of traffic. The window provides view and navigation options. See Link Tracker. |
|
Navigator |
Allows you to view the location of errors and triggers in a trace, narrow the range of traffic on display, and jump to any point in the trace. See Using the Navigator. |
|
Detail View |
Displays details of selected packet. See Detail View. |
|
Spec View |
Shows packet header information and other items, in a view that matches the USB 3.2 specification. See Spec View. |
|
USB 3.2 Link State Timing View |
Graphically shows how much time the link spends in each link state. See USB 3.2 Link State Timing View. |
|
USB 3.2 LTSSM view |
Displays the LTSSM diagram depicted in the USB 3.2 specification. See USB 3.2 LTSSM View. |
|
USB4 Configuration Space View |
Displays the USB4 Configuration Space for routers and adapters as one table. See Open USB4 Configuration Space View. |
|
Power Tracker |
Displays voltage, current, and power. See Power Tracker—VBUS & Configuration Channel (CC). |
|
Decoded Fields View |
Displays the Decoded Fields View. See Decoded Fields View. |
|
Eye Diagram View |
Displays the “Eye” diagram for USB traffic. See Eye Diagram View. |
|
Run Verification Scripts |
Opens a window to allow you to run verification scripts over the open trace. See Running Verification Scripts. |
Search Menu
|
Option |
Function |
|
(See Searching Traces) |
|
|
Go to Trigger |
Positions the display to show the first packet that follows the trigger event. |
|
Go to Selected packet |
Positions the display to show the selected packet. |
|
Go to Packet/ Transaction/Transfer |
Positions the display to the packet/transaction/transfer number selected in the Go to Packet/Transaction/Transfer menu. |
|
Go to Marker |
Positions the display to the selected marked packet. |
|
Go to USB 2.0 |
Positions the display to the selected event, condition, value, or type. |
|
Go to USB 3.2 SS and SS+ |
Positions the display to the selected event, condition, value, or type. |
|
Go To Power Delivery/CC Event |
Searches for specific Power Delivery and Configuration Channel Messages. |
|
Go to Channel |
Positions the display at selected channel. Select from 0, 1, 2 and 3. |
|
Go to SCSI |
Positions the display to the selected SCSI Operation, Command Status, Task Management, Task Management Response, Error or SCSI Logical Unit Number. |
|
Go to Display Port |
Positions the display to the selected Display Port Packets, Transaction Type or Transfer Type |
|
Go to USB4 SB |
Positions the display to the selected SideBand Transaction Type: AT, RT, LT or Raw |
|
Go to USB4 Rx/Tx |
Positions the display to the selected Ordered Set, Control Packets, Line Management Packets, Time Sync Packets, Tunneled Packets or Unidentified Symbol Sequence (USS) |
|
Find |
Allows complex searches on multiple criteria. See Find Functionality. |
|
Find Next |
Repeats the previous Find operation. |
|
Toggle Search Direction |
Allows the search direction to be changed from Forward to Backward, or vice versa. The current Search Direction can be found in the lower right hand corner of the Application, in the Status Bar. |
View Menu
|
Option |
Function |
|
Toolbars |
Displays list of available toolbars. See Resetting the Toolbar. |
|
Status Bar |
Switches display of the Status Bar on or off. See Status Bar. |
|
QuickTiming Bar |
Quick Timing provides immediate time deltas and bandwidth calcula- tions. If the Start is placed on a packet that contains an Address and Endpoint, the bandwidth for that combination is displayed in the Status Bar below the trace data. |
|
CATC Walk |
Select Play to start playing the CATC Walk playlist or Manage Playlists to display the Edit CATC Walk Playlists dialog to manage playlists. |
|
Real-time Statistics |
Allows you to view traffic statistics as they occur. See Real-Time Monitoring. |
|
USB3 Electrical Test Mode |
Initiate Loopback Mode and send Pings from the Exerciser. Note: This functionality is unsupported and for informational use only. There is no guarantee that it will work correctly. |
|
Trace Views |
Displays CATC Trace, Compressed CATC Trace, Spreadsheet (Color), or Spreadsheet (B/W). |
|
Unhide fields |
Unhide previously hidden Traffic, VBUS Power, PD Preamble, CC1 Left Power, CC2 Left Power, CC1 Right Power, CC2 Right Power, USB4 SB CRC, USB4 Reserved, USB4 CRC or Unhide All. |
|
Zoom In |
Increases the size of the displayed elements. |
|
Zoom Out |
Decreases the size of the displayed elements. |
|
Wrap |
Wraps displayed packets within the window. |
|
Synchronize Trace View with Other Views |
Synchronizes the Trace view with other views |
|
Hide All USB 2.0 Traffic |
Hides all the USB 2.0 traffic (low speed, full speed, and high speed). |
|
Hide All USB 3.2 Traffic |
Hides all the SuperSpeed and SuperSpeed+ traffic. |
|
Hide All USB PD Traffic |
Hides all the USB power delivery traffic. |
|
Hide All CC Traffic |
Hides all Type-C CC1 and CC2 Event Traffic (Configuration Channel) |
|
Hide All DP Traffic |
Hides All Data Port Traffic |
|
Hide All Traffic from Left and Right Directions |
Hides All Transfers from Left DUT or DUT (Exerciser) when system is in Analyzer Mode |
|
Hides All Transfers from Right DUT or Voyager (Exerciser) when system is in Exerciser Mode |
|
|
Hiding Traffic from Left DUT / DUT [Exerciser] by Lane |
Hide L0, Hide L1, Hide LB, Hide PD/USB4 SB |
|
Hiding Traffic from Right DUT / Voyager [Exerciser] by Lane |
Hide L0, Hide L1, Hide LB, Hide PD/USB4 SB |
|
Hiding USB 2.0 Traffic |
Hides SOFs: Start of Frames Chirps: Chirp-K and Chirp-J Bus conditions (these are recorded only) |
|
Hiding USB 3.2 Traffic |
Hides: Training Sequence Packets: TSEQ, TS1/TS2 Hide Link Commands: LUP/LDN, Flow Control, Power Management, GenT NOP, GenT Link Keep-Alive Bus Event: Hide LFPS Packets, Hide Electrical Idles, Hide Terminations Miscellaneous: Hide LMP Packets, Hide ISO Time Stamp Packets, Hide Inter-Packet Symbols, Hide Skip Sequences, Hide Logical Idle Packets, Hide Loopback Packets (BCNT, BRST, BERC), Hide Compliance Packets Hide LTSSM Transition Indicators |
|
Hiding USB4 (or TBT3) Traffic |
Hides a variety of USB4 packets and events. |
|
Hiding Power Delivery Traffic |
Hide Unknown Packets Hide Ping Packets Hide GoodCRC Packets |
|
Hide Devices (Addr/Endp).... |
Opens the Hiding Devices dialog displaying packets belonging to speci- fied devices by address and endpoint |
|
Hide All Except Transfers |
Hide All Except Transfer Packets |
|
Hide USB2 NAKs/USB3 Failed |
Shows/Hides USB2 NAK Transactions and USB3 Failed Transactions |
|
Hide Non-Data Transaction |
Shows/Hides all Non-Data Traffic |
|
View Layers Mode |
Display All Layers, Application Layers, or Lower USB Layers. |
|
Stacking View |
Puts a group of packets in one row, to shorten display. See Stacking. |
|
Decoding Settings |
Decoding scripts set the values of the display and recording options for optimum views of trace information from specific vendors or classes of data. This menu option allows you to select the vendor or class of data for the request recipients and endpoints listed in the Request Recipients and Endpoints menu. You can keep the settings across recordings. See Decode Requests. |
|
Enable Sync |
Synchronizes views between synced traces. See Enable Sync Traces on page 420 and Edit Comment. |
|
Level Viewing |
Displays Packet Level
PTP Group
Displays SCSI Operation Level |
|
Refresh Decoding |
Forces the software to re-decode transactions and transfers. Useful if you have applied a decoding mapping which helps fully decode a sequence of transfers, as is the case with Mass Storage decoding. |
|
Restore views to default positions |
If your windows/views end up in a Layout that is not desired, you can select this item to put them into the default state preferred by the application. |
Hide/Show Tunneled PCIe Traffic
You can Show or Hide different types of Tunneled PCIe traffic. One of the options is to Show or Hide Update_FC traffic.

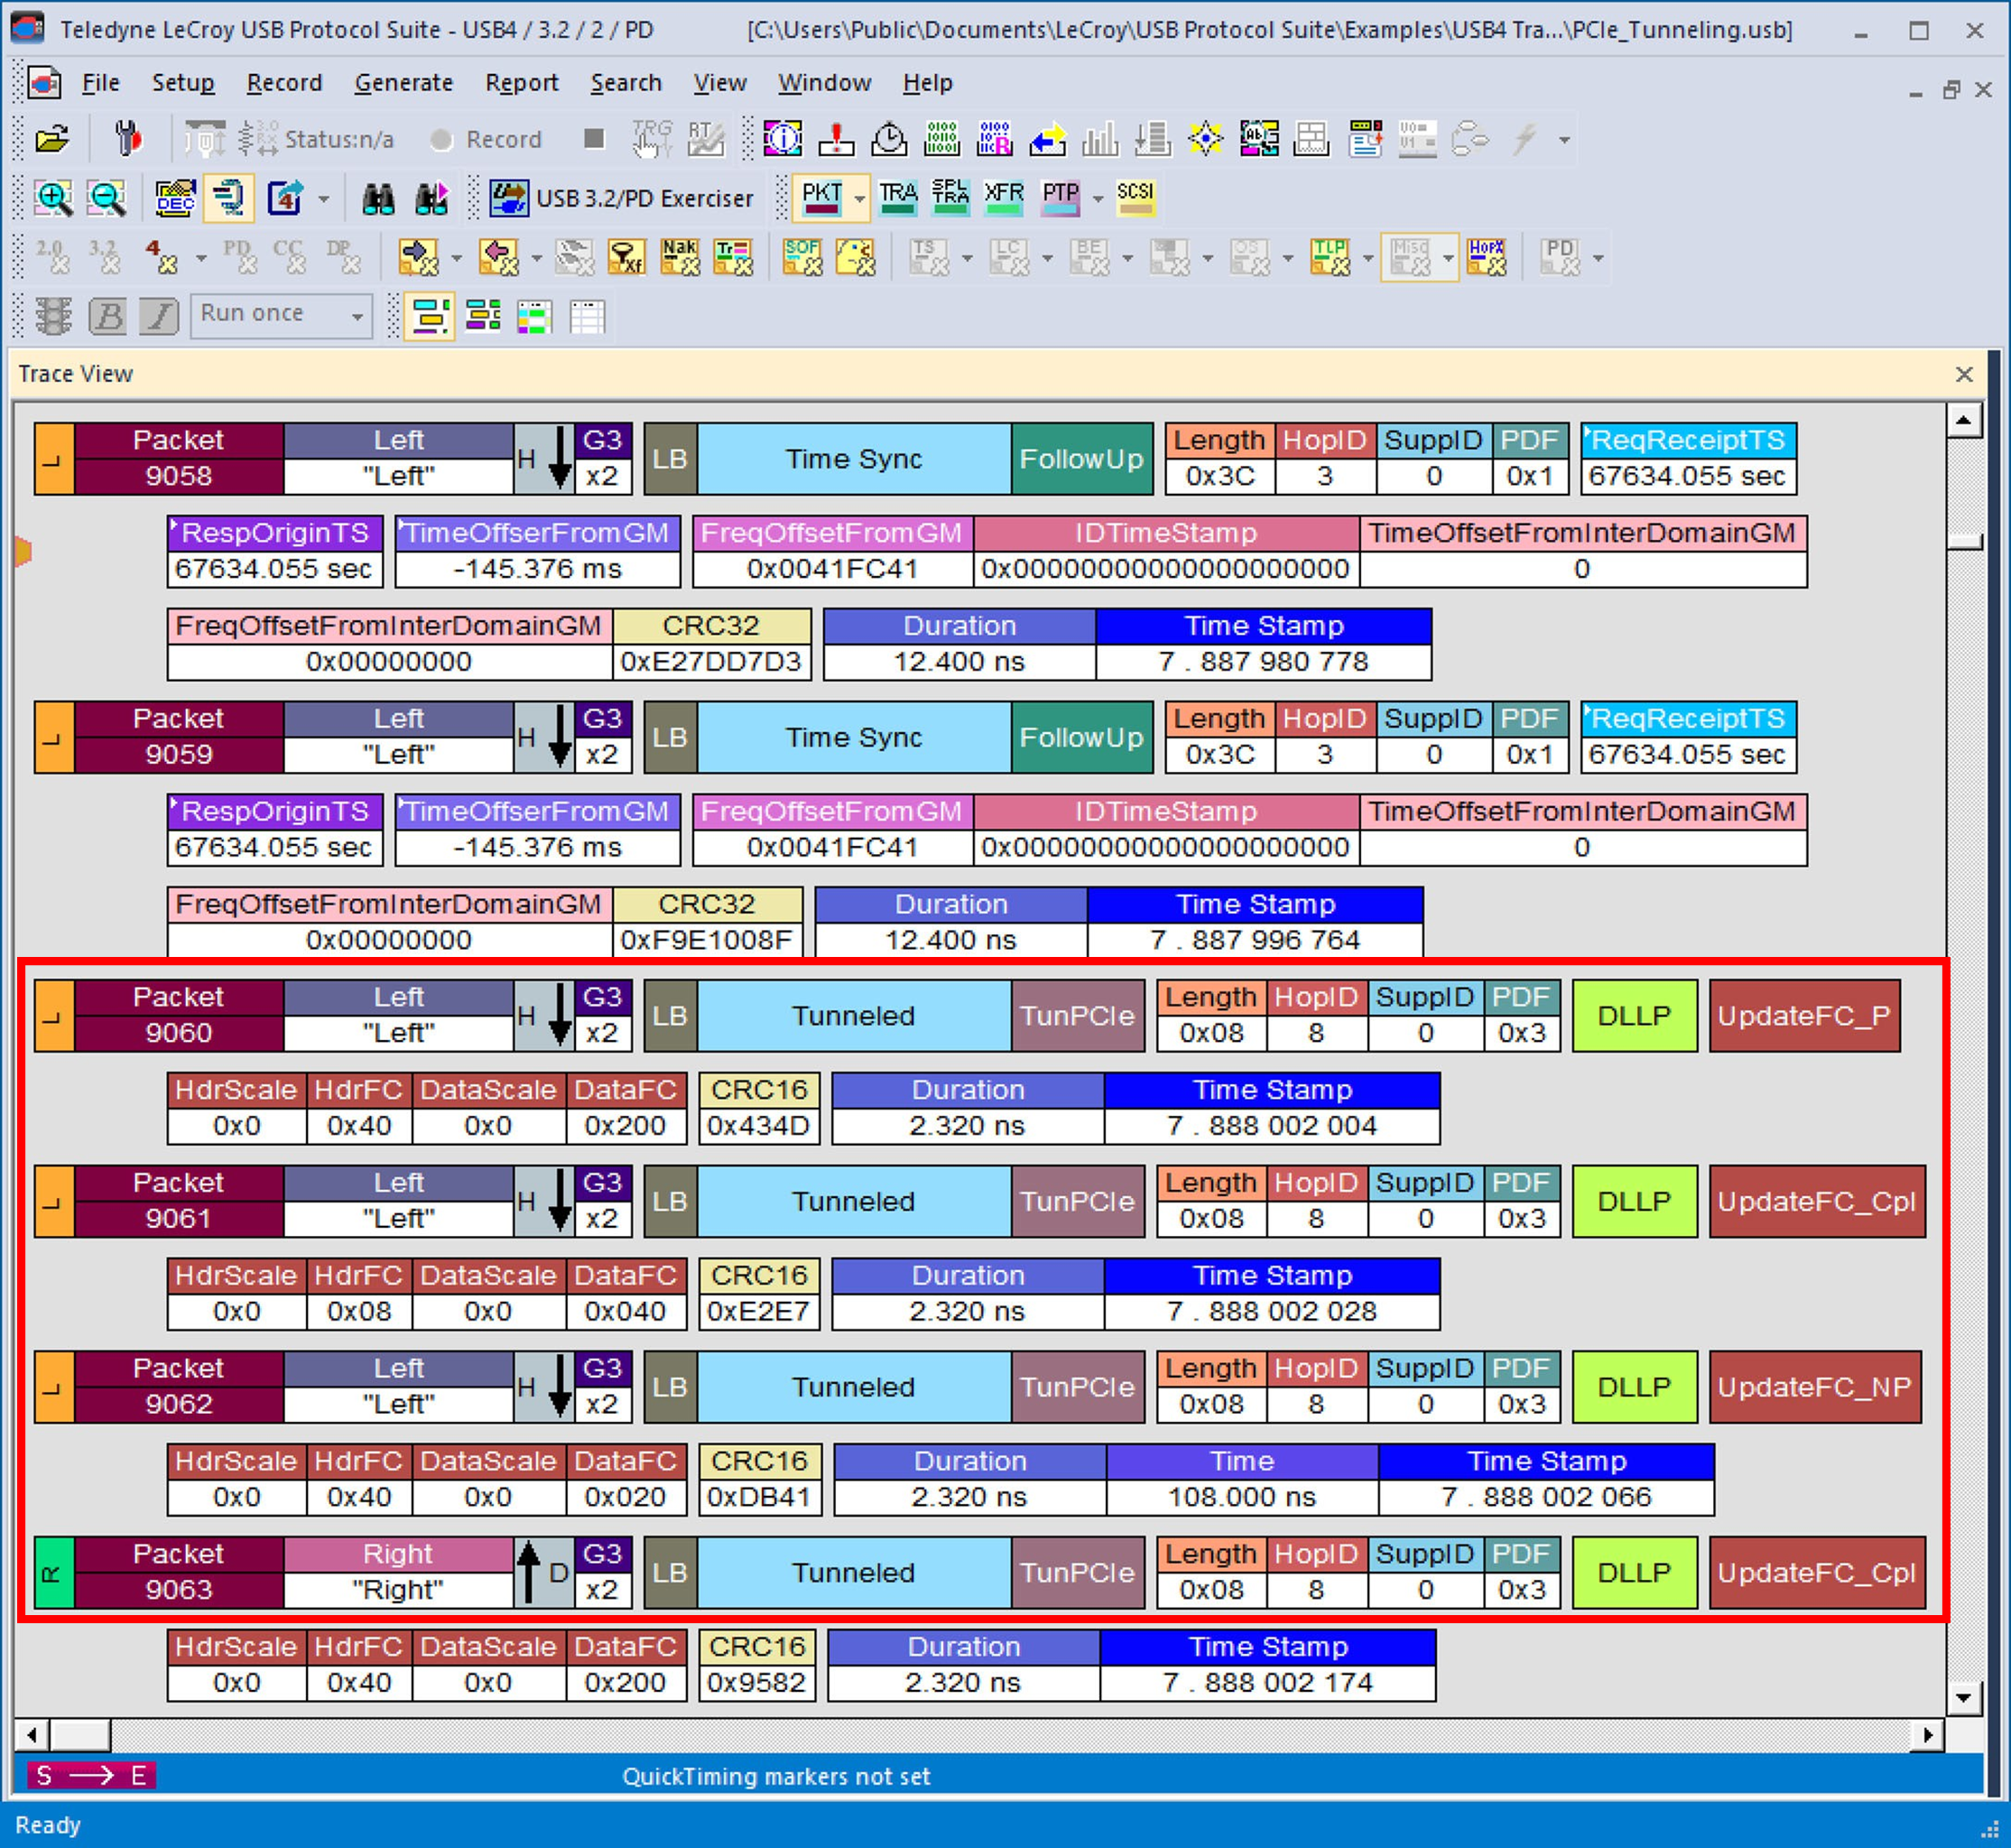
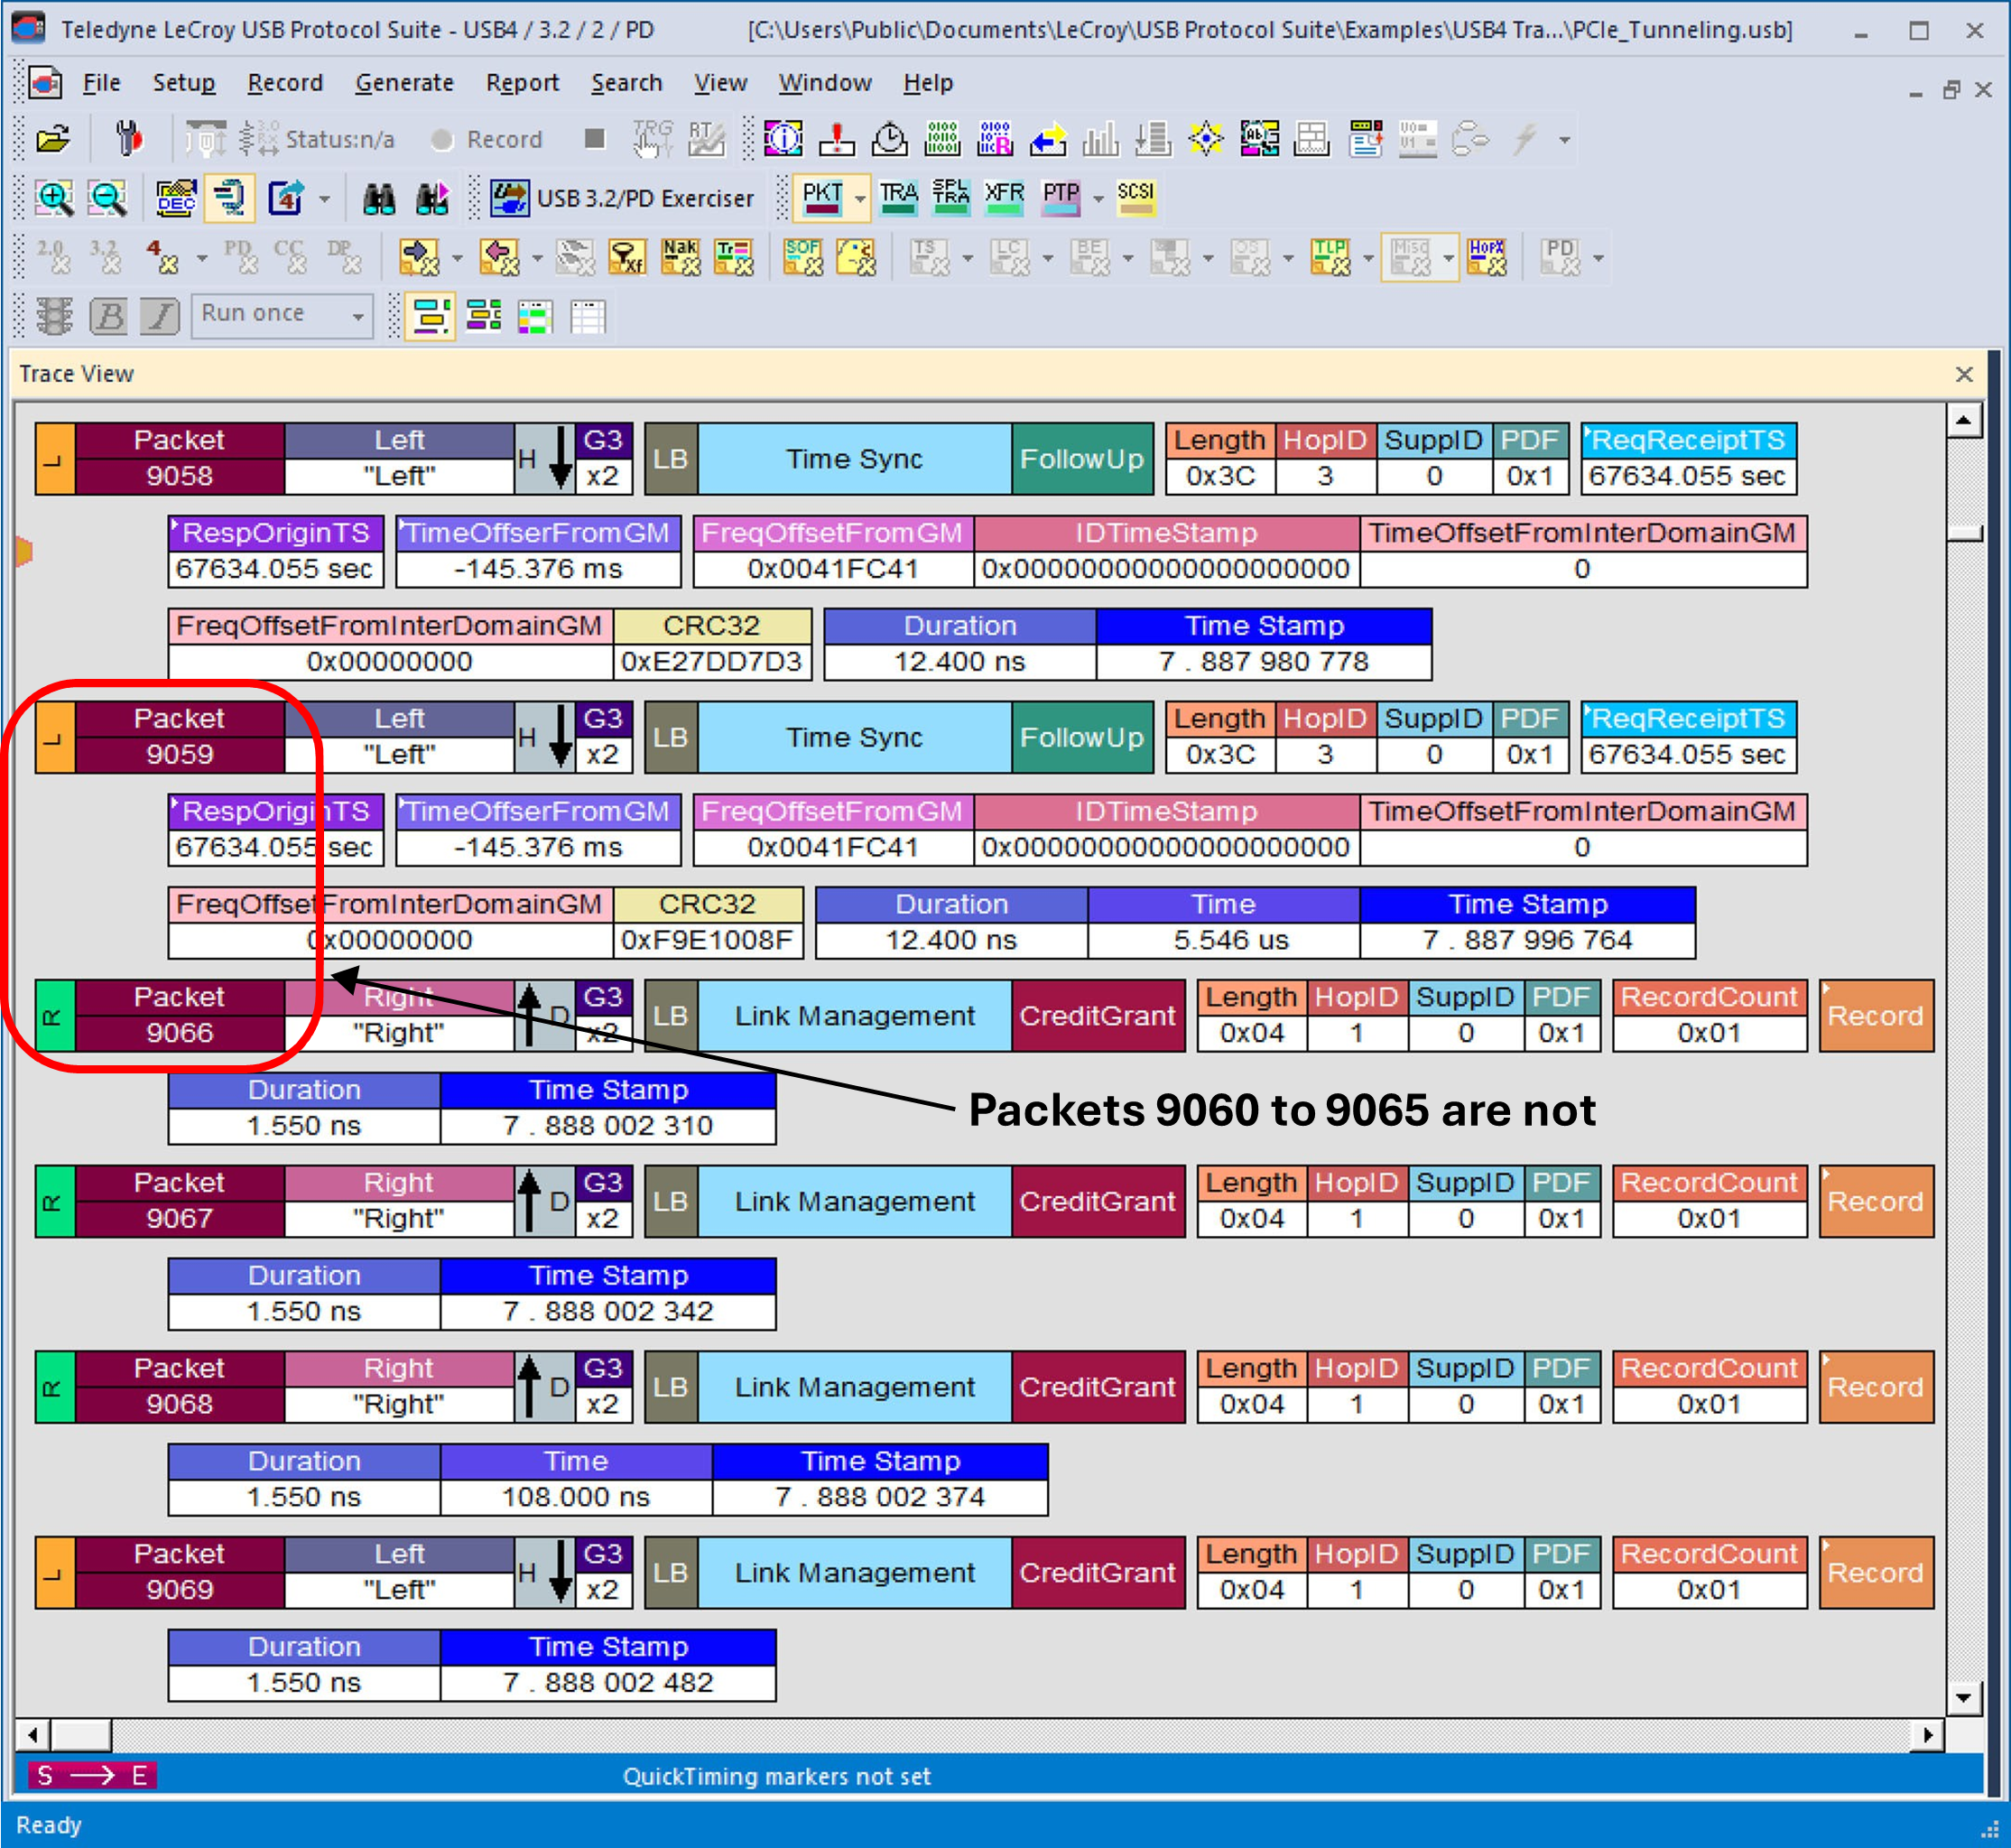
When you select View > Hiding USB4 (or TBT3) Traffic > Hide/Show Tunneled PCIe > Hide Update_FC traffic, the displayed trace hides the Update_FC packets as shown below.
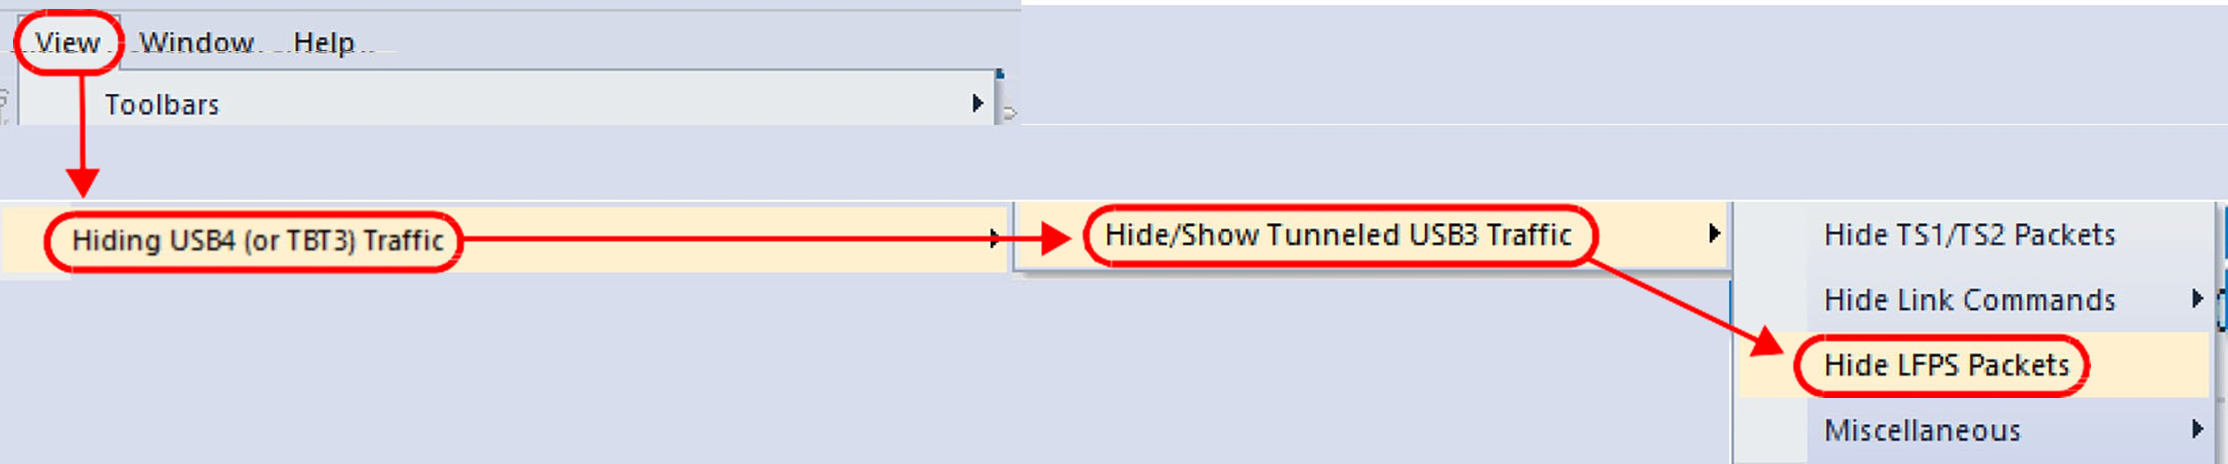
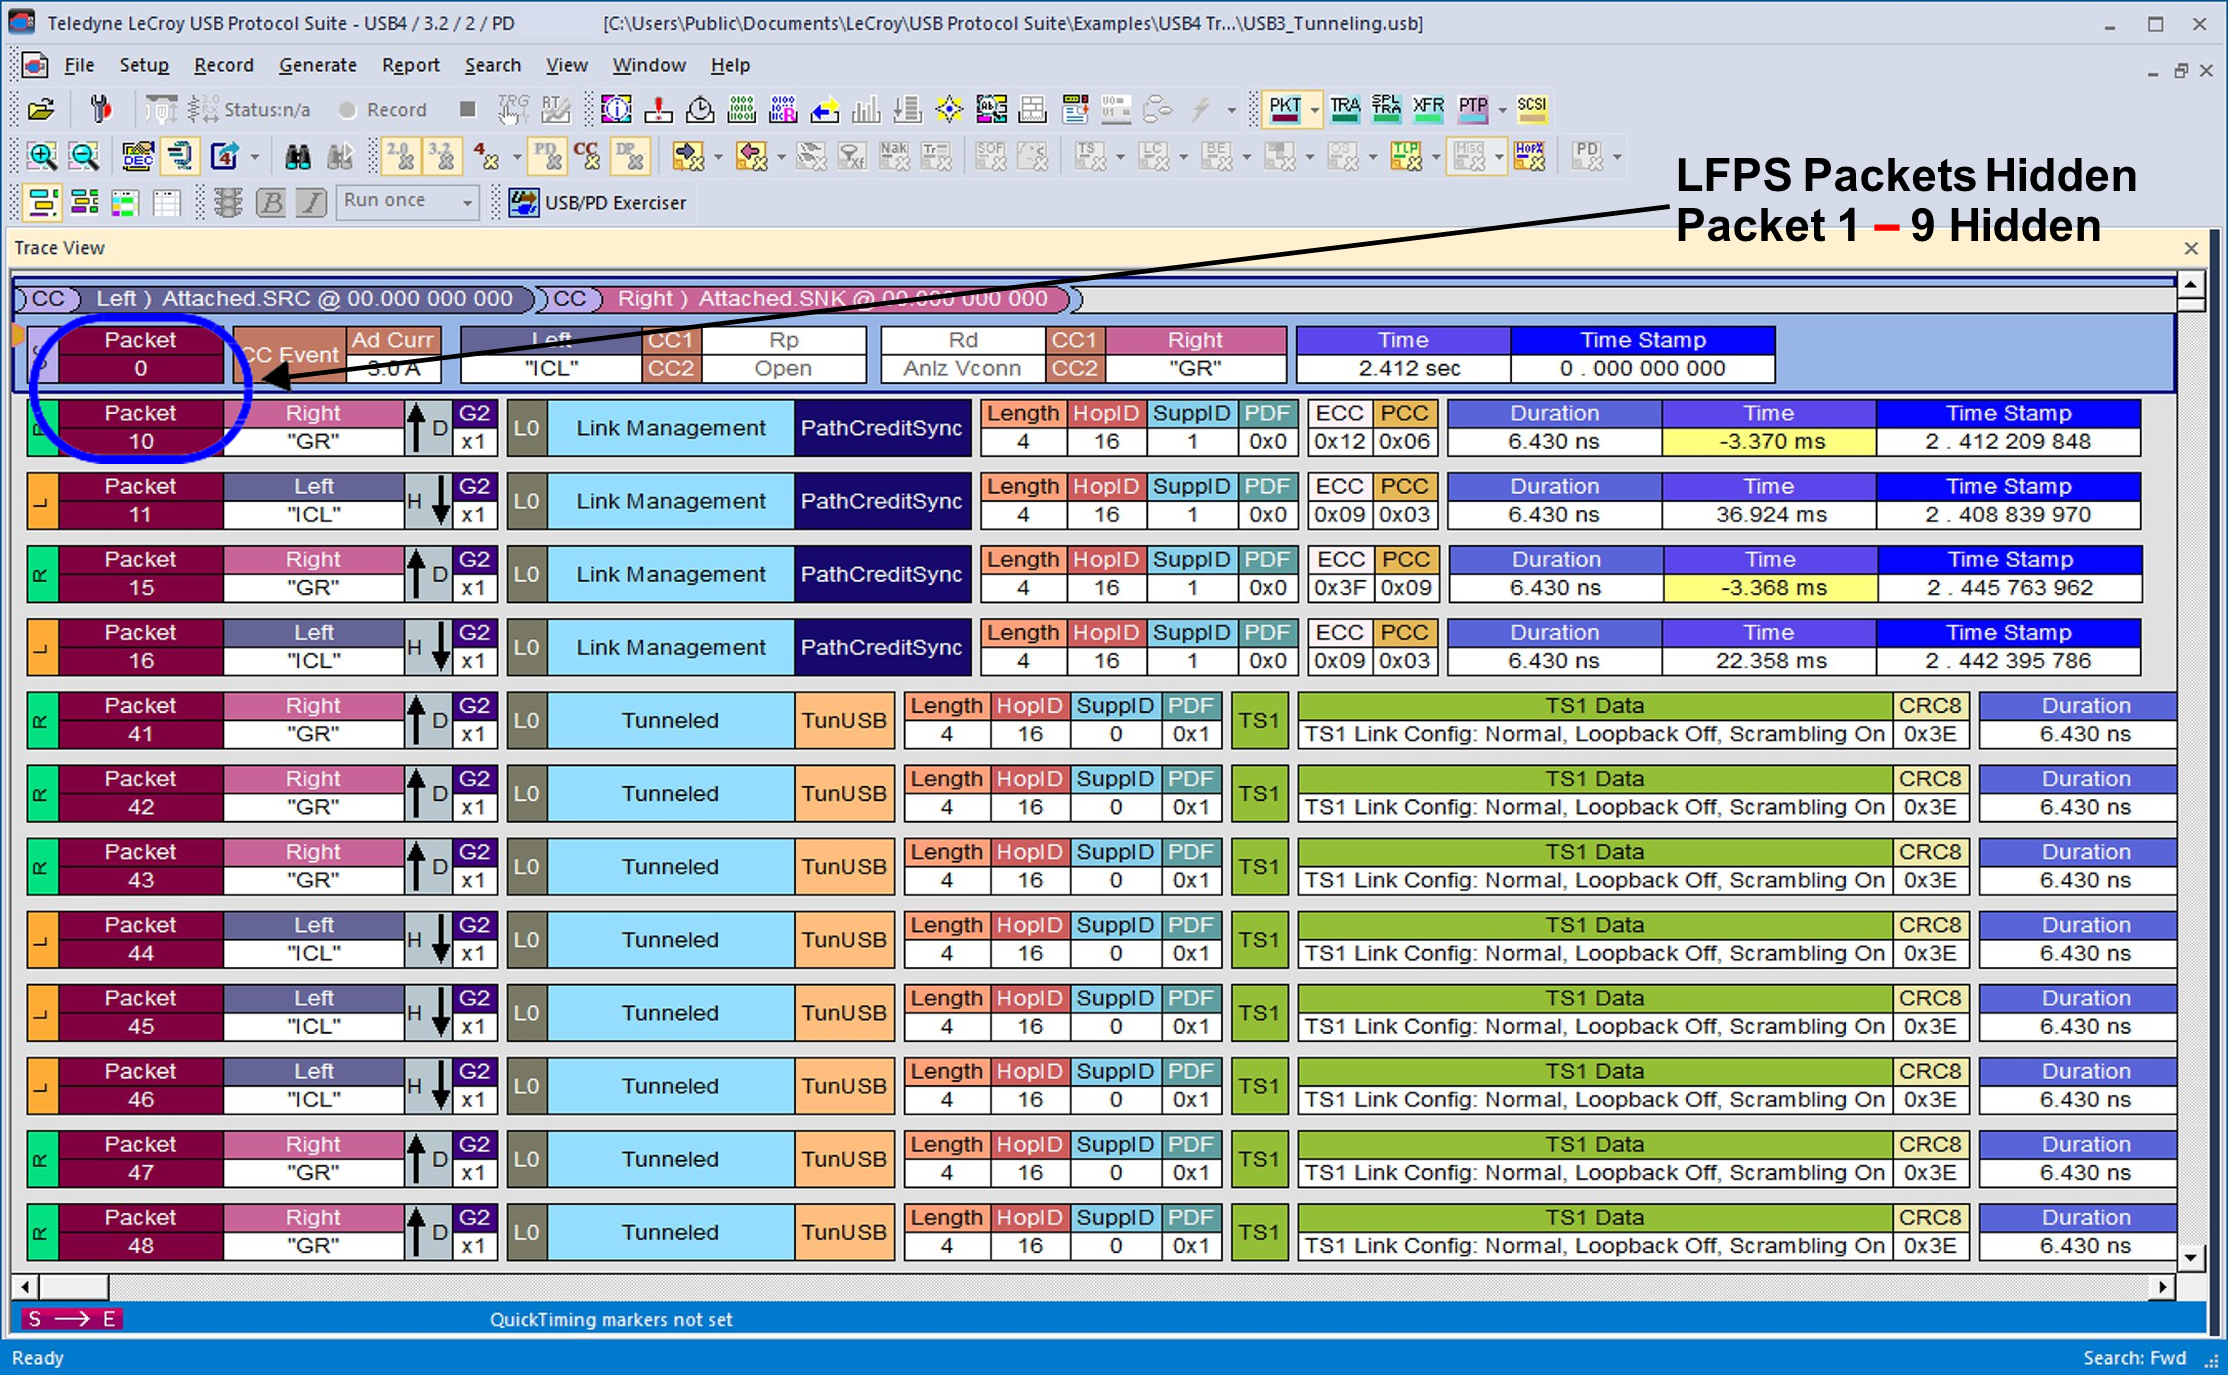
Hide/Show Tunneled USB3 traffic
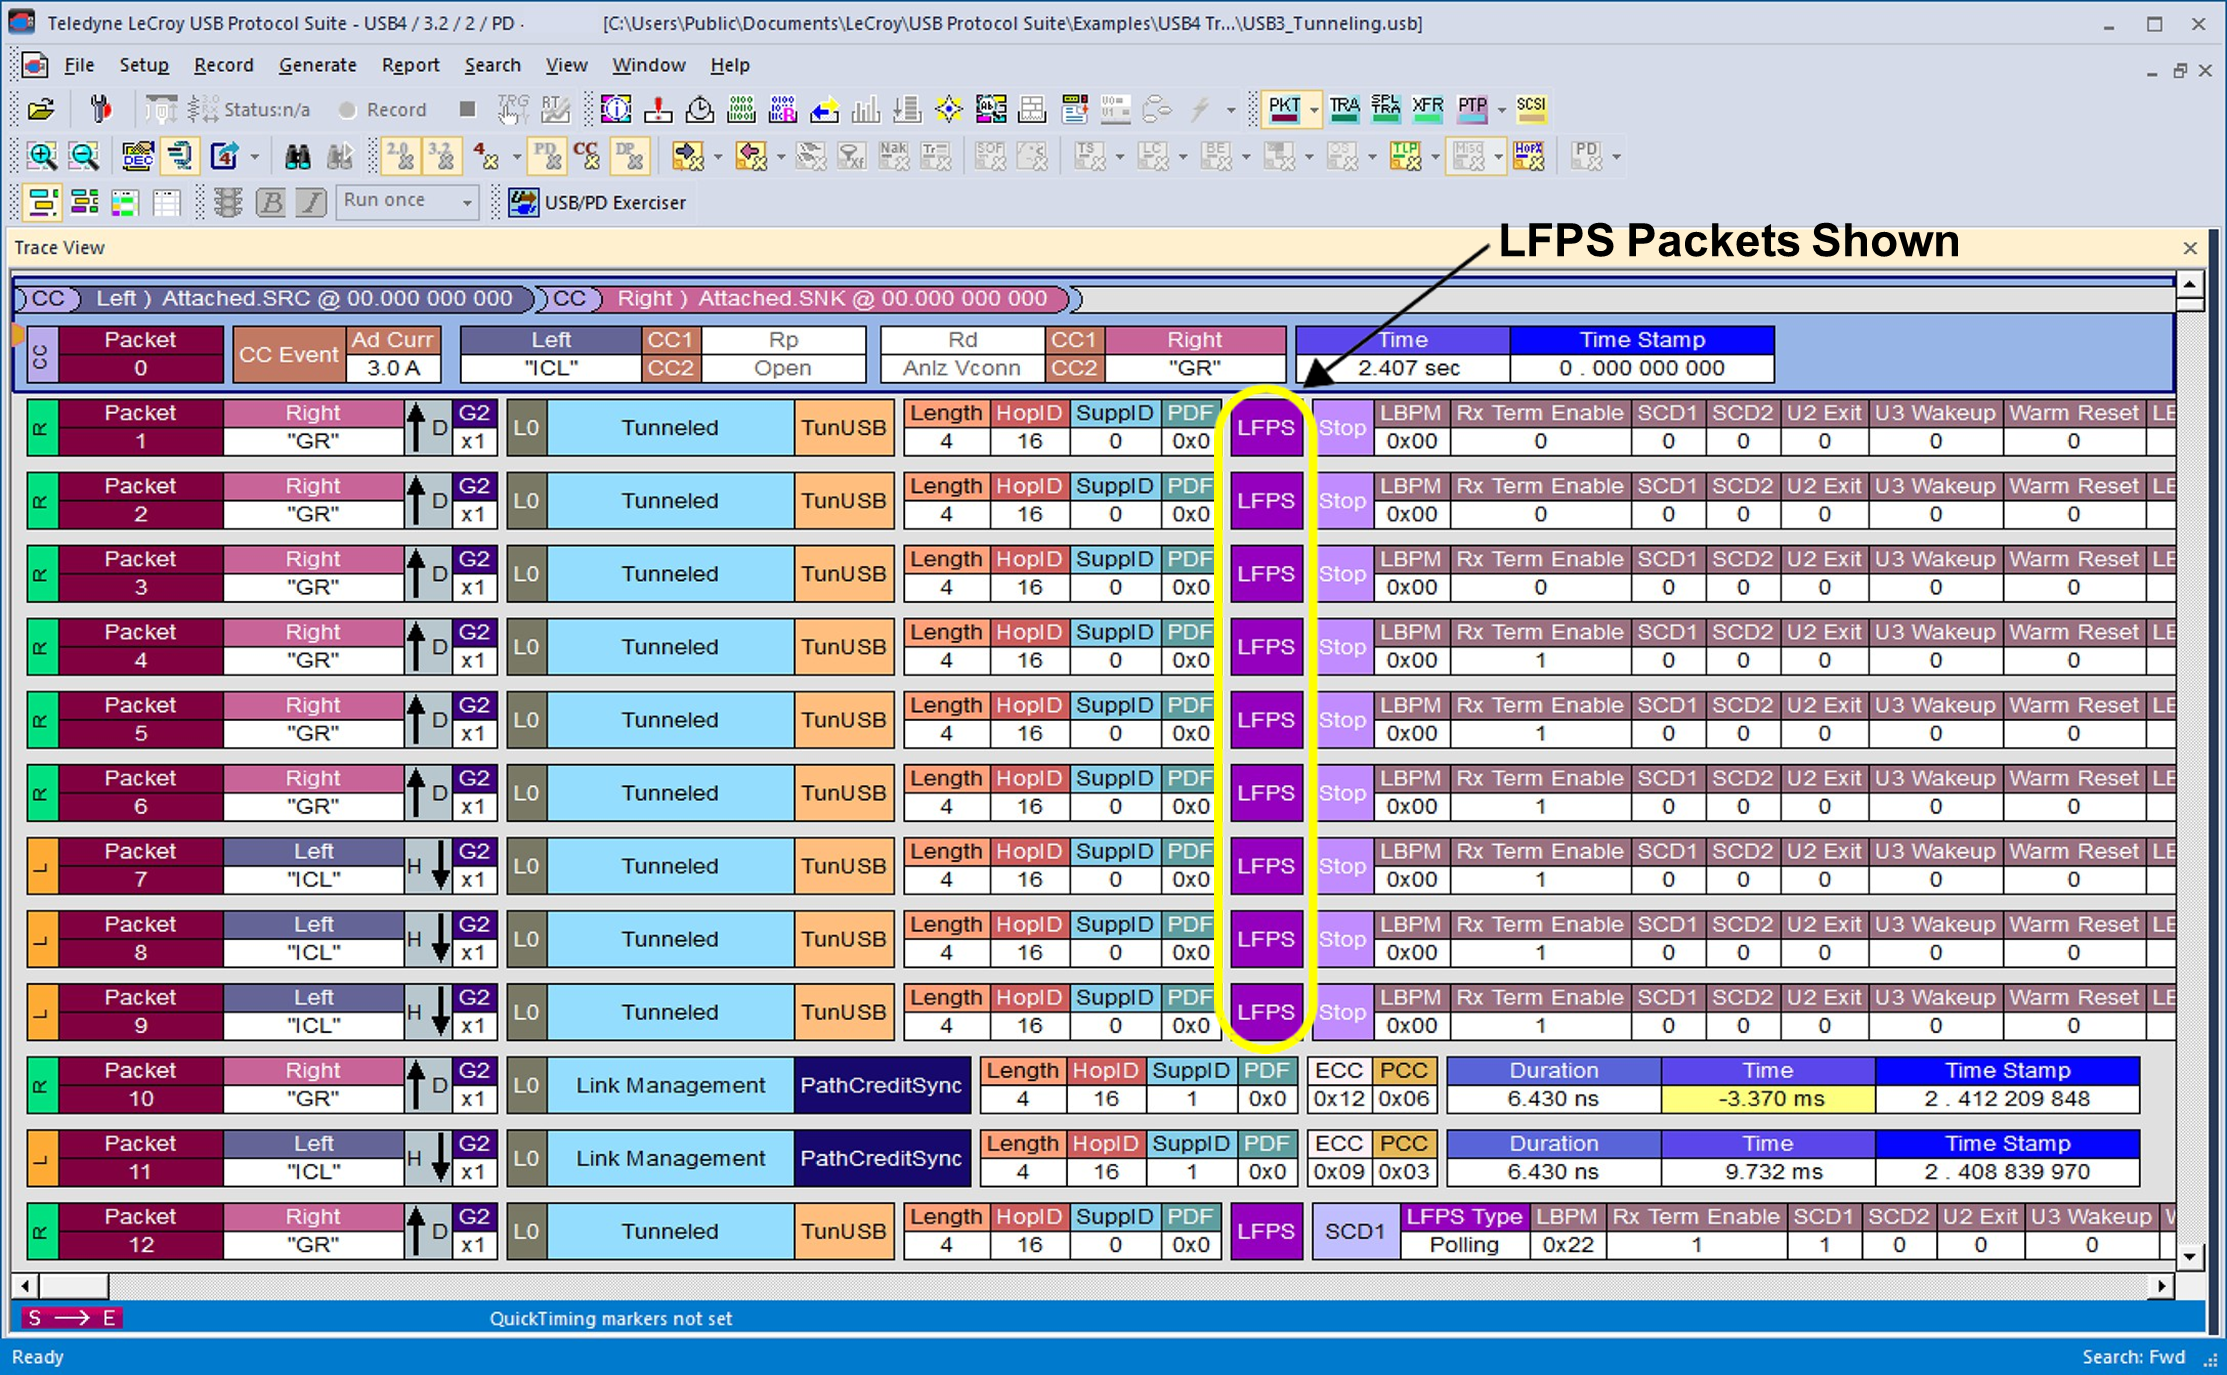
You can Show or Hide different types of Tunneled USB3 traffic. One of the options is to Show or Hide LFPS Packets as shown below.
Window Menu
|
Option |
Function |
|
New Window |
Switches display of the toolbar on or off. |
|
Cascade |
Displays all open windows in an overlapping arrangement. |
|
Tile Horizontal |
Displays all open windows in a above-below arrangement. |
|
Tile Vertical |
Displays all open windows in a side-by-side arrangement. |
|
Arrange Icons |
Arranges minimized windows at the bottom of the display. |
|
Windows... |
Displays a list of open windows. |
Help Menu
|
Option |
Function |
|
Tell Teledyne LeCroy |
Report a problem to Teledyne LeCroy Support via email. This requires that an email client be installed and configured on the host machine. |
|
Guide to Manuals |
Invokes a web page which guides you to the correct documentation for the analyzer you are using. |
|
USB User Manual |
Displays the USB Protocol Suite User Manual. It can be used as online help. |
|
Other Manuals |
Select to display the Automation, Verification Script Engine (VSE), Script Decode Language or USB 3.2 Exerciser Manual PDFs. It can be used as online help. |
|
Video Tutorials |
Has links to YouTube videos that describe Voyager features:
|
|
Display License Information |
Displays information related to licensing. Also used to update a license key. See Update the Software License. |
|
End User License Agreement |
Opens the End User License Agreement (EULA) in a read-only dialog. |
|
Register Product Online |
Register at the Teledyne LeCroy website. See Register Online. |
|
Check for Updates |
Use the Internet to analyze your system for licensed updates. You can set the system to automatically check for updates at application startup in the Teledyne LeCroy USB Protocol Suite Software Update window. See Software Updates. |
|
Shortcut List |
Displays the Shortcuts List of navigation, common, search, decode levels, and miscellaneous mouse and keyboard shortcuts. See Analyzer Keyboard Shortcuts. |
|
About USB Protocol Suite |
Displays version information about the analyzer and the USB Protocol Suite. See Software, Firmware, and BusEngine Revisions. |