
An eye diagram is a display in which a digital signal from a receiver is repetitively sampled and applied to the vertical input, while the data rate is used to trigger the horizontal sweep. It is a tool for the evaluation of the combined effects of channel noise and inter-symbol interference on the performance of a baseband pulse-transmission system. It is the synchronized superposition of all possible realizations of the signal of interest viewed within a particular signaling interval.
In Voyager M310P/Voyager M310e, the Power Delivery Compliance test includes capturing an Eye Diagram of a sequence of bits transmitted by the device under test. The only way to capture this Eye is to run the USB PD Compliance test, which requires a License Key. A trace, captured as a result of an eye test, will contain the data displayed below. See image below.
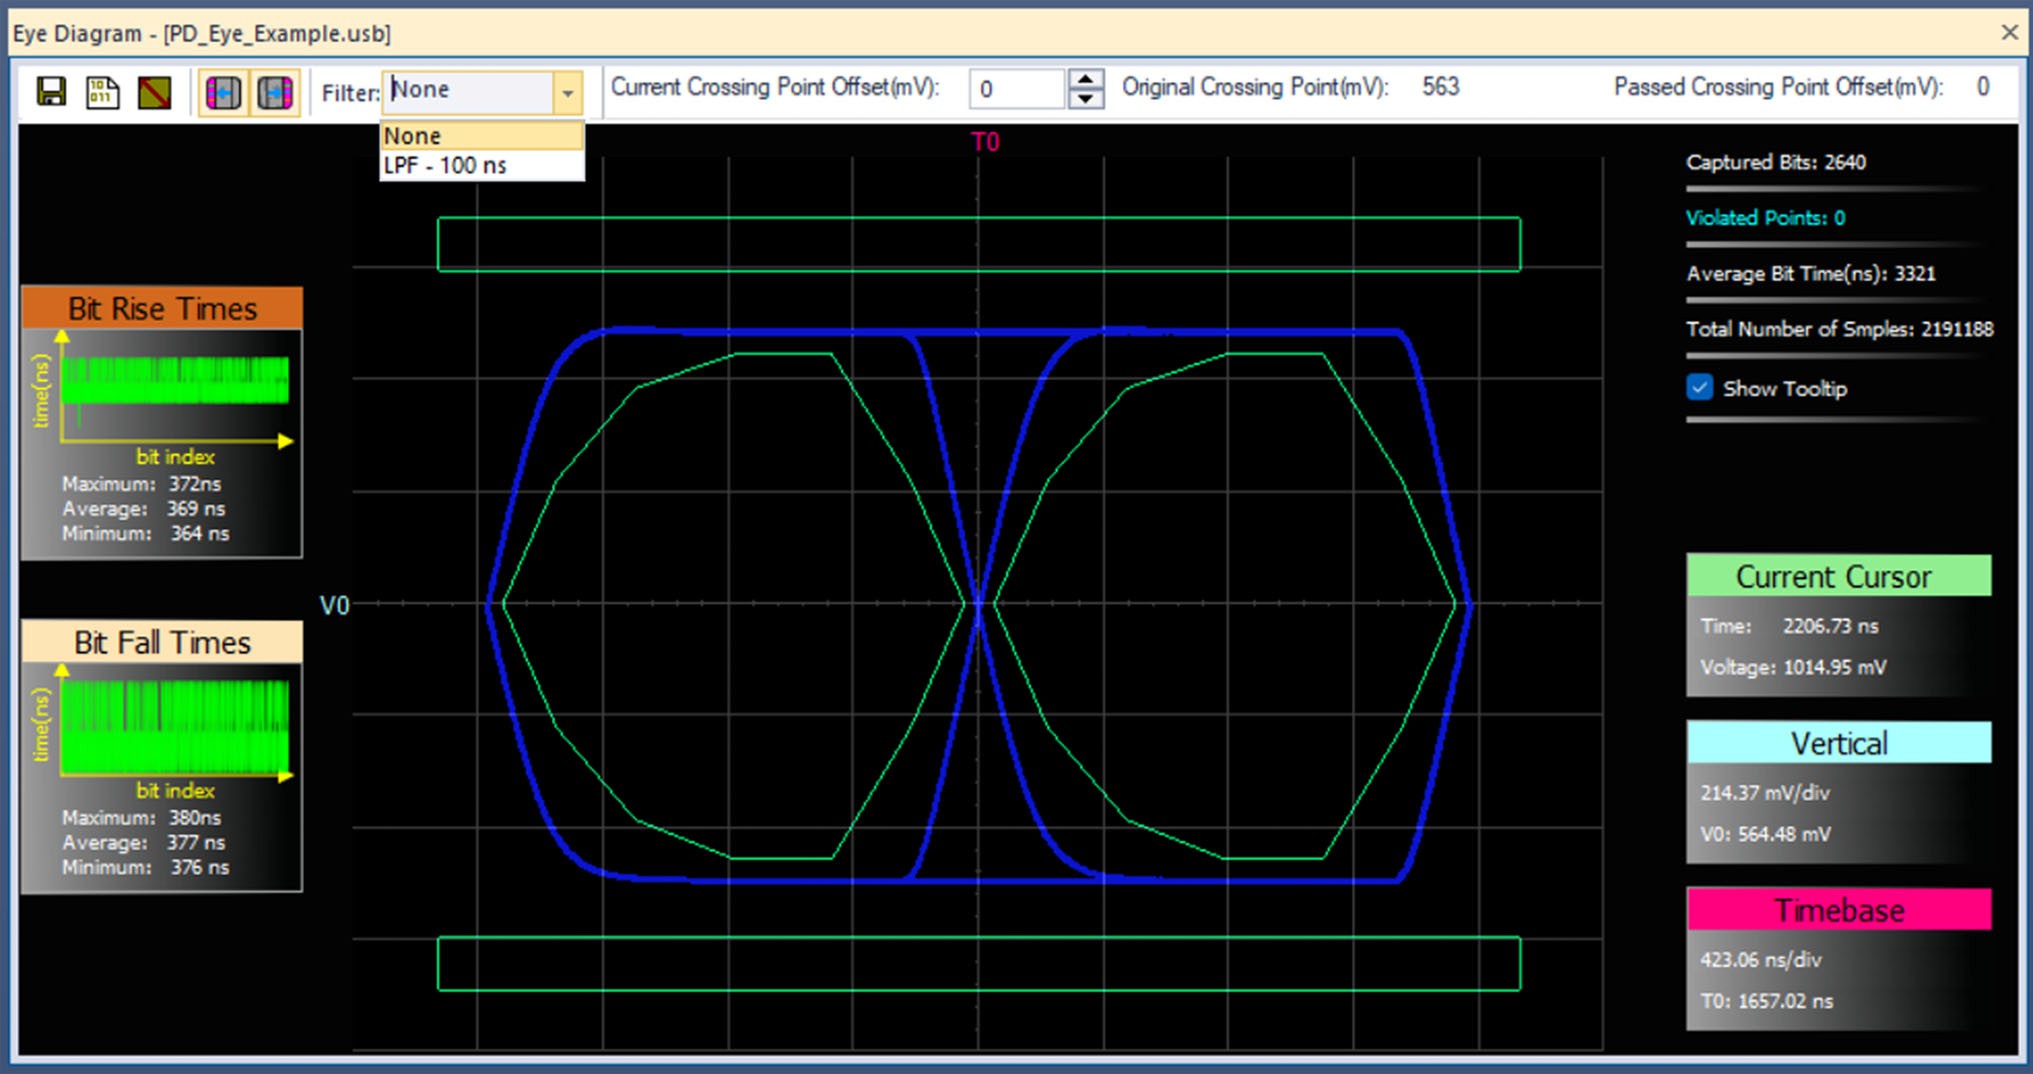
Eye Diagram Information/Options
|
Reading |
Definition |
|---|---|
|
Filter |
(None/LPF - 100ns) Limits the bandwidth shown in the report to the selected value. |
|
Captured Bits |
2640 (Number of bits sampled to produce the eye) |
|
Violated Points |
0 (Number of instances of samples found outside the mask limits) |
|
Average Bit Time (ns) |
3321 |
|
Total Number of Samples |
2191188 |
|
Time (ns) |
2206.74 (Time from the start of the UI to the user's cursor) |
|
Voltage (mV) |
1014.95 (Voltage value at the user's cursor) |
|
Original Crossing Point (mV) |
563 (Value found during capture) |
|
Current Crossing Point (mV) |
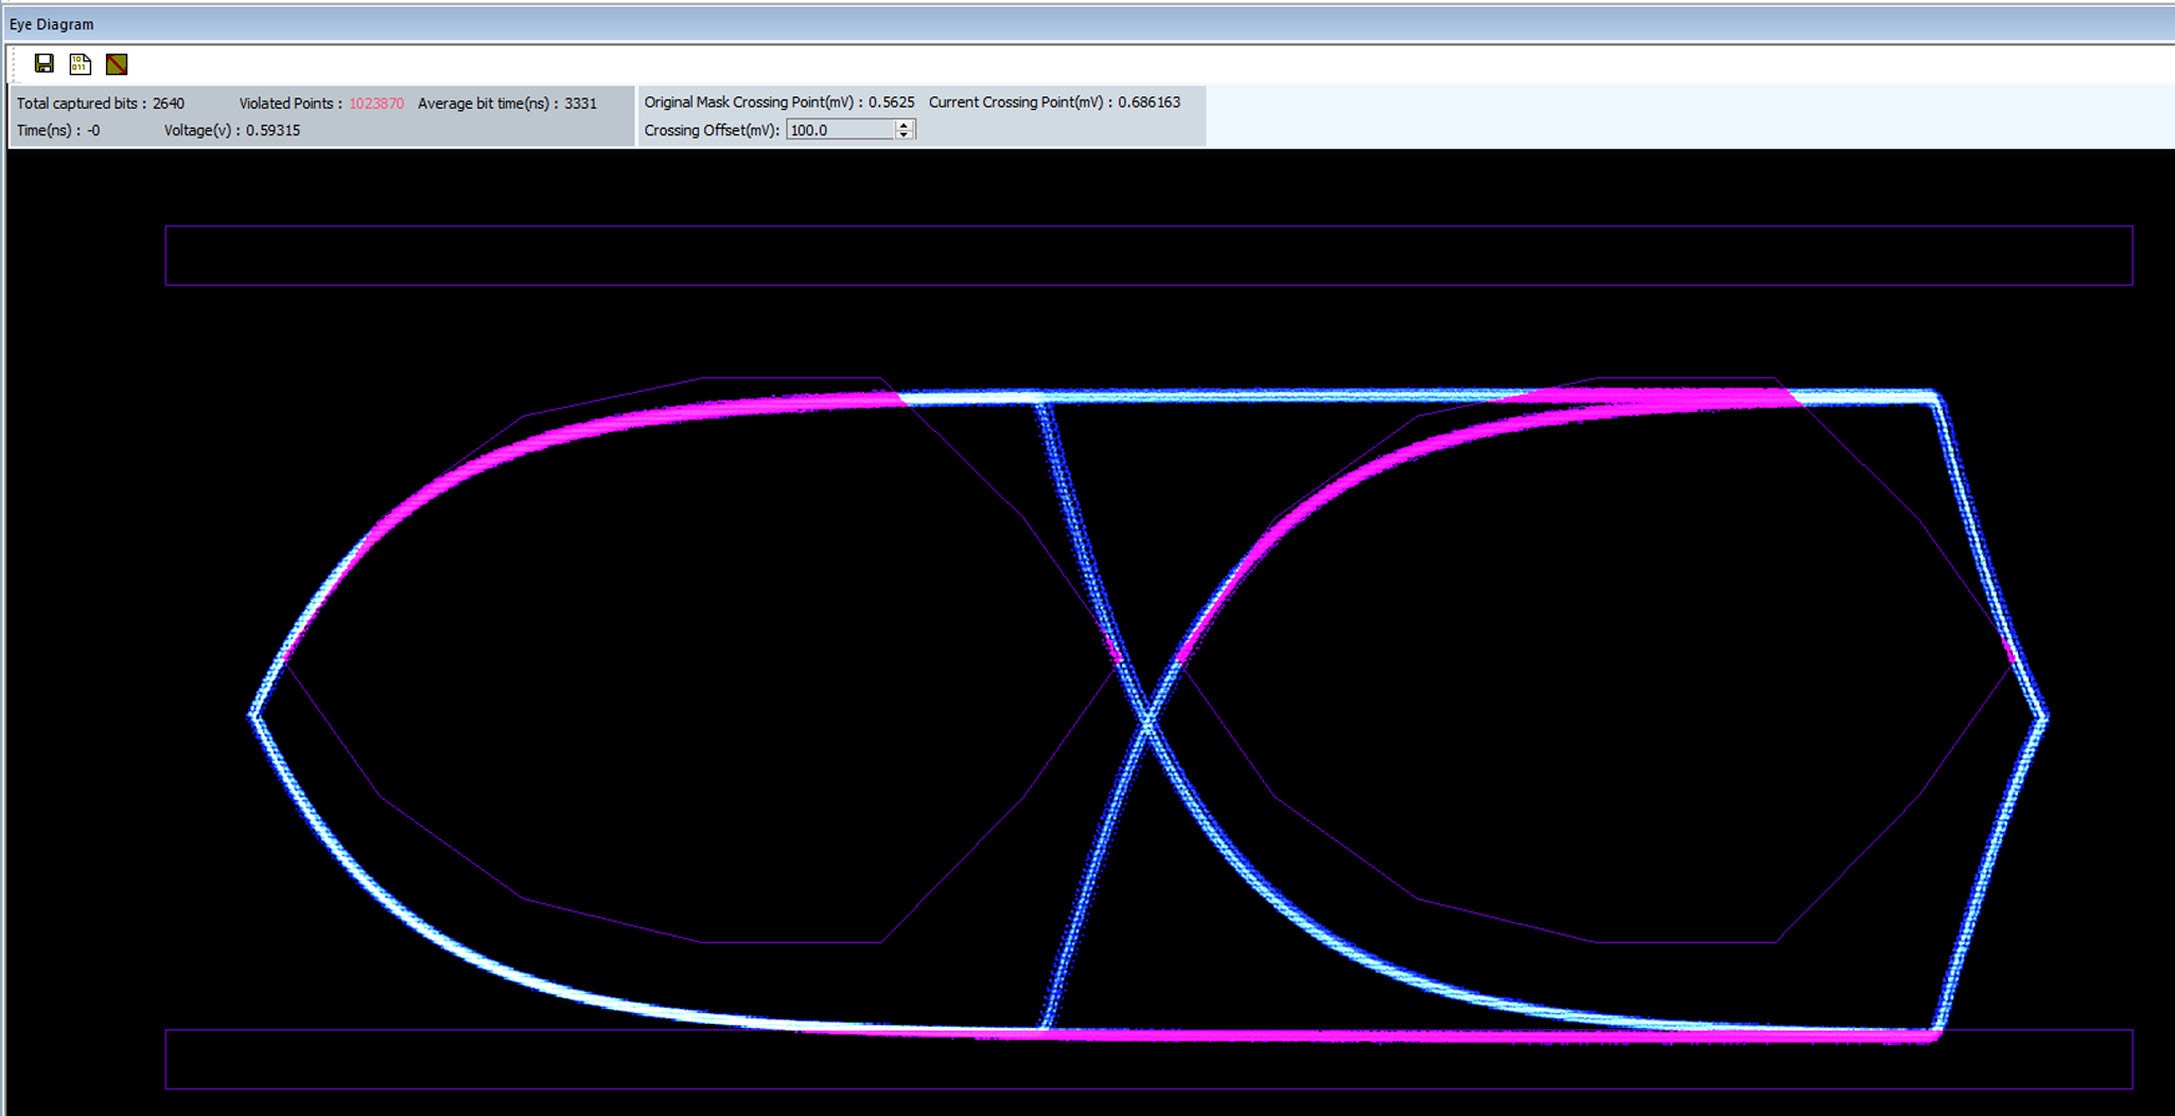
0.586163 (Value found after modifying Crossing Offset) |
|
Passed Crossing Point Offset (mV) |
0.0 (Users can change the crossing offset by changing this millivolt value) |
|
Limits |
+100 (mV) to -100 (mV) |
Effect of Offset
If you change the Crossing Offset you can see the effect on Violated Points. Set the Crossing Offset to 100 mV and this will produce 1023870 violated points, which show up as purple.
Eye Diagram Toolbar
The Eye Diagram Toolbar options, from left to right:
-
Save Eye Diagram as Image: Opens Windows Explorer Folder to save image
-
Export Samples to file: Opens Folder to save image as CSV file
-
Fit Eye Diagram to graph area: Expands image to fill window