
The Real-Time Statistics window displays a graph of real-time link activity. Real-Time Statistics is a summary of the traffic currently being recorded by the analyzer. To display the Real-Time
Statistics window, click 
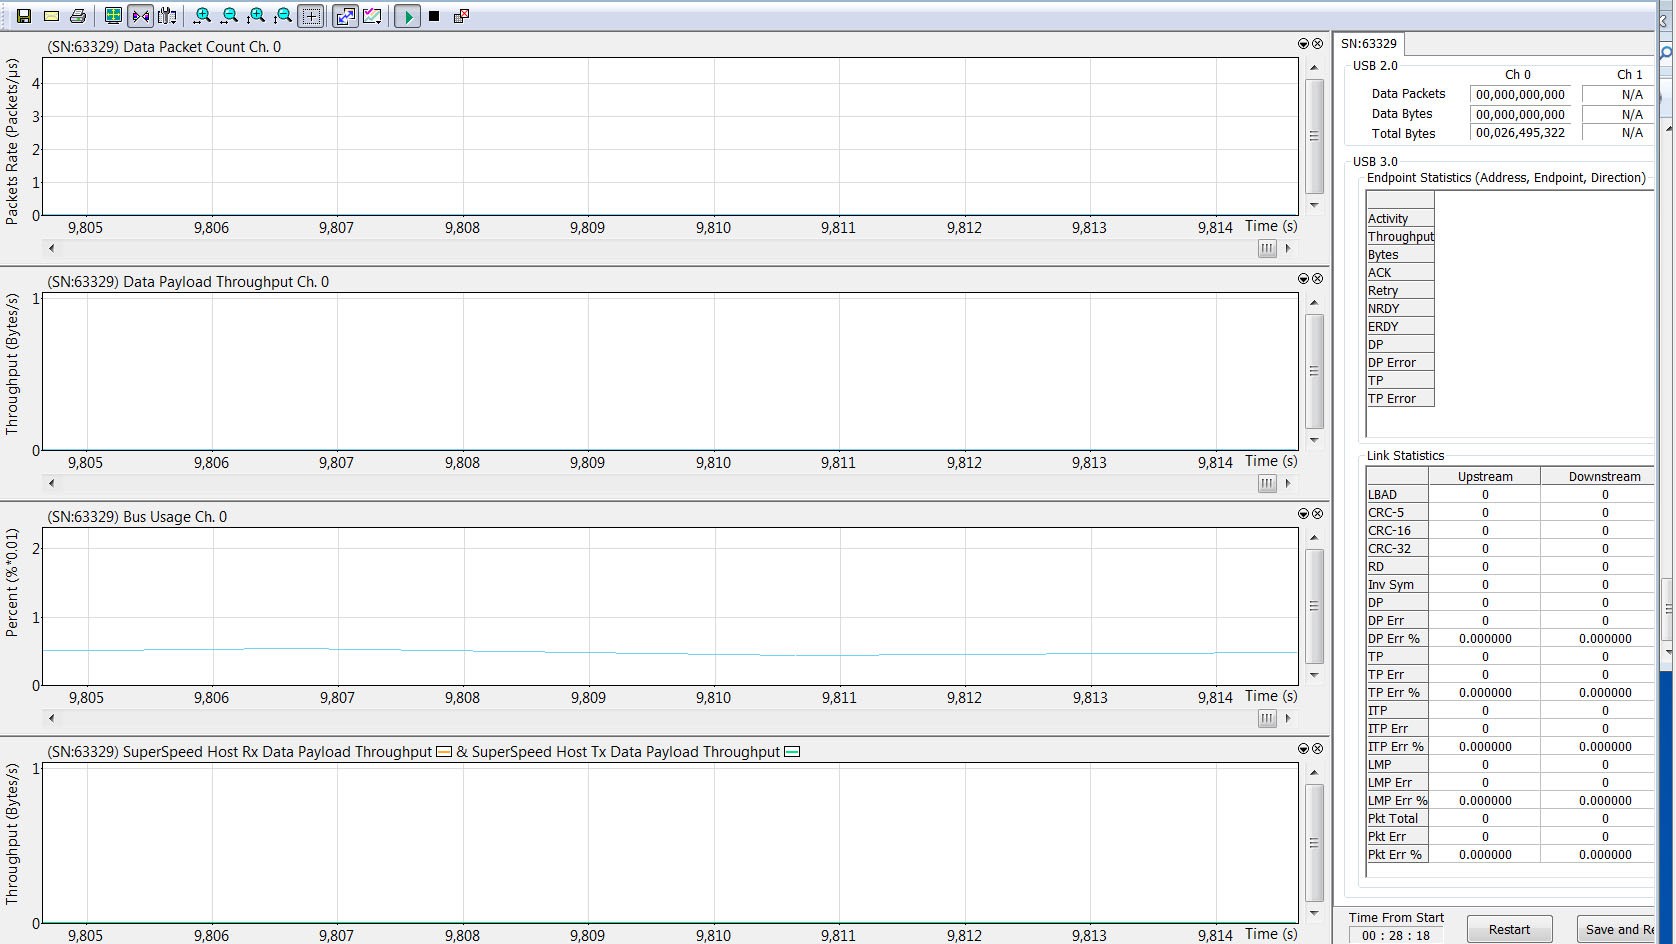
For USB 3.2, the Real-Time Statistics window can display a SuperSpeed graph of real-time link activity. The Link Statistics are displayed on the right bottom panel in the previous screen capture. They are defined as:
-
RD: Running Disparity Errors
-
Inv Sym: Invalid 10-Bit Symbol
Refer to Error Summary for further explanation. To see a graph of traffic, you must start recording:
-
Press

-
To stop the monitor, press

Real-Time Statistics Buttons
The Real-Time Statistics toolbar has buttons for changing the format of the displayed data and for exporting data:

The buttons have the following functions:
Table 10.10: Real-Time Statistics Buttons
|
Button |
Functionality |
|
Button |
Functionality |
|---|---|---|---|---|
|
|
Save As: Saves Real-Time graphs as bitmap files (*.bmp) |
|
|
Vertical zoom in |
|
|
Email: Creates an email with a *.bmp file attachment of the graphs |
|
|
Vertical zoom out |
|
|
|
|
|
Click and Drag zoom: Click diagonally to select and zoom in on part of the graph |
|
|
Full Screen |
|
|
Sync and Graph areas: If two or more graphs are displayed, this button synchronizes the graphs to one another. Once synchronized, the positioning slider of one graph moves the other graphs. |
|
|
Synchronize with other Views. Synchronizes the View windows so that a move in one window repositions the other. See Link Tracker Buttons. |
|
|
Graph Areas: Presents options for displaying additional graphs of data lengths, packet lengths, and percentage of bus utilized. |
|
|
View Settings: Opens a sub-menu with options for formatting the display. See View Settings Menu. |
|
|
Start. Starts the Real-Time Monitor.
|
|
|
Horizontal zoom in |
|
||
|
|
Horizontal zoom out |
|
|
Stop Real-Time Monitoring. |
|
|
Reset graphs. |
|


To clear the counters in the “Statistics Accumulation” area, click the Restart 
To save a snapshot Microsoft Excel .csv file of the data before clearing the values, click the Save and Restart 
The file is in the same folder where Trace files are saved.
The file naming convention is “RTS_Capture_YYYY-MM-DD_HH-MM-SS.csv”.
NOTE: File writing must happen immediately, so there is no file naming dialog.
If you click the button more than once a second, the previous file with the same timestamp will be lost.
Real-Time Statistical Monitor Pop-up Menu
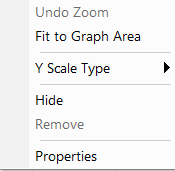
If you right-click a graph in the Real-Time window, a pop-up menu appears with options for changing the format of the display:
-
Undo Zoom: If you have zoomed in, undoes the zoom.
-
Fit to Graph Area: Scales the view so the entire trace fits in the graph area.
-
Y Scale Type:
-
Linear: Converts display to linear format.
-
Logarithmic: Converts display to logarithmic format.
-
-
Hide: Hides the selected graph.
-
Remove: Removes the selected graph.
-
Properties: Opens a dialog box with options for changing the colors, titles and other features of the graphs.
Displaying Multiple Graphs
The Real Time Statistics window gives you the ability to create up to three separate graphing windows so that you can create separate graphs of traffic and tile them vertically. Within these windows, you can format the graphs in a number of ways.
To view two or three graphs simultaneously, click the Graph Areas 
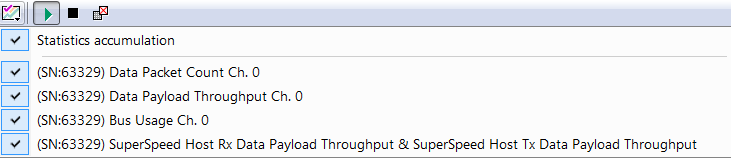
Selecting a checkbox displays the selected graph type:
-
Statistics Accumulation: Plots the percentage of Link utilization by non- idle traffic for both directions of the link.
-
Data Packet Count (Packets/s): Plots counts of Data Packets per second for both directions of the link.
-
Data Payload Throughput (MBytes): Plots data payload throughput for both directions of the link.
-
Bus Usage: Plots amount of Bus usage.
-
SuperSpeed Host Rx Data Payload & SuperSpeed Host Tx Data Payload: For USB 3.2, the Real-Time Statistics window can display a SuperSpeed graph of real-time link activity.