
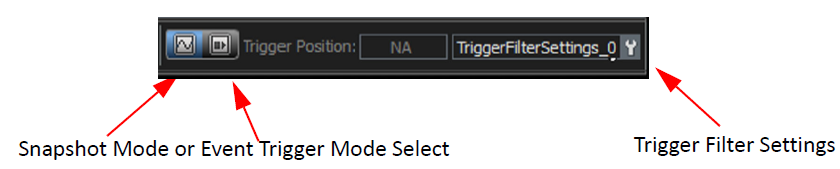
Use the Trigger/Filter Settings pane to select Snapshot or Event Trigger mode and choose the Trigger Filter settings. See figures below.

Clicking on the 

Snapshot Mode
A Snapshot is a fixed-length recording and is the default triggering mode. The size of this recording is set by the Buffer Size box (Buffer Size and Segments). Recording begins when 
Event Trigger Mode
In Event Trigger Mode, recording begins when you click on the toolbar.
Recording continues in a circular manner within the limits set by the buffer size until an Event Trigger is detected that meets the Trigger conditions specified in the Triggering Options and the defined amount of data has been recorded after the Event Trigger.
Note: If no Event Trigger occurs, the data continues be written into memory and will over-write the previously written data until the recording session is manually stopped by clicking on the Record button again.
Buffer Size and Segments
The Analyzer Settings panel has the Recording Buffer pane where you can set the buffer size (megabytes or gigabytes), number of Segments, and the Segment size.
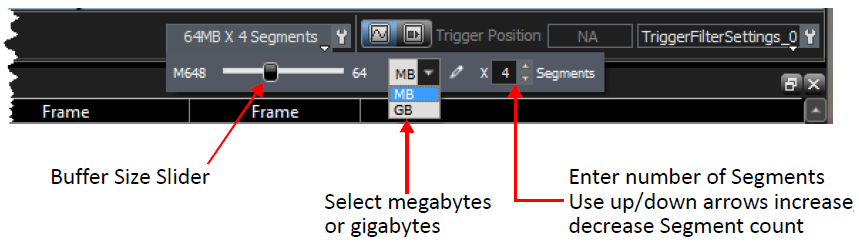
The default is a buffer size of 24MB x 1 Segment. Setting multiple segments will trigger on the first occurrence of the trigger condition, fill the first segment, then automatically re-arm the trigger and repeat the remaining number of segments specified.
-
Use the slider to increase/decrease the buffer size, then click the arrow to indicate MB or GB. You can set the size of each segment, up to the buffer size, divided by the number of segments. Maximum buffer size depends on the hardware.
-
Enter an integer number of Segments, from 1 to 32 (default = 1), or click the up/down arrows to set the number of Segments.
The New Project window opens with default settings to Snapshot mode and 1 segment of 24MB. (The analyzer captures everything immediately, when the Record button is clicked without triggering on anything in particular.)
When the analyzer is changed to Event Trigger mode, each time a trigger condition occurs, the system records a new segment. When the same trigger automatically repeats, the system records the number of segments that you entered.
Note: If the size of a data traffic exceeds the buffer memory allocation, the project runs, but no data capture occurs. You must increase buffer memory size to a value greater than the data traffic size.
Trigger Position
Configuring an Event Trigger Position
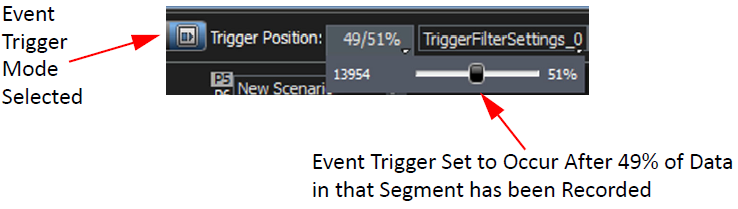
Choosing the Event Trigger option enables the Trigger Position to be set manually. You can set the trigger position in the captured buffer as a percentage of the segment size. A trigger point of 1% means the trigger point will be near the first event in the buffer.
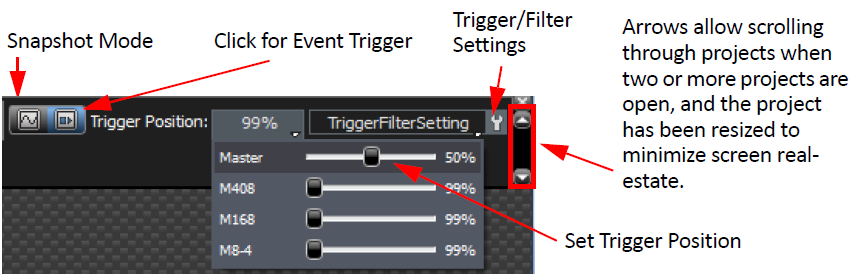
Arrows allow scrolling through projects when two or more projects are open, and the project has been resized to minimize screen real-estate.
Pre-Trigger/Post-Trigger
You can set the amount of data to be captured before and after the trigger event, as a percentage of the data segment, between 1% and 99%.
The Pre-trigger specifies a percentage of data prior to the triggering event. This feature allows the evaluation of bus activity leading up to and after the triggering event, shown in the image below.
You can adjust the amount of recording to be done post-trigger or select where you want the Trigger located within the defined buffer. You can adjust the Triggering Position between 1 and 99% post-trigger. As an example, if the buffer size is set to 16 MB, then for the following Trigger Position settings, the amount of pre-trigger and post-trigger data is:
-
95% post-triggering: 0.8 MB pre-trigger, 15.2 MB post-trigger
-
75% post-triggering: 4 MB pre-trigger, 12 MB post-trigger
-
50% post-triggering: 8 MB pre-trigger, 8 MB post-trigger
-
25% post-triggering: 12 MB pre-trigger, 4 MB post-trigger
-
5% post-triggering: 15.2 MB pre-trigger, 0.8 MB post-trigger
When a Trigger occurs, recording continues until the post-trigger amount of the buffer is filled or when Stop is selected.
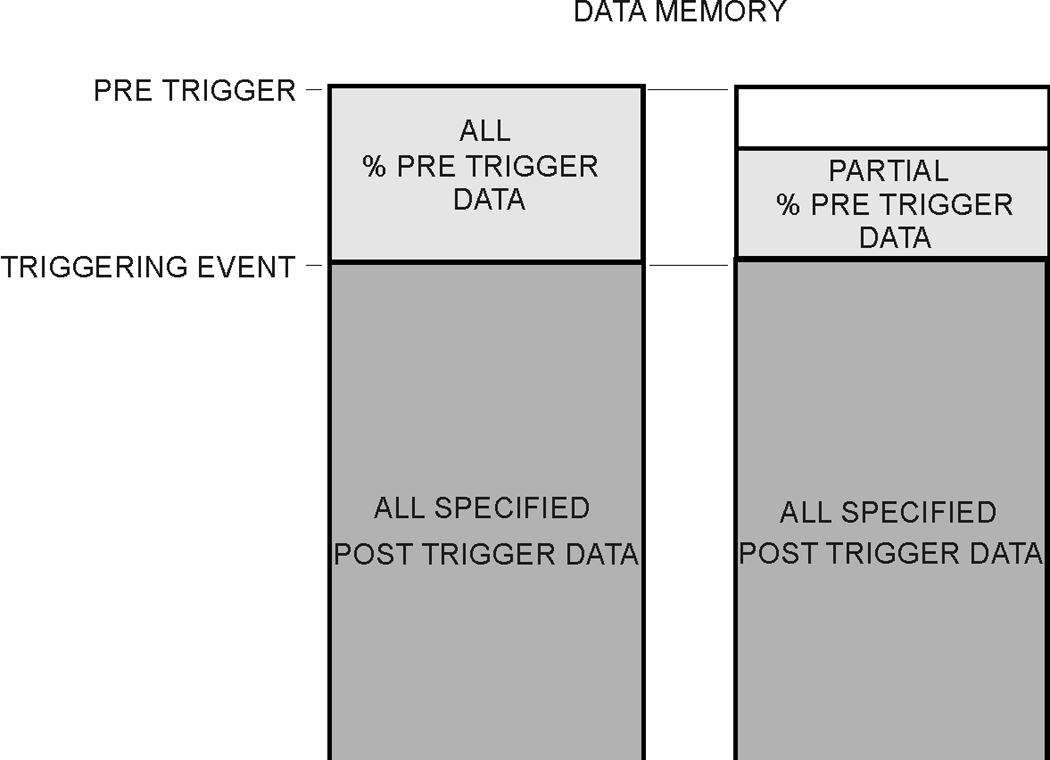
In certain cases, when one port is recording traffic and filling up the memory much faster than another port, you might see traffic appearing only on one port for a while, and the other port's traffic will only appear later. This occurs as a function of the trigger position, and is normal, expected behavior of the analyzer.