
Use the Session Control pane to start and stop a recording. There is also a session status pane that shows the current status of the session.
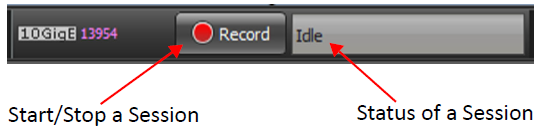
Snapshot Mode is the default mode of operation of the analyzer; Event Trigger Mode allows the user to set an Event Trigger and allows control over the timing of the recording of data.
Snapshot Mode Recording
When Idle displays in the Session Status Pane (SSP), the analyzer is waiting to start recording and is not recording or saving data.
-
Click Record. You might see a warning message depending on the state of the analyzer.
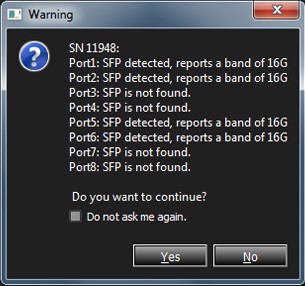
Warning Message -
Click Yes to Start Recording a Trace.
-
Wait for the buffer to fill with raw data.
In Snapshot mode, when Record is clicked, the analyzer is automatically triggered, the Record button turns into a Stop button, and the status is Recording (the analyzer is storing the data in a local buffer).
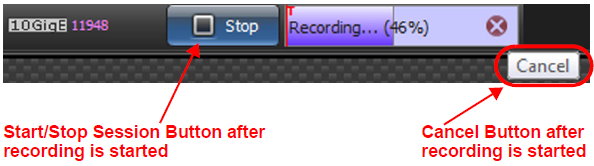
Note: The Cancel button terminates recording. No trace data is stored.
The Stop button makes the analyzer stop recording data and move automatically to the next step in the sequence, Indexing.
-
When the buffer is full, the analyzer processes the data and the SSP displays Indexing.
Recording continues within the limits set by the buffer size. When the buffer is full, recording stops and the analyzer starts turning the raw data into a meaningful database.
When Indexing displays, it means the application is creating an index of the captured Trace data while it still resides in the recording memory buffer. This functionality is a necessary preparation stage for opening the Trace in Quick View mode.
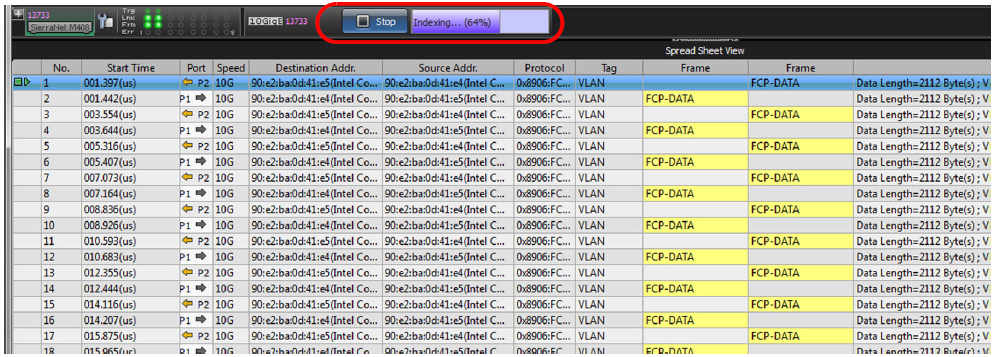
After the data is Indexed, the Record button turns on, but the Session Status Panel says Trace is not Saved. When Trace is Not Saved displays, this means that the trace is opened for viewing in Quick View mode, but it has not been saved to disk.

You can store the processed data for later use or discard the trace by starting a new recording.
To save the trace:
-
Go to File > Save Trace As. The Save As window opens, where you can name the file and choose where to save it.
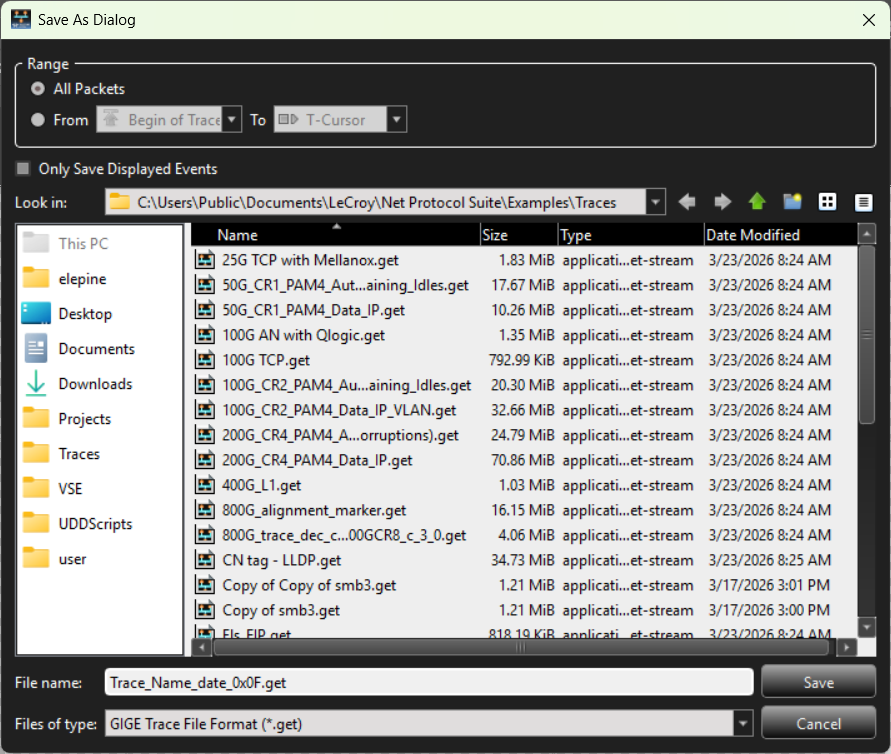
Saving a Trace File on the Host Computer
-
The analyzer saves Trace data to the Host Computer. When Saving is displayed, this means the trace is being saved from the analyzer recording memory buffer to a file on the host PC.
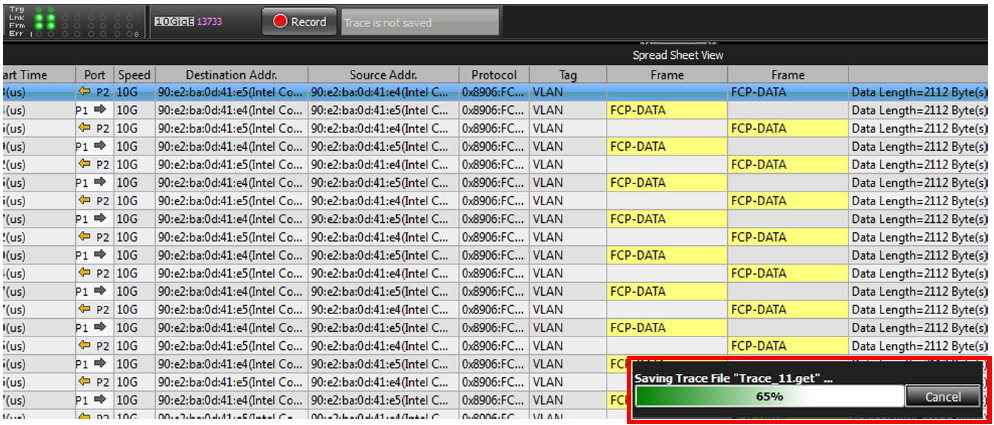
-
Once the trace is saved, you can start the process over again.
Event Trigger Mode Recording
The sequence for Event Trigger Mode is:
-
Define an Event Trigger (define an event and define where in the buffer memory it will occur).
Recording continues in a circular manner within the limits set by the buffer size until an Event Trigger is detected that meets the conditions specified in the Triggering Options and the defined amount of data has been recorded after the Event Trigger.
-
The analyzer is waiting to start recording (Idle). Click the Record button.
-
Wait for the Event Trigger to occur. While it is waiting for the Event Trigger, the analyzer is recording raw data and the Status Pane displays Waiting for Trigger.
Note: If Stop is clicked, the analyzer ignores the Event Trigger, stops recording data, and moves automatically to the next step in the sequence, Indexing.
The Cancel button terminates recording. No trace data is stored.

-
The Event Trigger occurs. Trigger LEDs turn on and the analyzer records data after the trigger. The analyzer continues recording raw data until the buffer is full.
-
When the buffer is full, the analyzer processes the data, and the display shows Indexing. This means the application is creating an index of the captured trace data while it still resides in the analyzer’s recording memory buffer. This prepares the trace to be opened in Quick View mode.
-
After the data is indexed, the Session Status Panel shows Trace is not Saved. This means that the trace is opened for viewing in Quick View mode, but it has not been saved to disk.
You can choose to store the processed data for later use, or to discard the trace by starting a new recording.
Recording Status as Buffer Fills
You can see the buffer being filled in the following images.


Save Trace As
-
To save the Trace, click File > Save Trace As.
-
The save window opens. Rename the file and choose where you want to save it, if needed.
-
When you are finished, click Save.
Save Trace As File on Host Computer
-
The analyzer saves trace data to the host computer.
-
You can then start the process over again.
Event Trigger Recording Progress
A red vertical line illustrates the location of the Trigger Position you have selected in Trigger and Filter Settings.
Pre-Trigger progress is indicated by Waiting for Trigger in the field to the left of the Trigger Position.

After the trigger occurs, Recording displays in the field to the left of the Trigger Position indicating the progress of the recording.

To save the file for later use, select File > Save.
Interrupting the Recording Process (Unplugging Cables)
When a captured trace is not saved and the USB cable is removed, the software displays an error message that unsaved traces will be closed. If you ignore the message and again plug in and unplug the USB cable, the software might get into an unstable state.
When the Ethernet cable is removed, the application detects the event after a delay of approximately 2.5 to 3 minutes. During this delay the device status remains ready and an attempt to capture a trace might result in error messages such as: “PCI configuration failed”, or “HAL error”. If this occurs, you need to power cycle the analyzer to allow detecting the device in the device list and continue capturing.