The Real Time Traffic Profile is a graphical tool, which allows the user to monitor a wide variety of traffic on the bus and manipulate the display of that information.
To start up a Real Time Traffic Profile:
-
Open a new Project: From the Main Menu, select File > New Project.
-
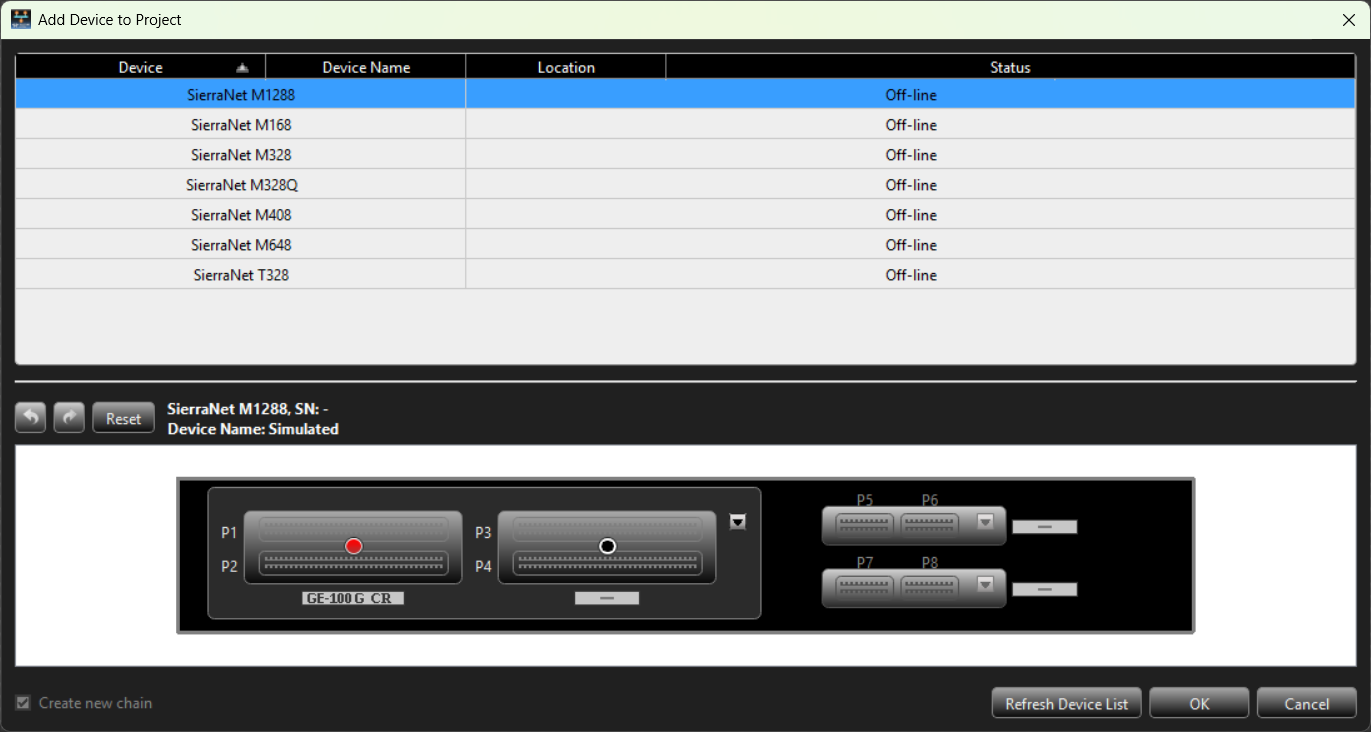
The Add Device To Project window appears. In this example, an M408 Analyzer is available to add to the Project.
-
Click the small arrows in the bottom pane of the screen to assign ports, then click OK. The Main Menu updates to show the device is connected.
Real Time Statistics
Select the Real Time Statistics icon to open the GUI.
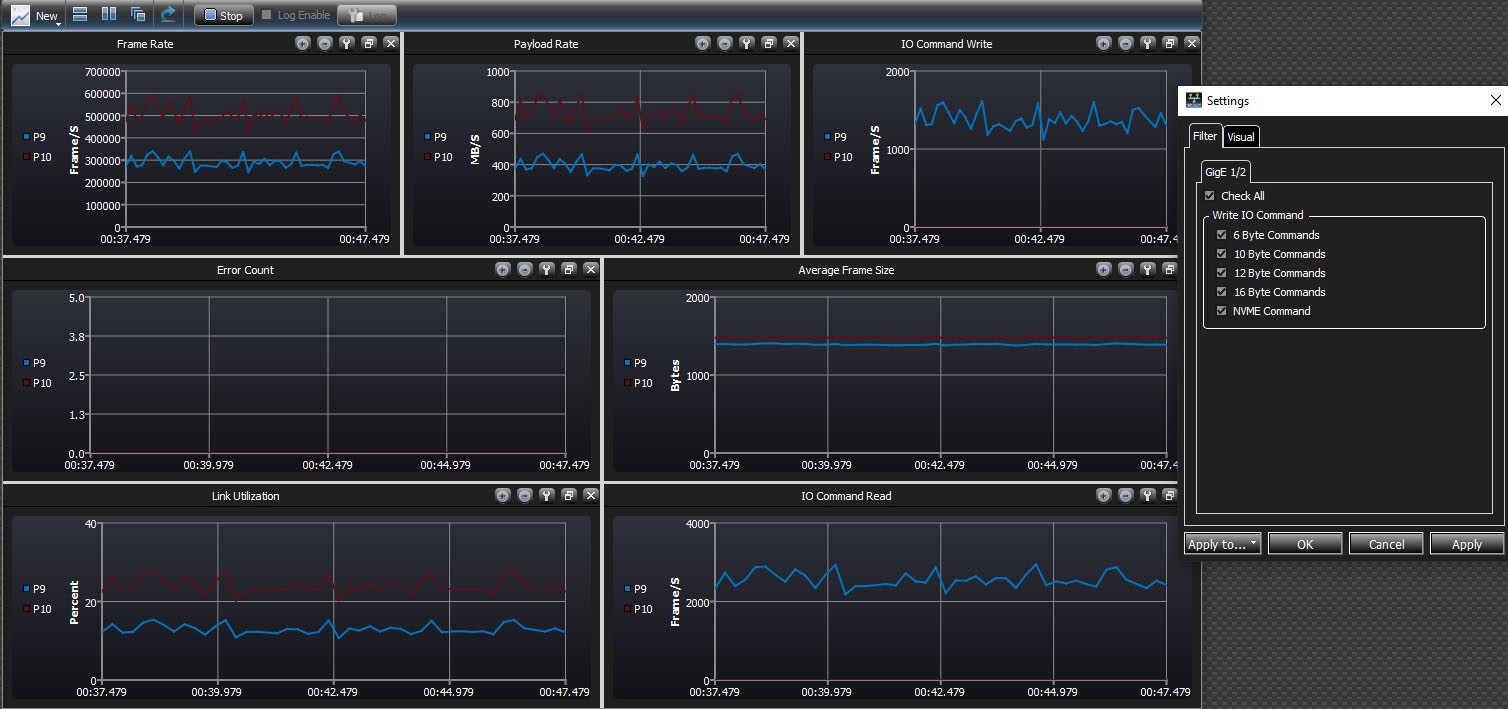
By default seven panes are displayed:
-
Frames Rate
-
Payload Rate
-
IO Command Write
-
Error Count
-
Average Frame Size
-
Link Utilization
-
IO Command Read
In this case, we have data being generated and sent to the analyzer. The controls for the Real Time Statistics – Traffic Profile are shown below.

The controls are:
-
New Window
-
Tile Windows (Tile Vertically, Tile Horizontally, Tile Grid)
-
Reset All
-
Start/Stop Displaying Data
-
Log Enable (On/Off)
-
Log (Set location of Log file)
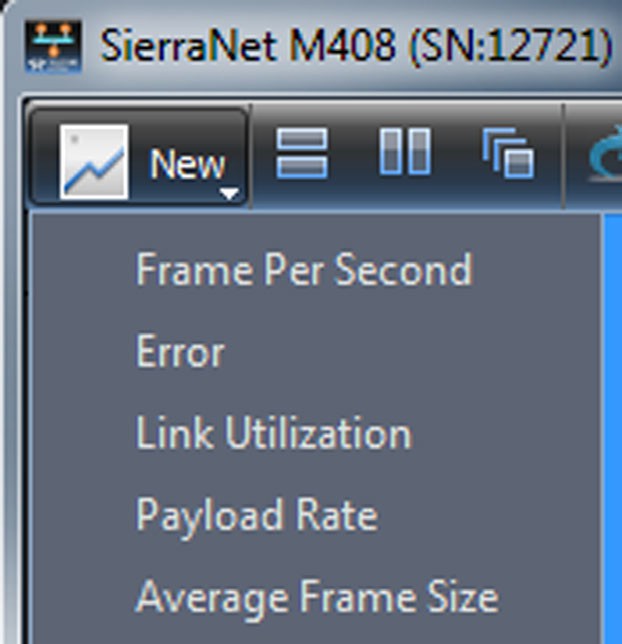
The New Window function allows you to add more of each type of window.
Start Real Time Traffic Display
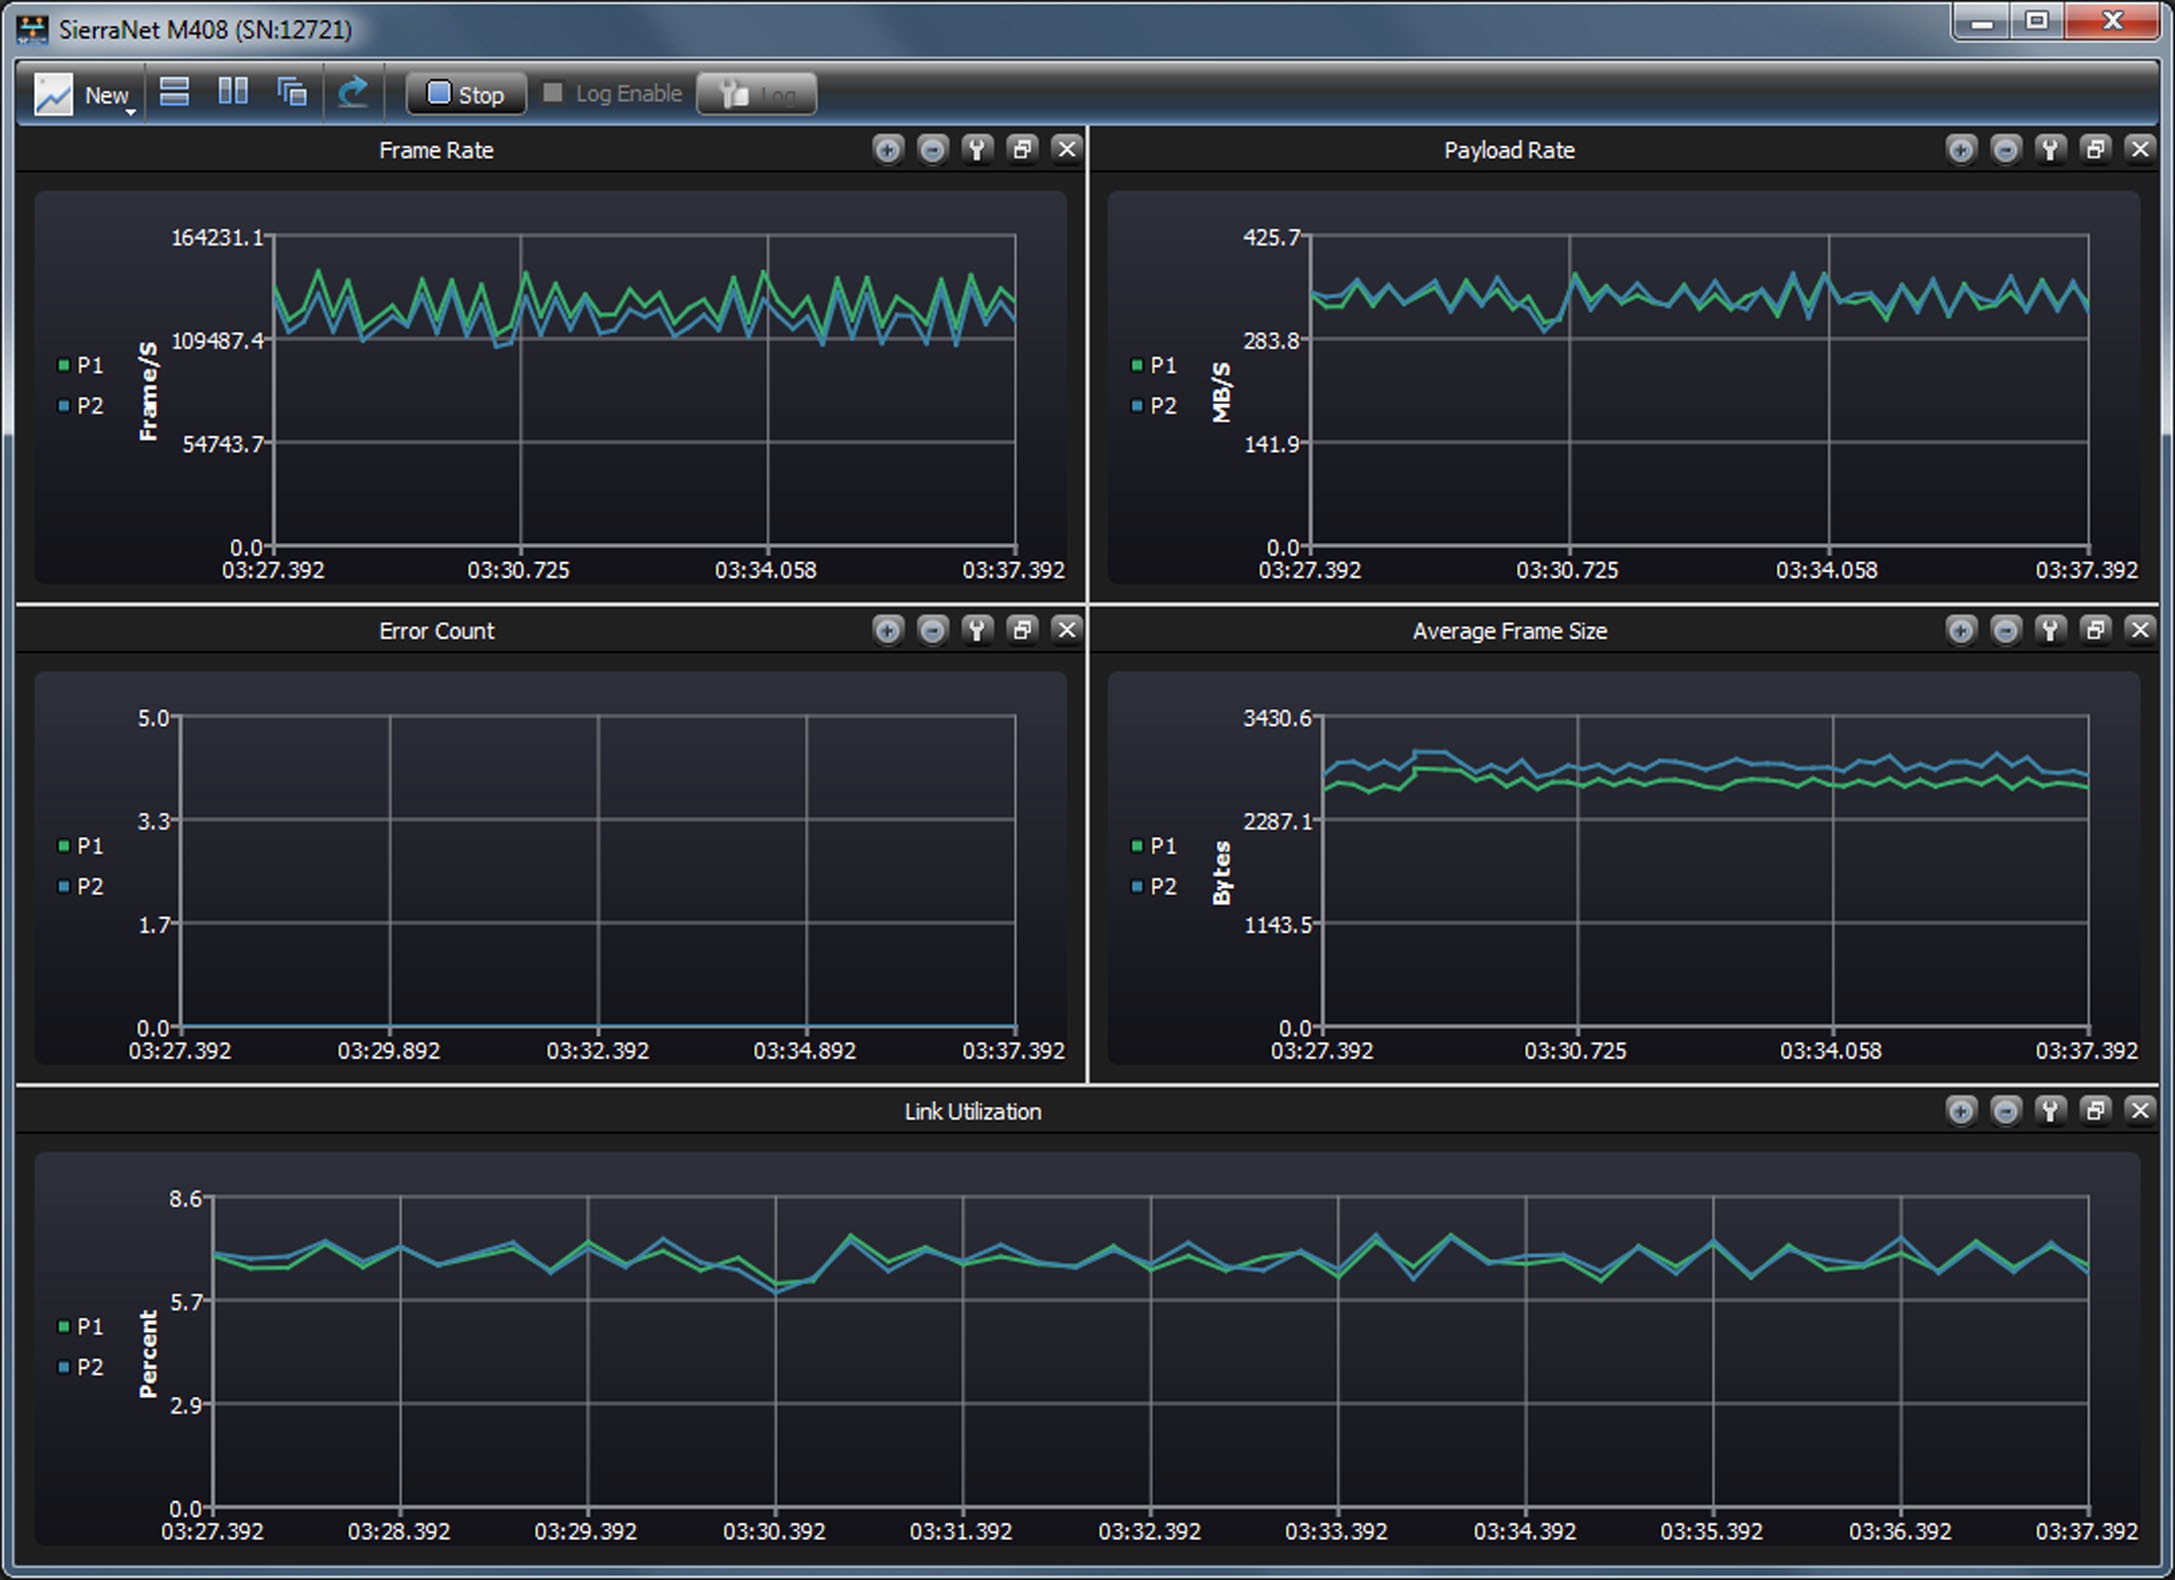
To start the analyzer collecting data: Select the Start icon and each of the windows in the grid display will show filtered activity. In this case we’ve set the Filter to Any Ethernet Frame, so we see a lot of activity and no Errors were detected.
Manipulating Individual Windows
Each window can be docked or undocked from the display. Each window can also be duplicated or deleted. By deleting some graphs and adding others, you can graph individual ports to compare specific parameters.
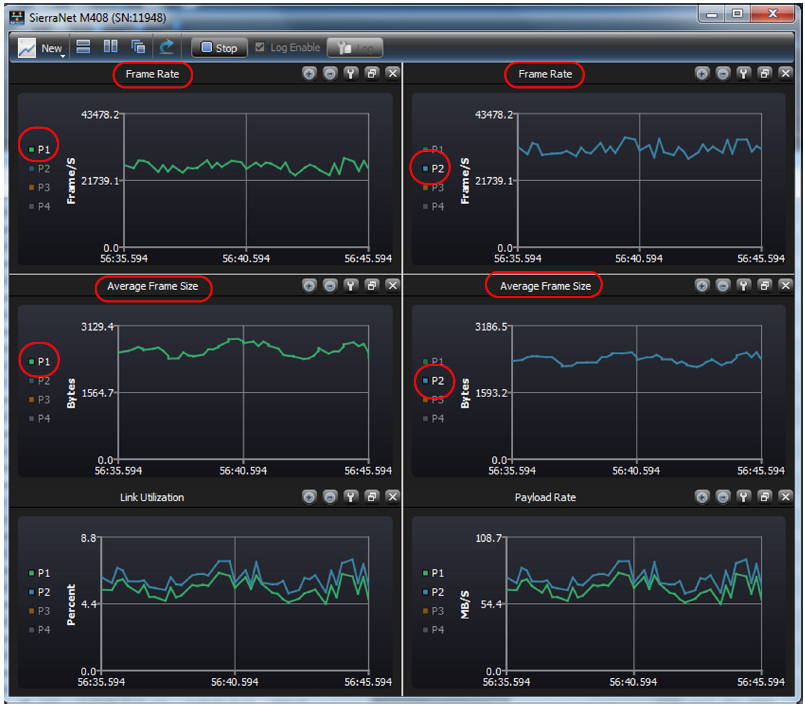
This is just one example of the flexibility of the windows being displayed. You can manipulate the types of traffic being displayed to suit your individual preferences.
Individual Window Controls
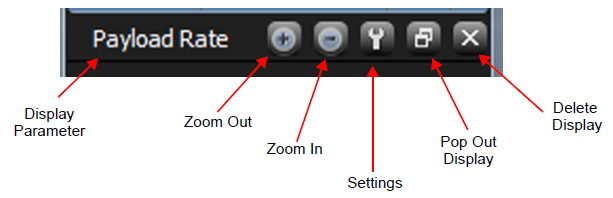
Each window has five control icons:
-
Zoom In
-
Zoom Out
-
Settings
-
Pop Window Out of Current Display
-
Close Current Display
As an example, the controls for Payload Rate are shown below.
Settings – Filter
Settings allows you to set up filters for the traffic you want to see, as well as detect a wide variety of protocol errors. In the display above we can now see that the only Filter Setting is Any Ethernet Frame.
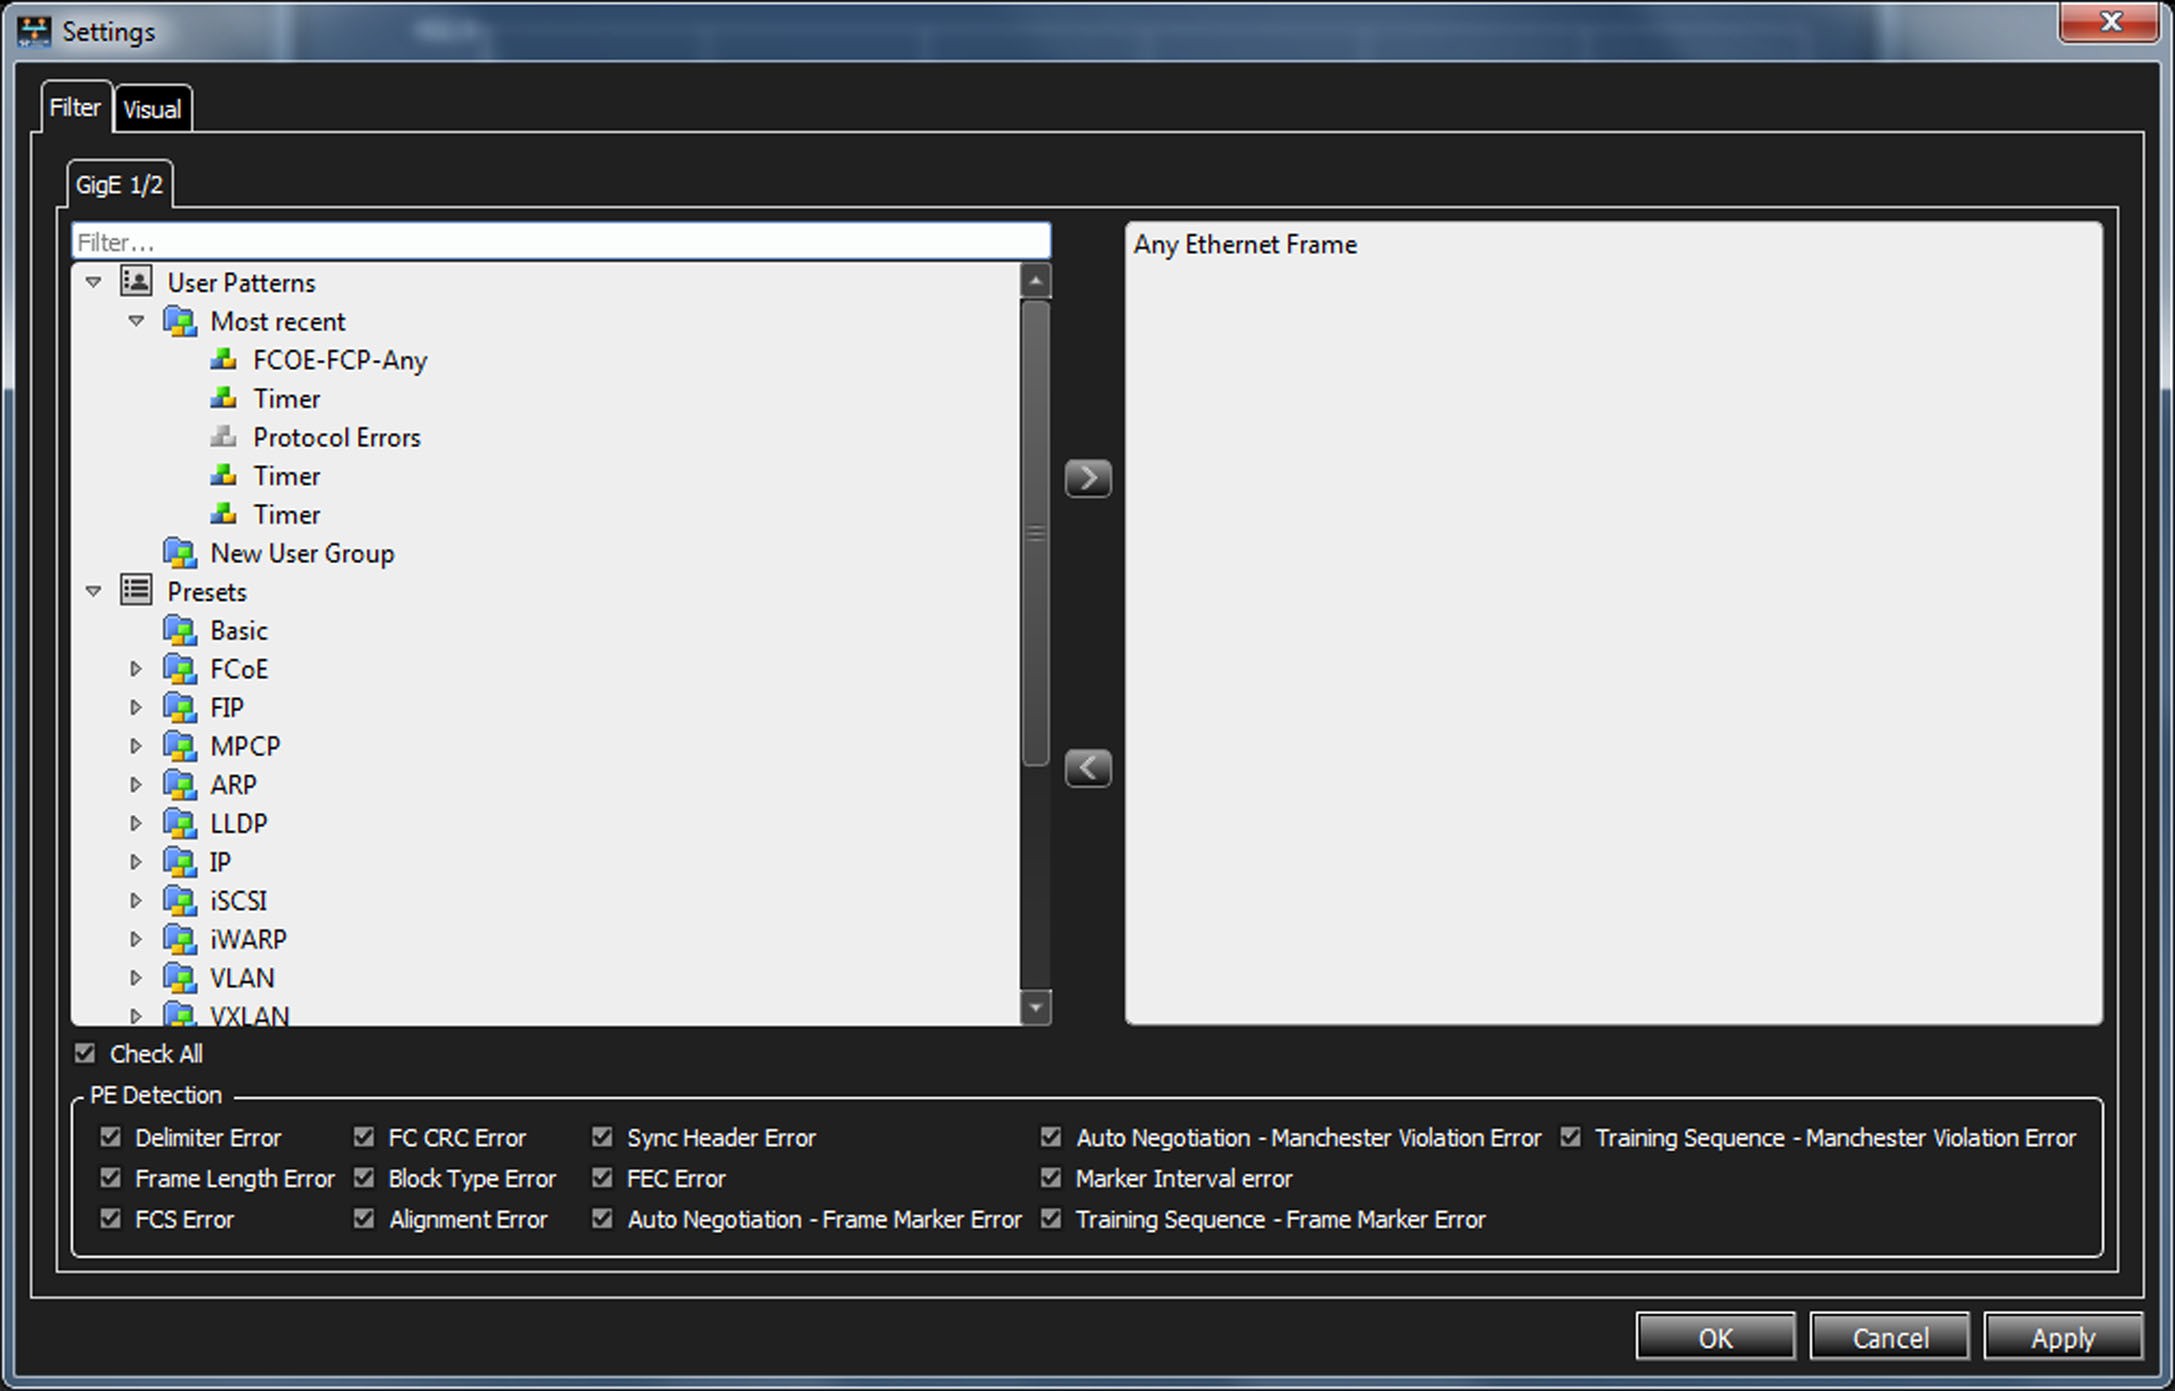
If you don’t know exactly what you want to filter out of the traffic, one method would be to Record a Snapshot of the traffic you’re interested in and use it as a guide for defining your filter.
For example, if you were running SCSI traffic into the analyzer and took a Snapshot.
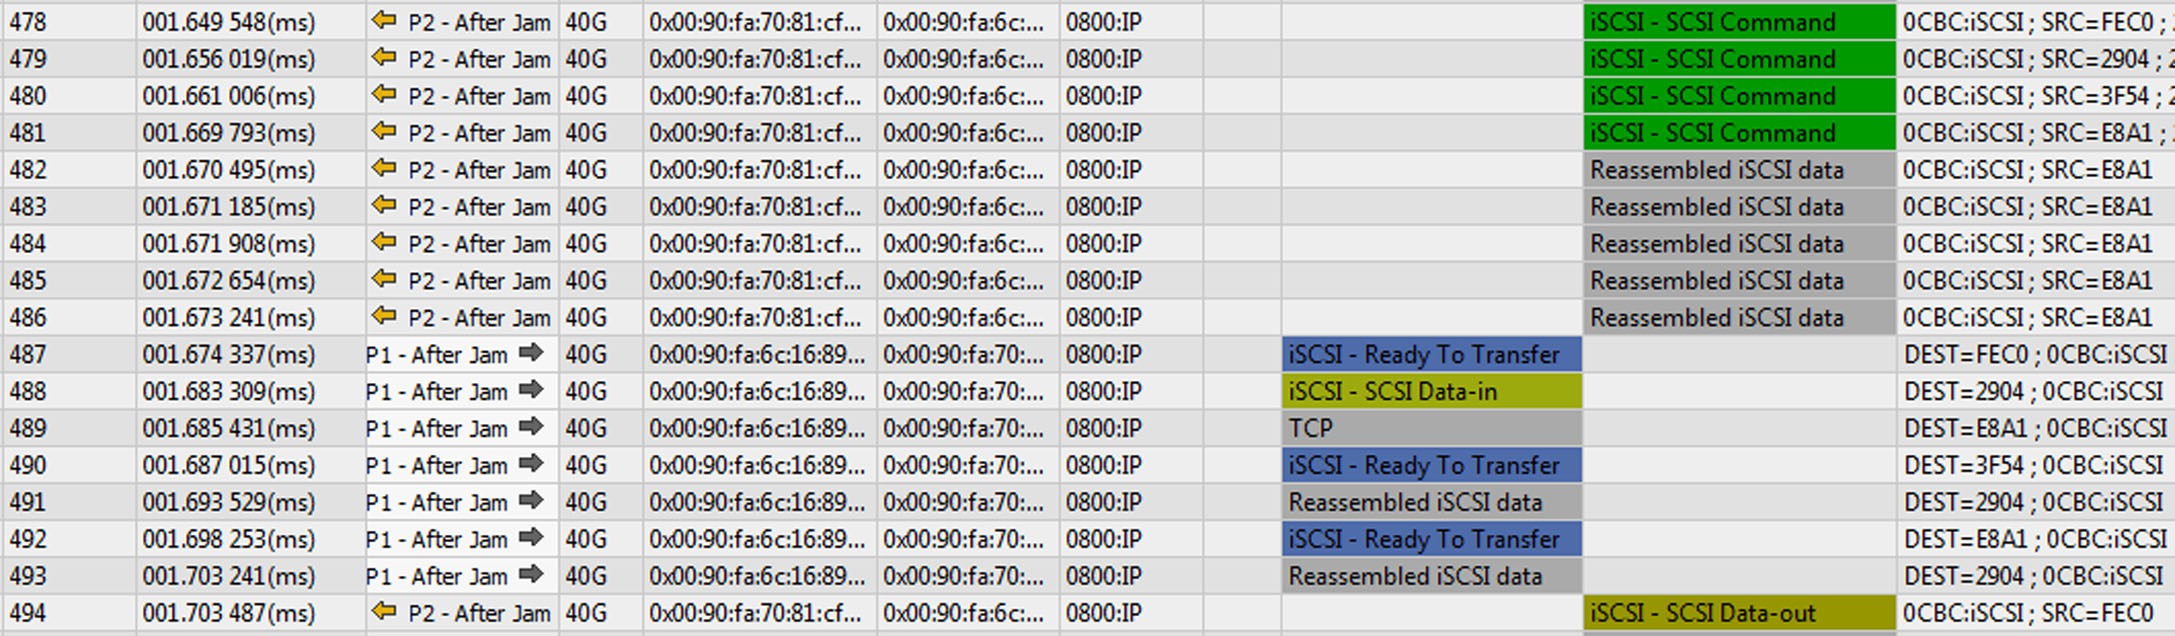
Notice that the traffic is mainly SCSI commands and data on Ports 1 and 2. In the filter window, choose the following filters.
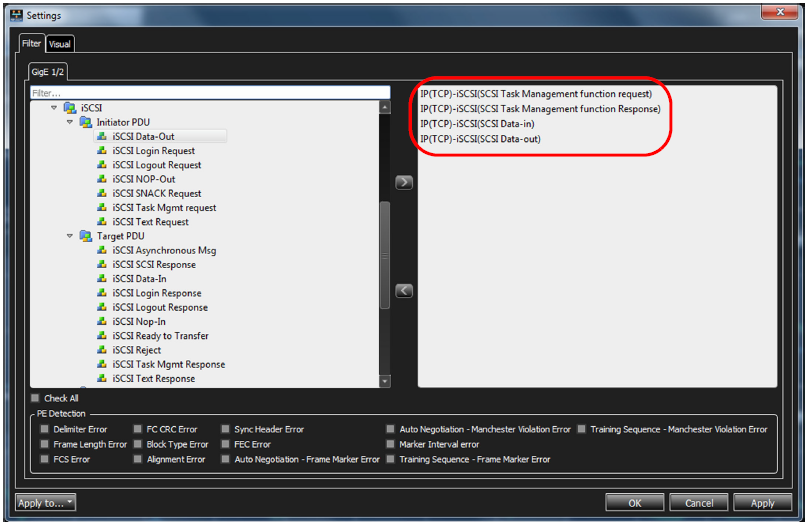
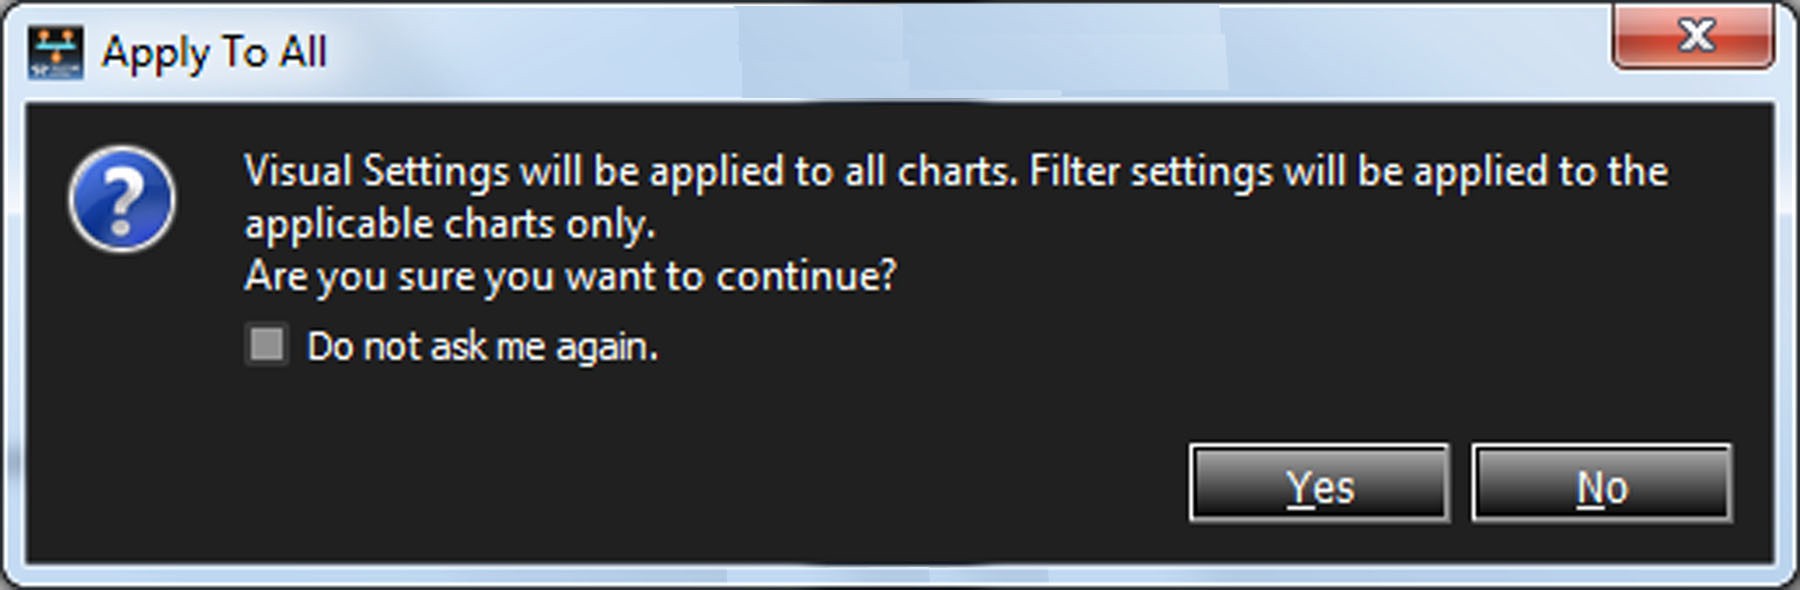
Any time you change either Filter or Visual Settings this Warning message will pop up:
Settings – Visual
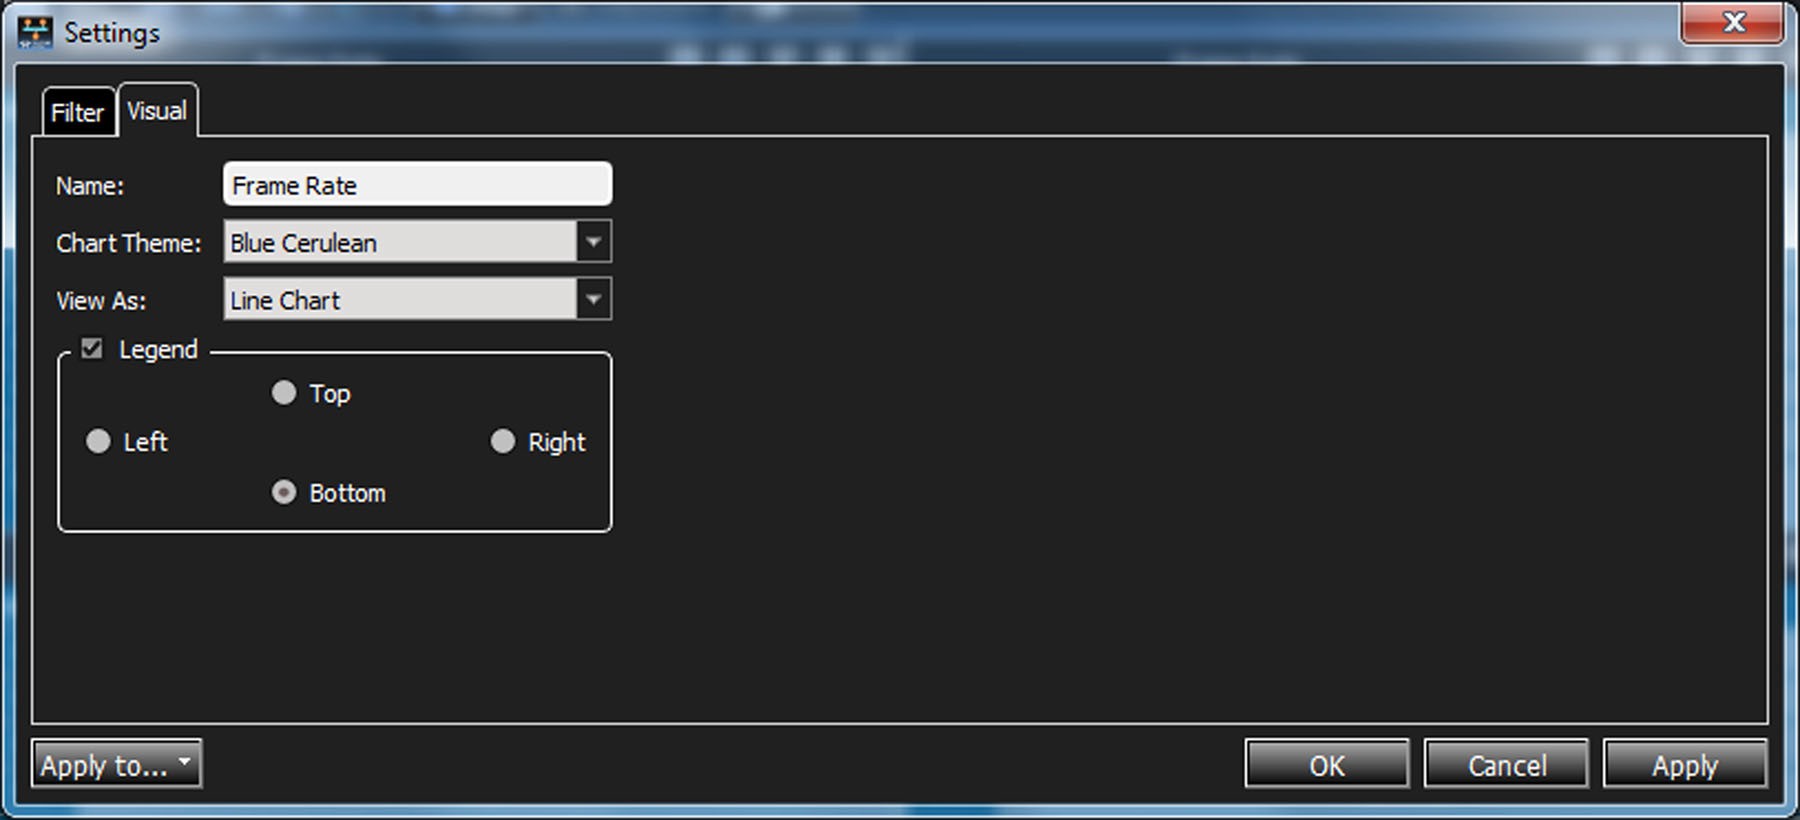
You can also choose Settings – Visual to change the way the traffic is displayed.
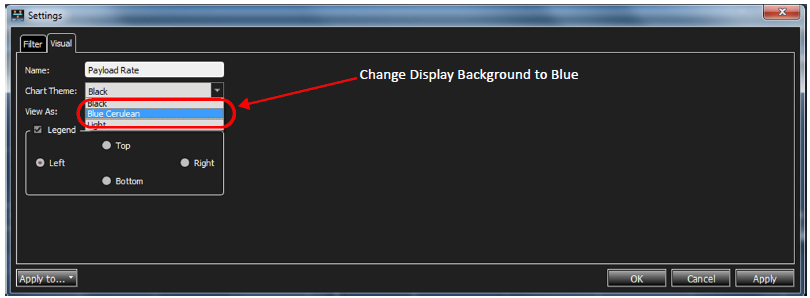
Changing the background to blue is shown below.
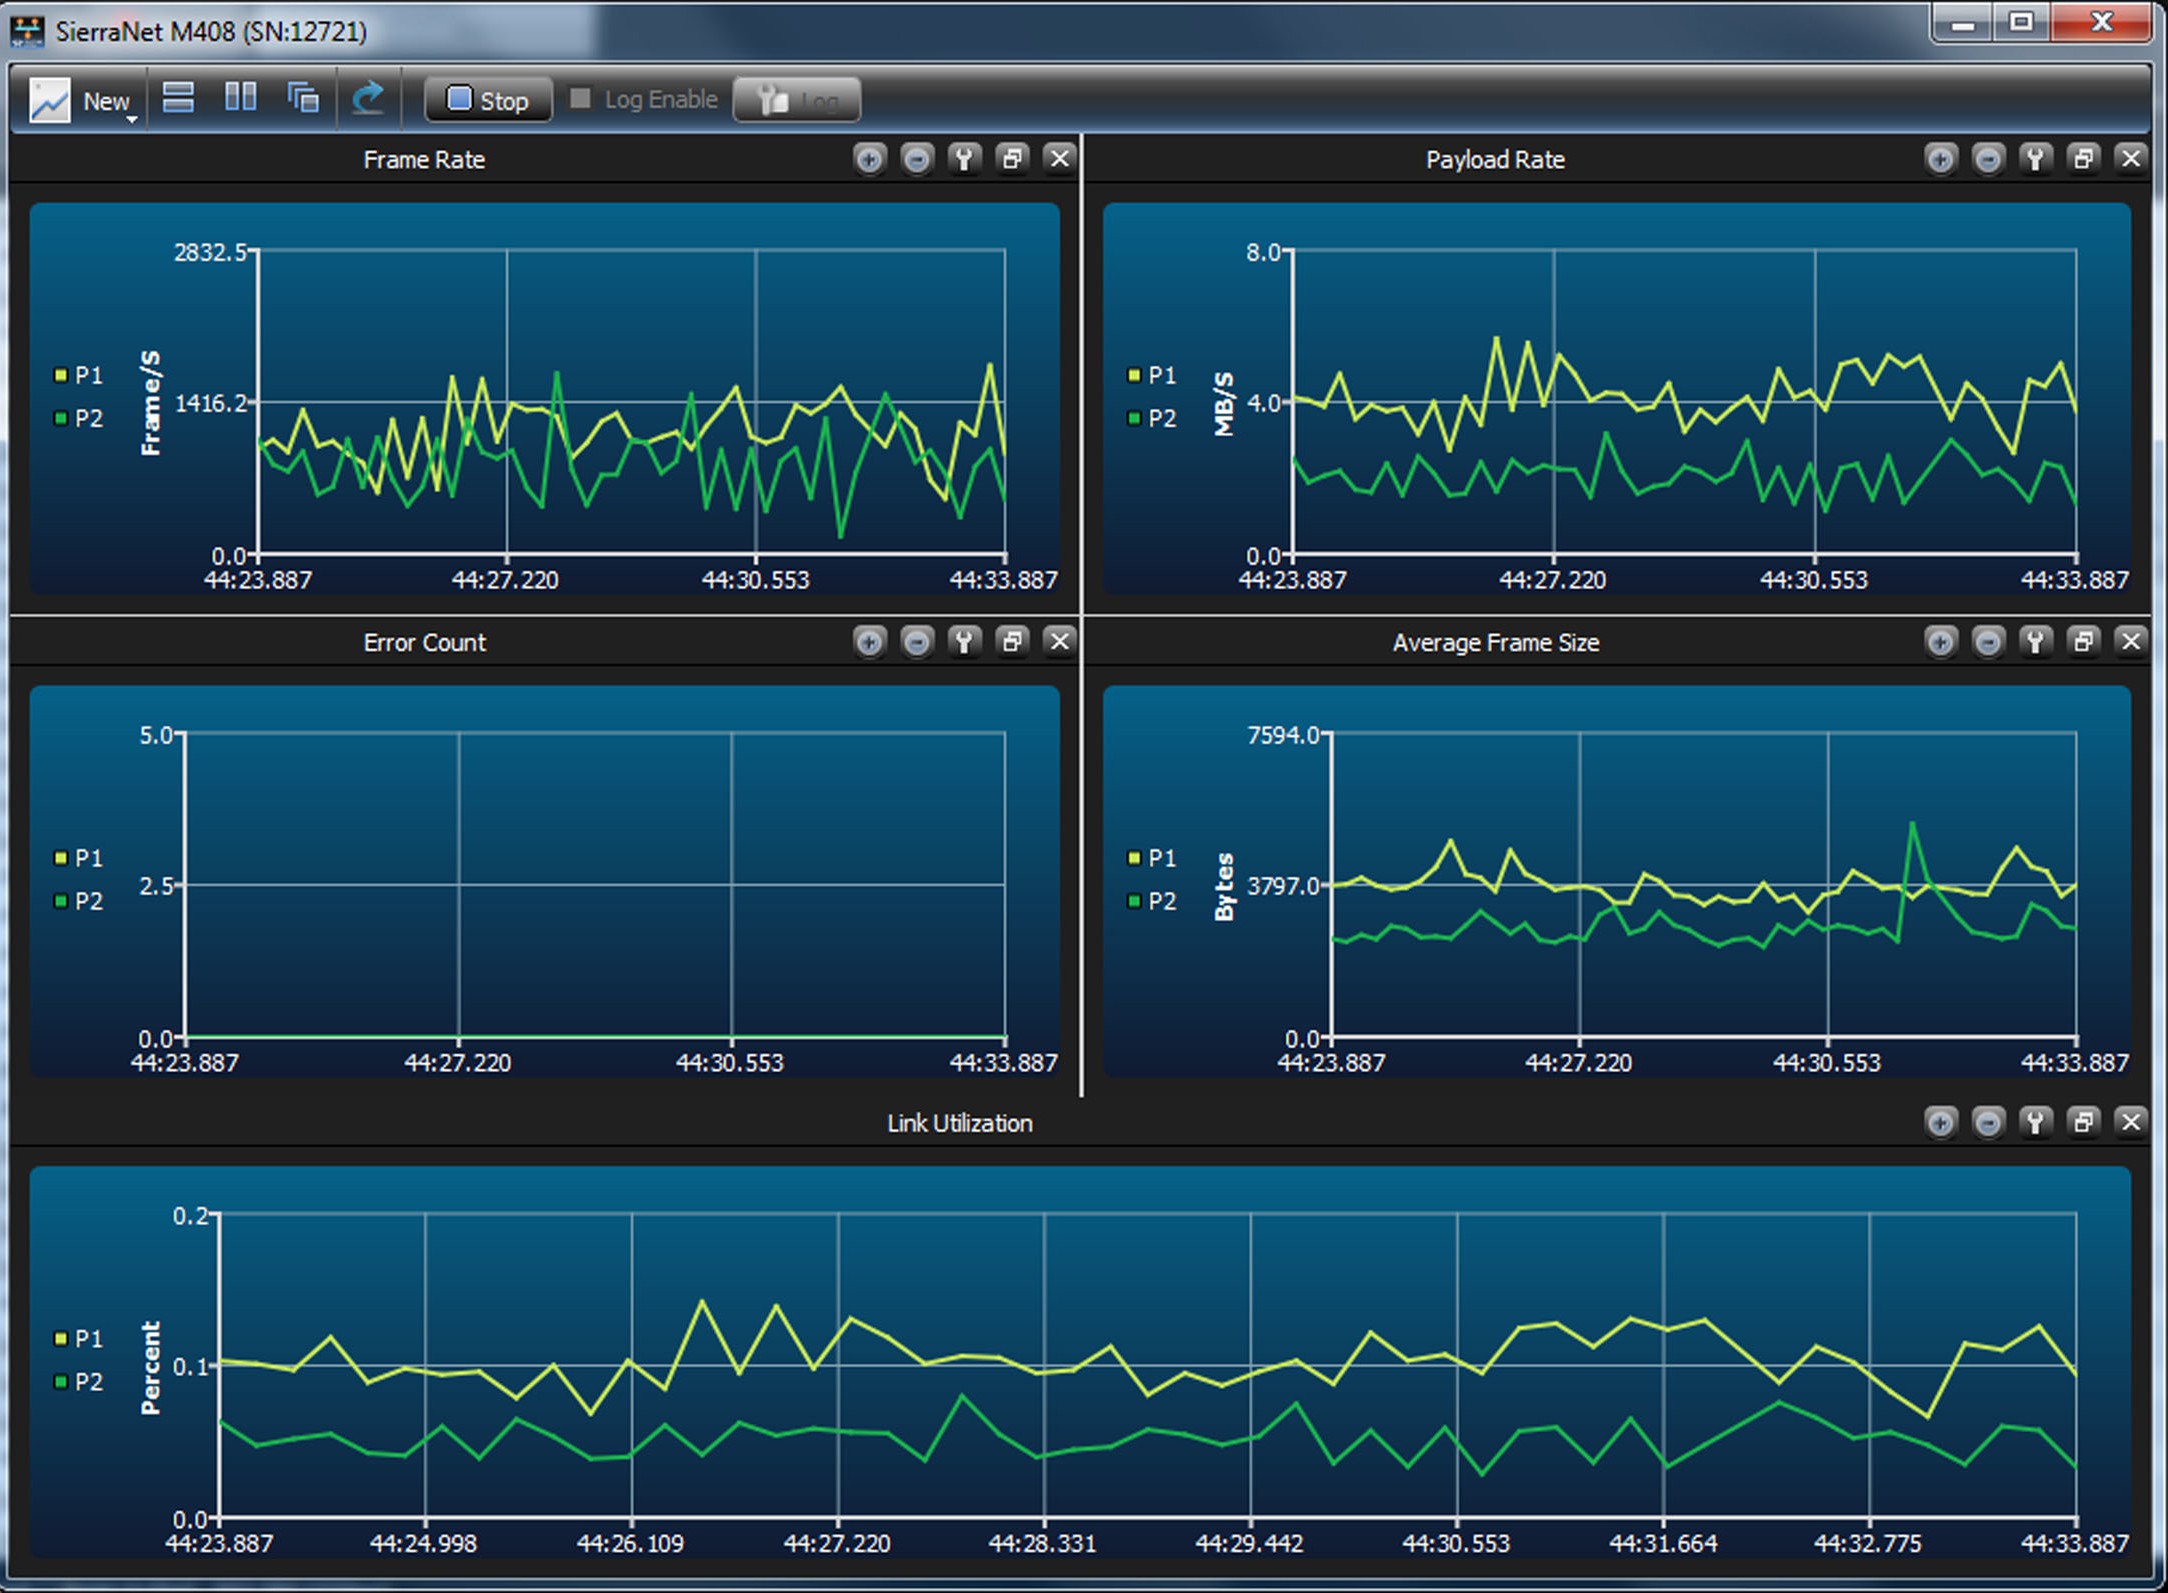
If you compare these graphs with earlier ones, you’ll notice the reduced amount of traffic because of the filters added.
Selecting Light will generate a light colored background for the displays.
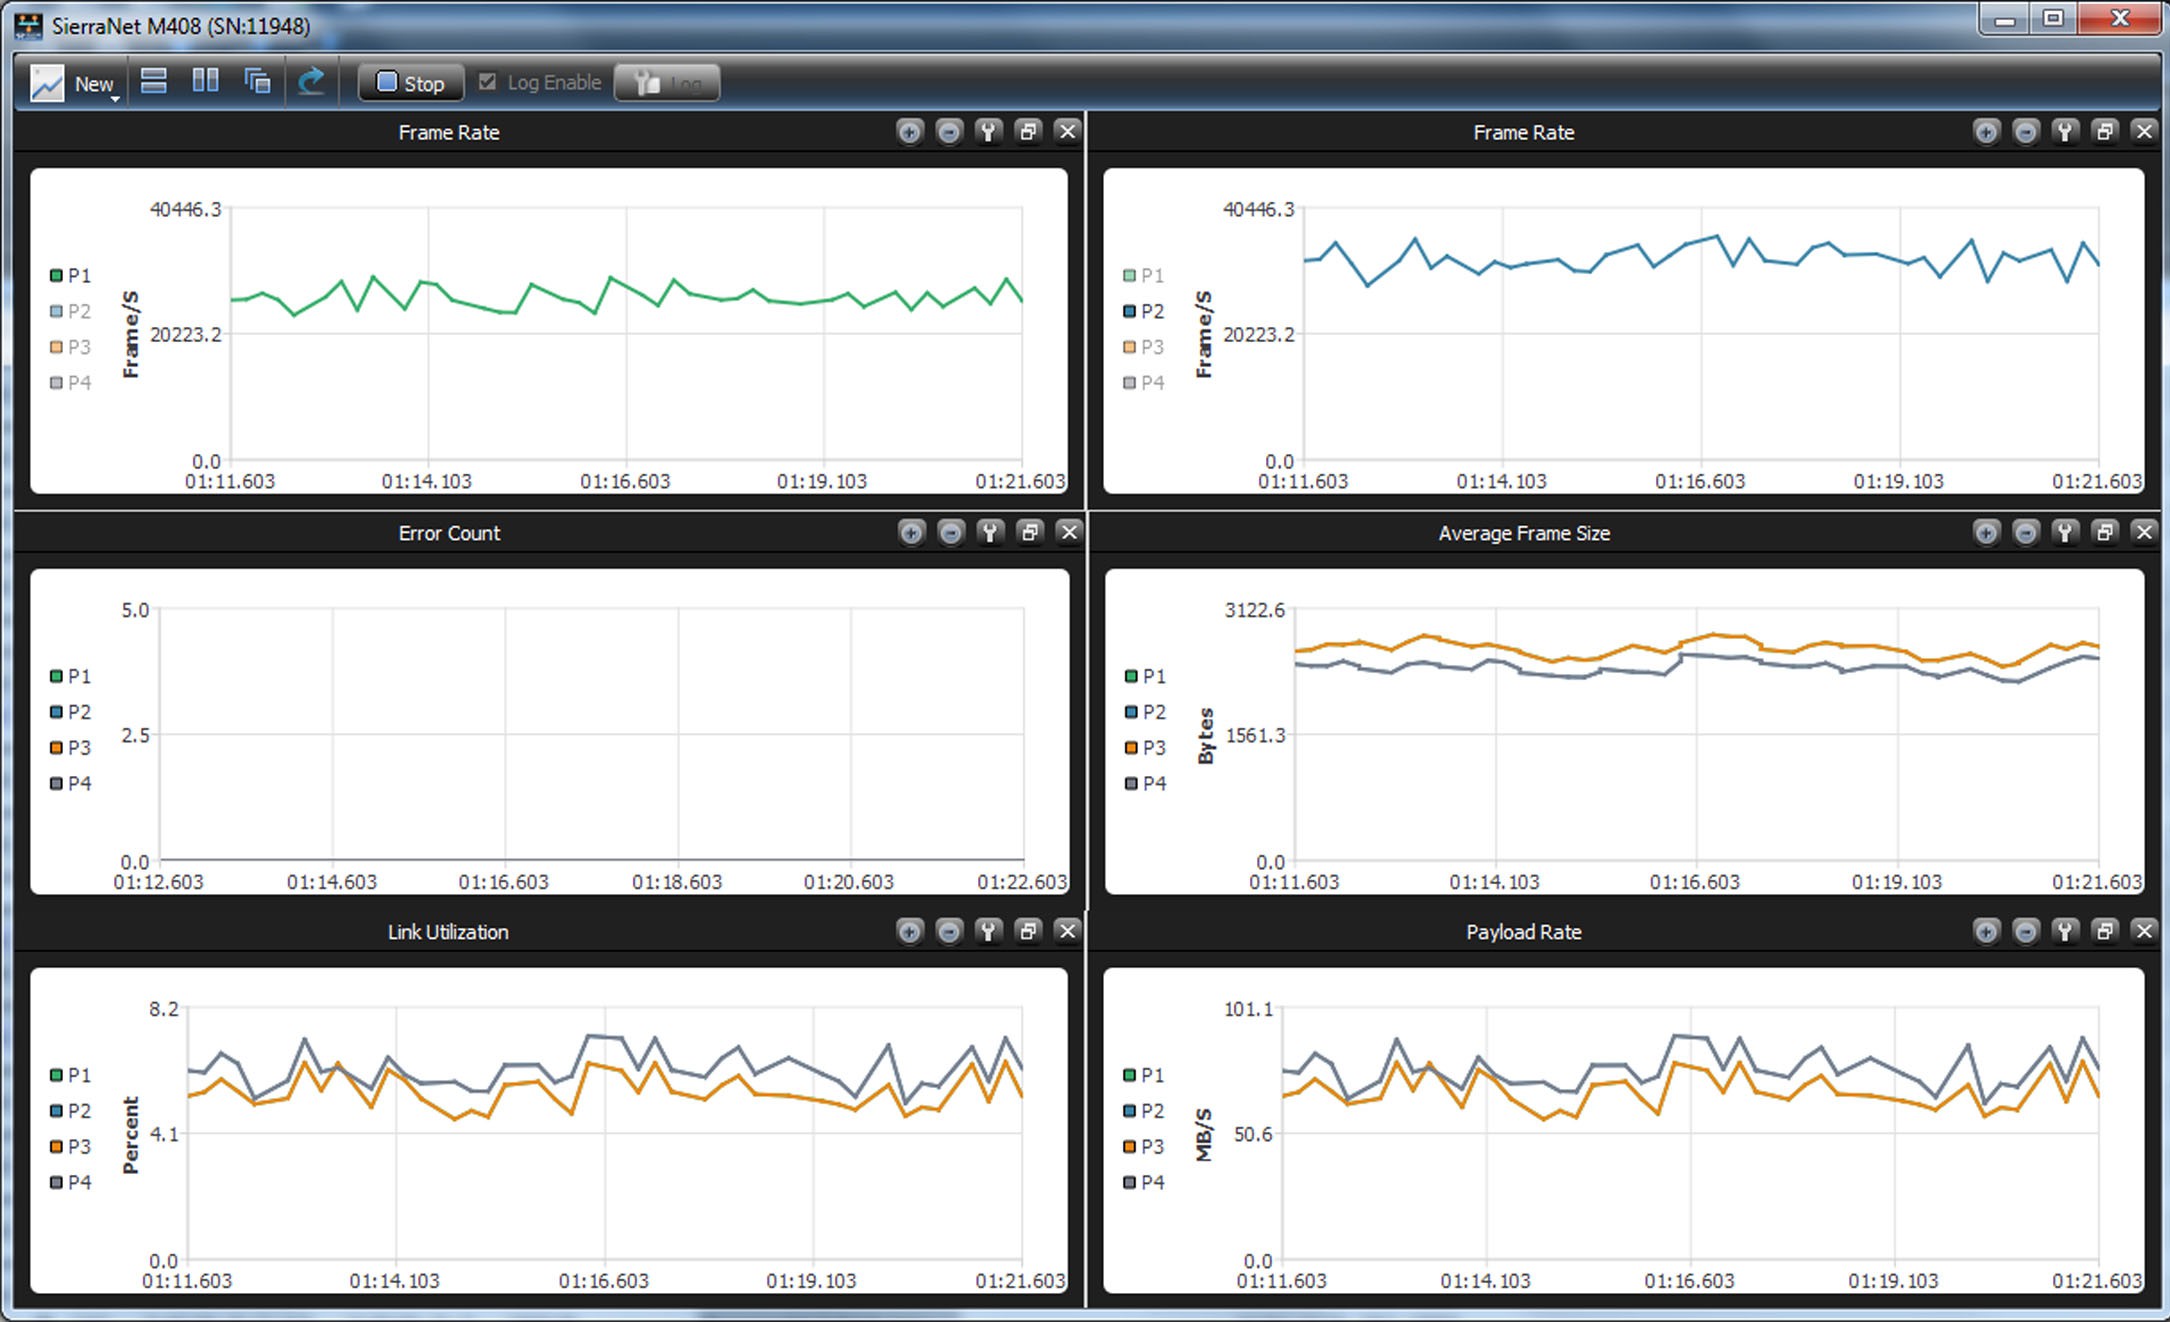
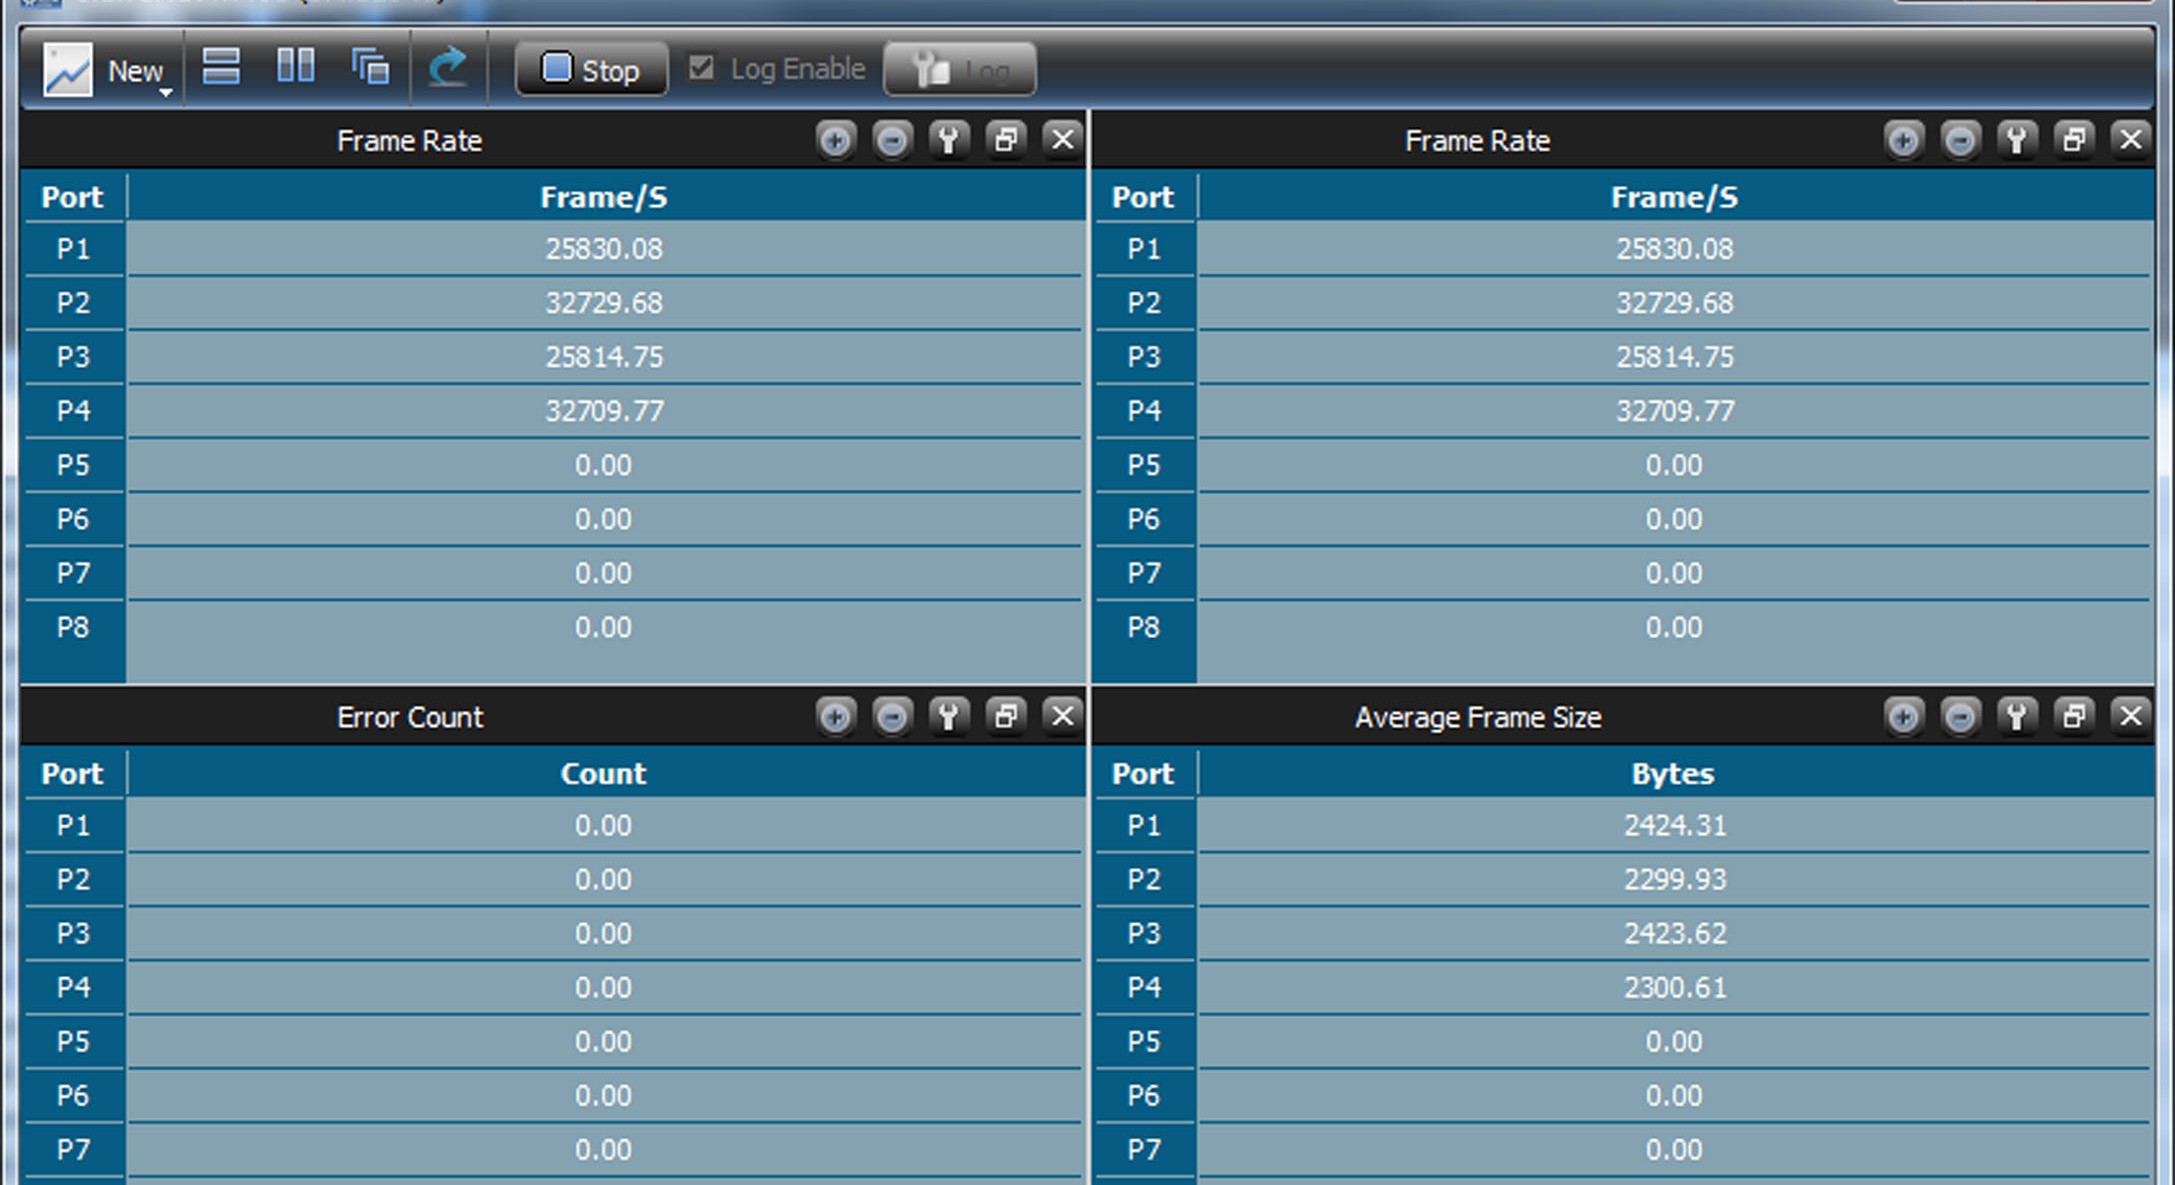
You can also display the traffic in Area Charts or Tables.
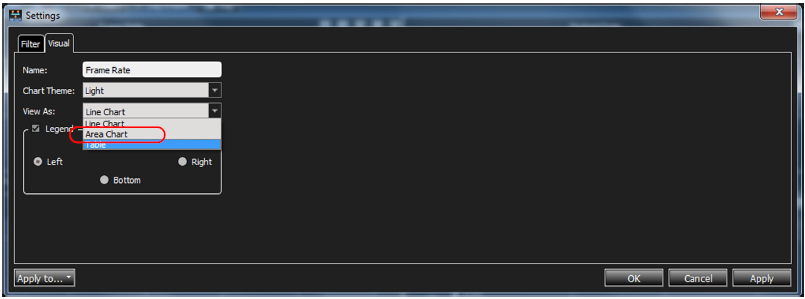
See below for Area Chart displays and Table displays.
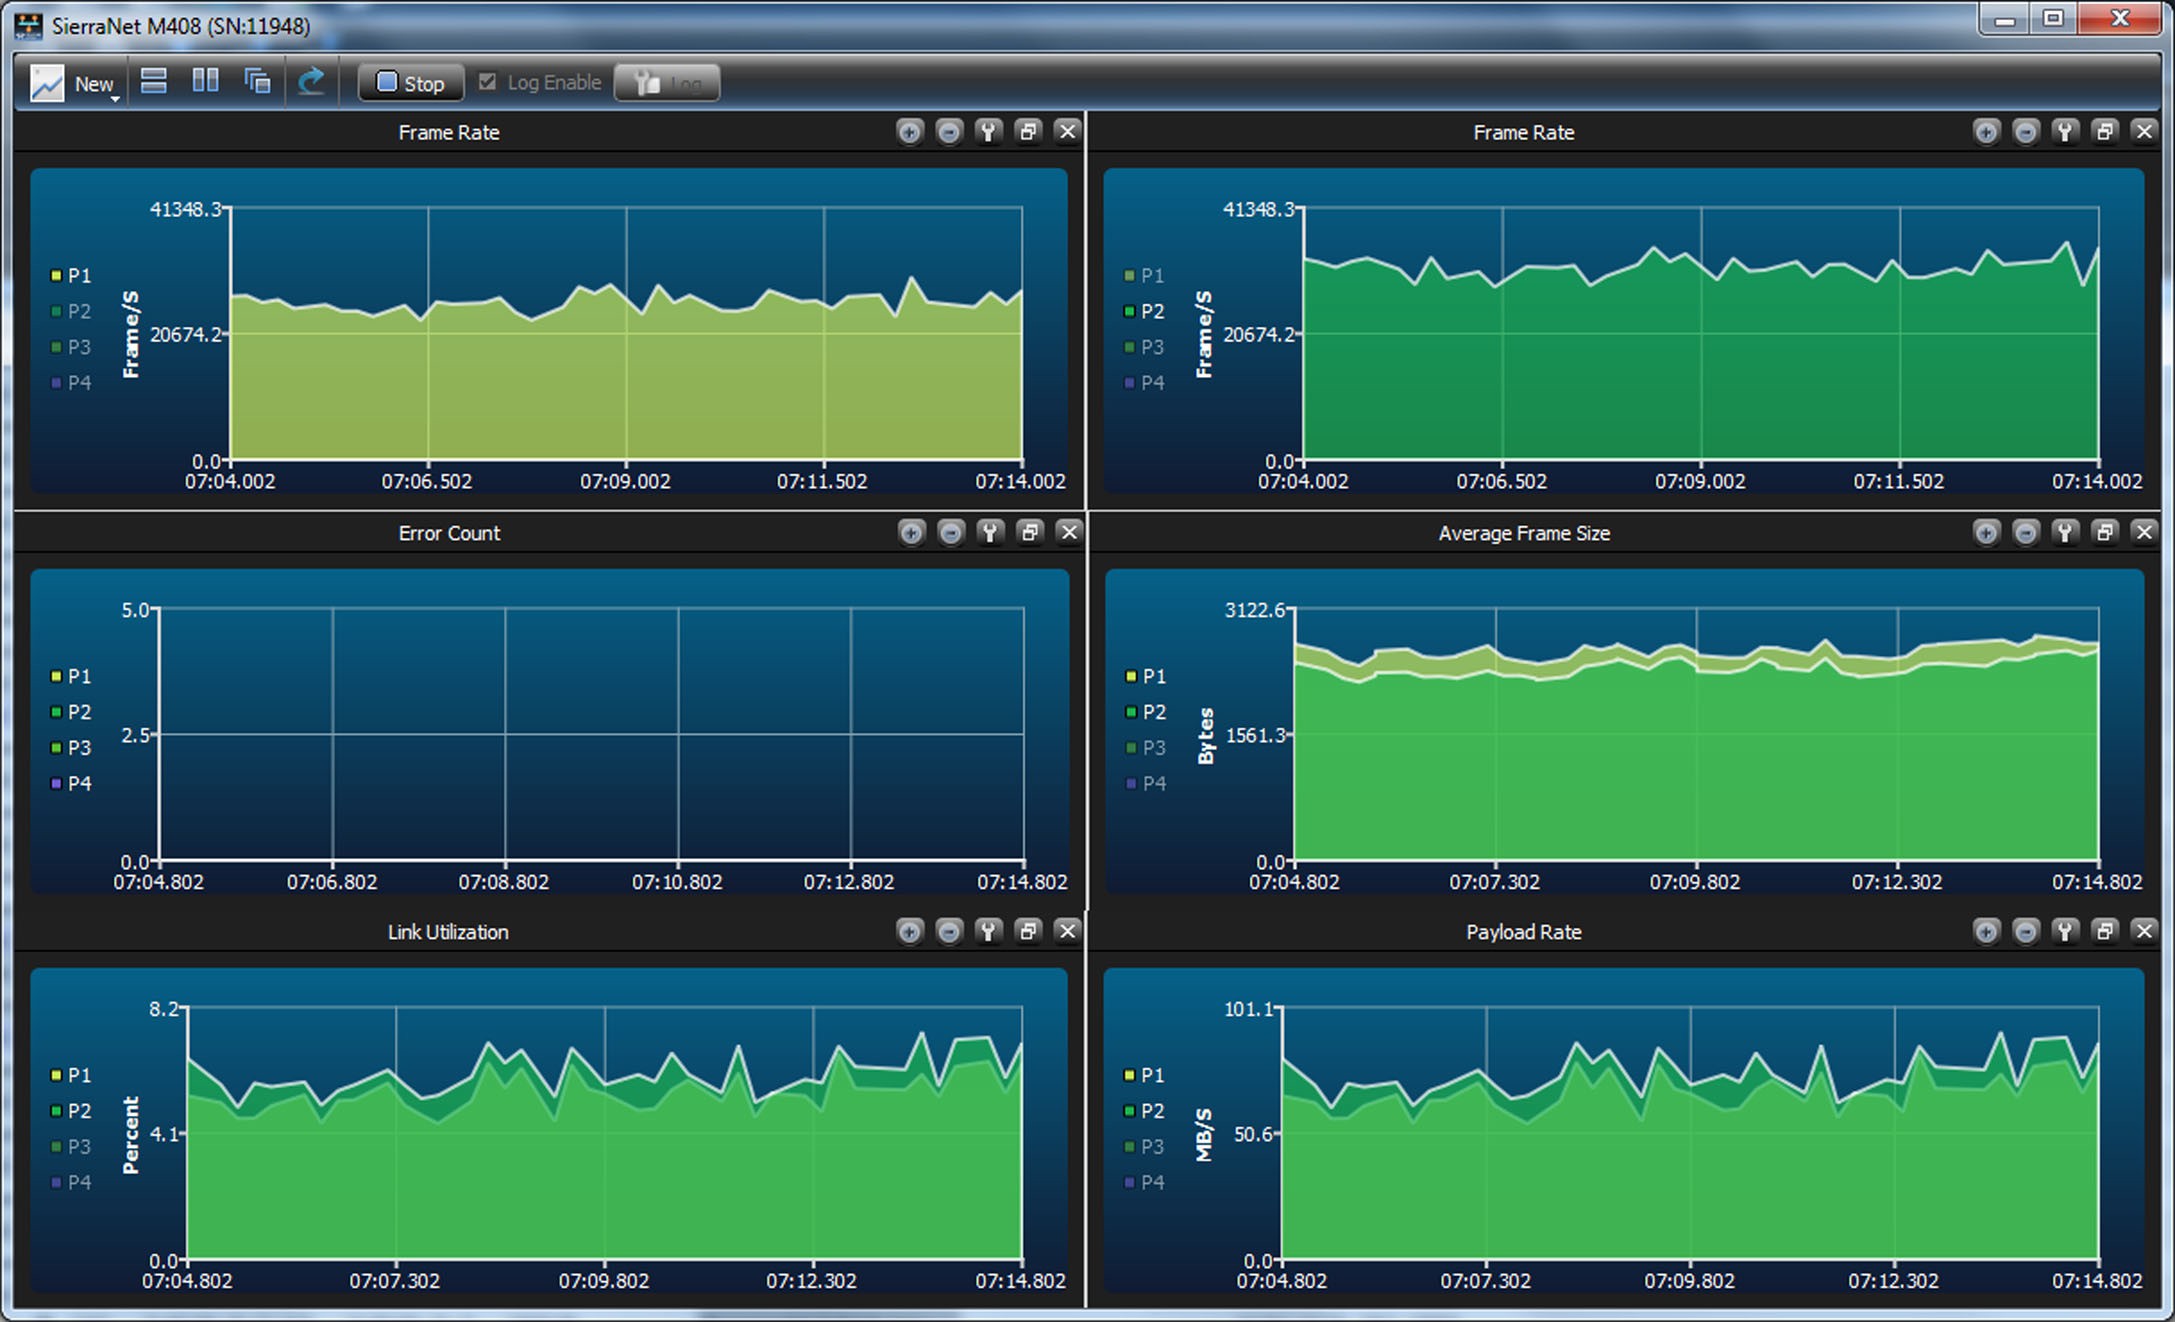
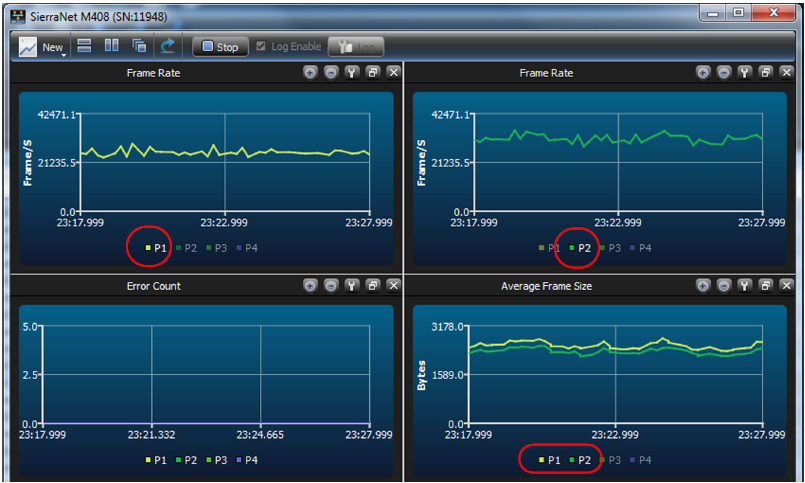
Another option is to change the location of the Legend within each display. In this case, the Legend is the Port Numbers. They can be moved to the Left, Top, Right or Bottom of the display.
The Legends displayed on the Bottom of the Graphs is shown below.
Log Files
Log File Enable: To record the traffic in a log file in CSV format, click the Log Enable button on the Main Toolbar.
Log File Settings: The log file Settings can be changed by selecting the wrench icon
Log File Location: The Location of the default Log File is shown below.
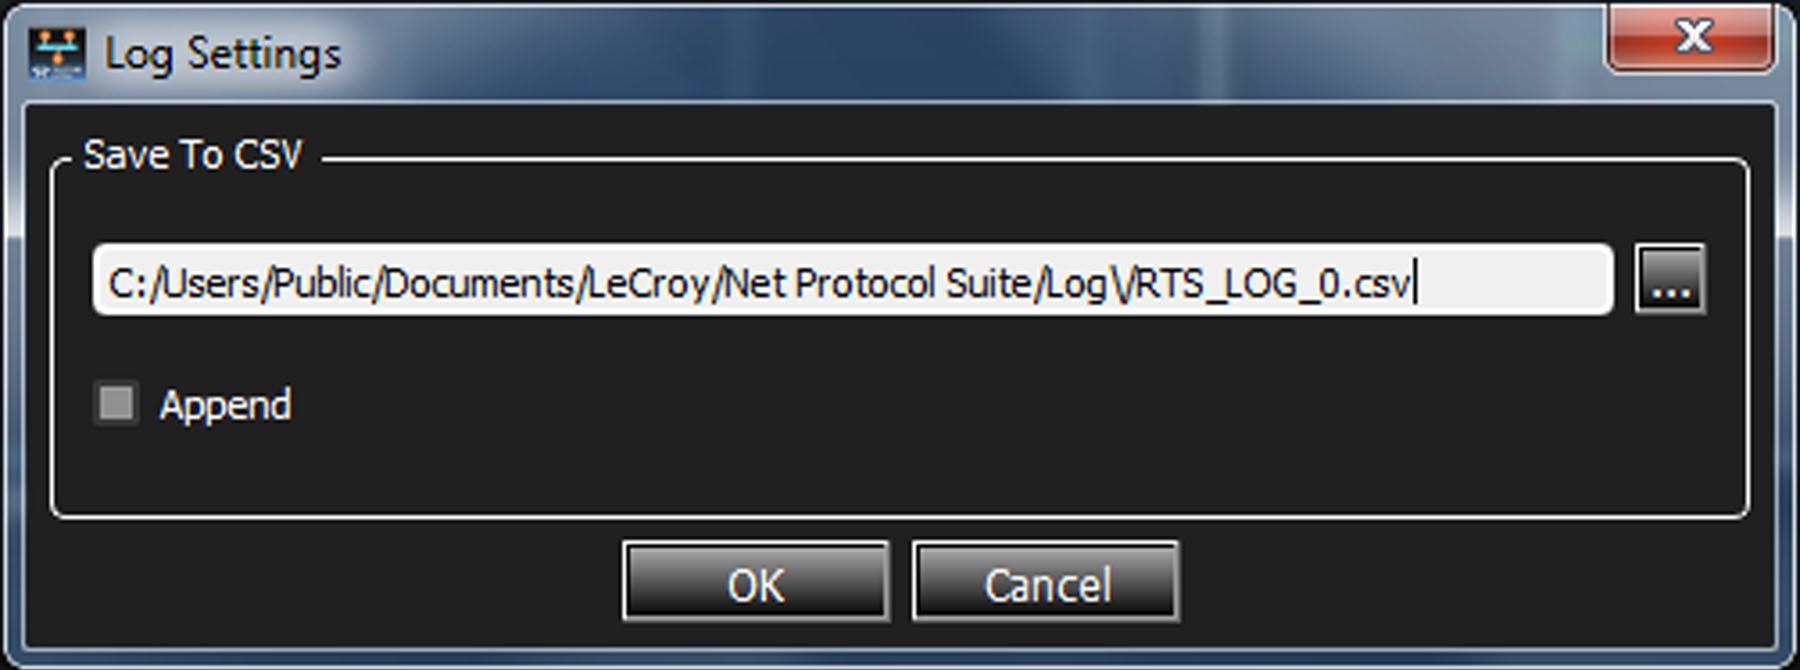
If you click on the “...” icon, the contents of the log file folder will pop up.
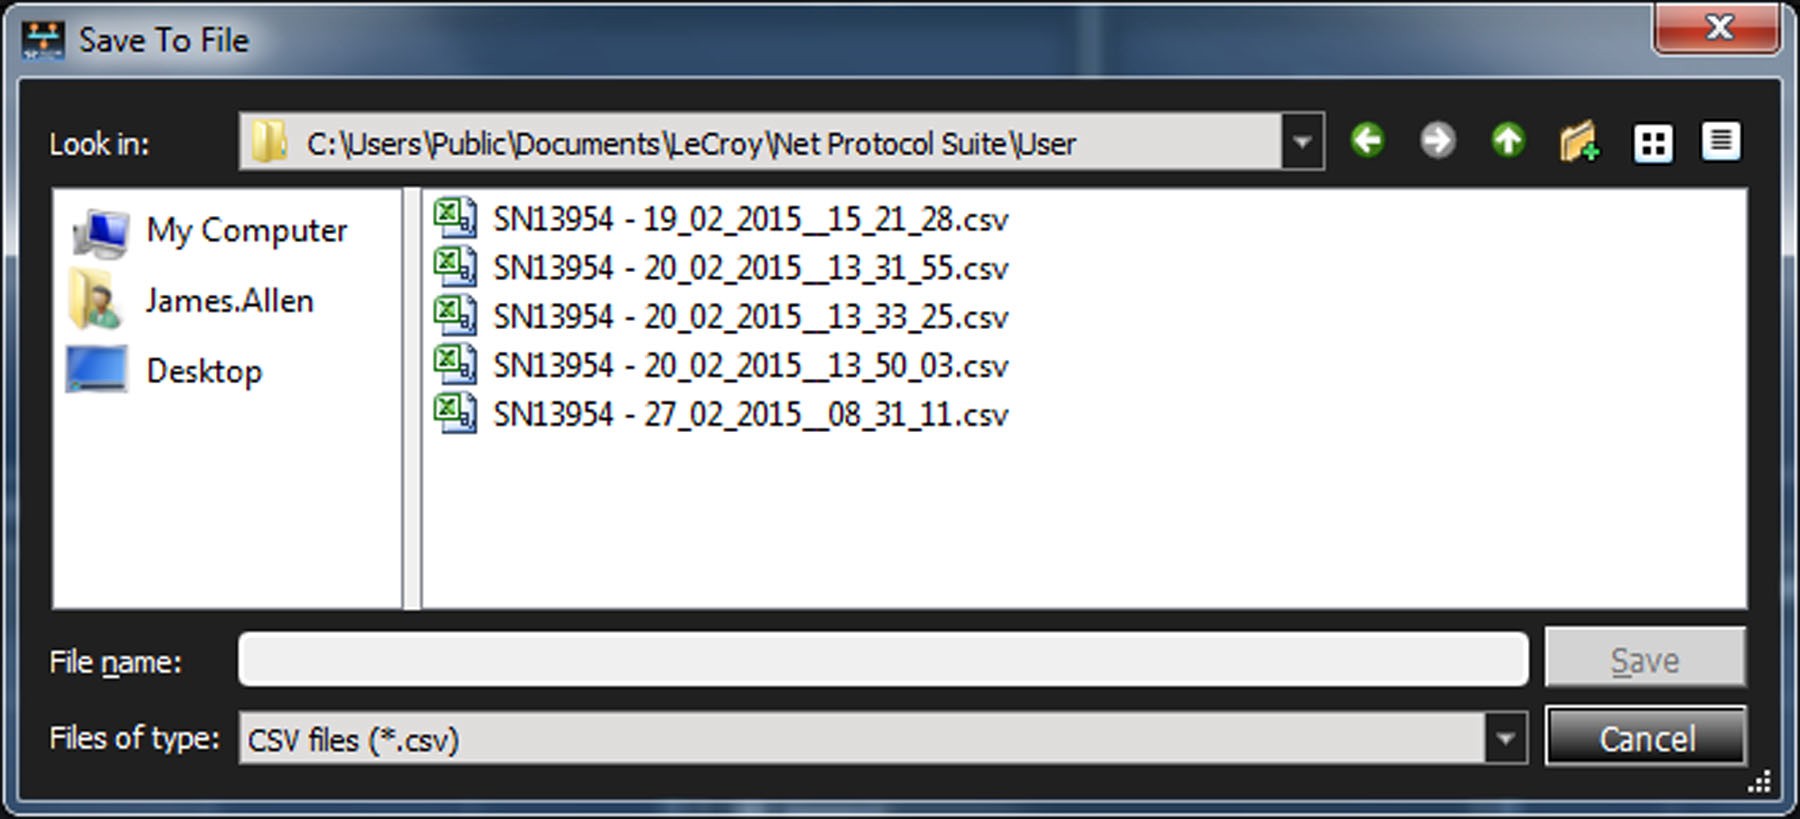
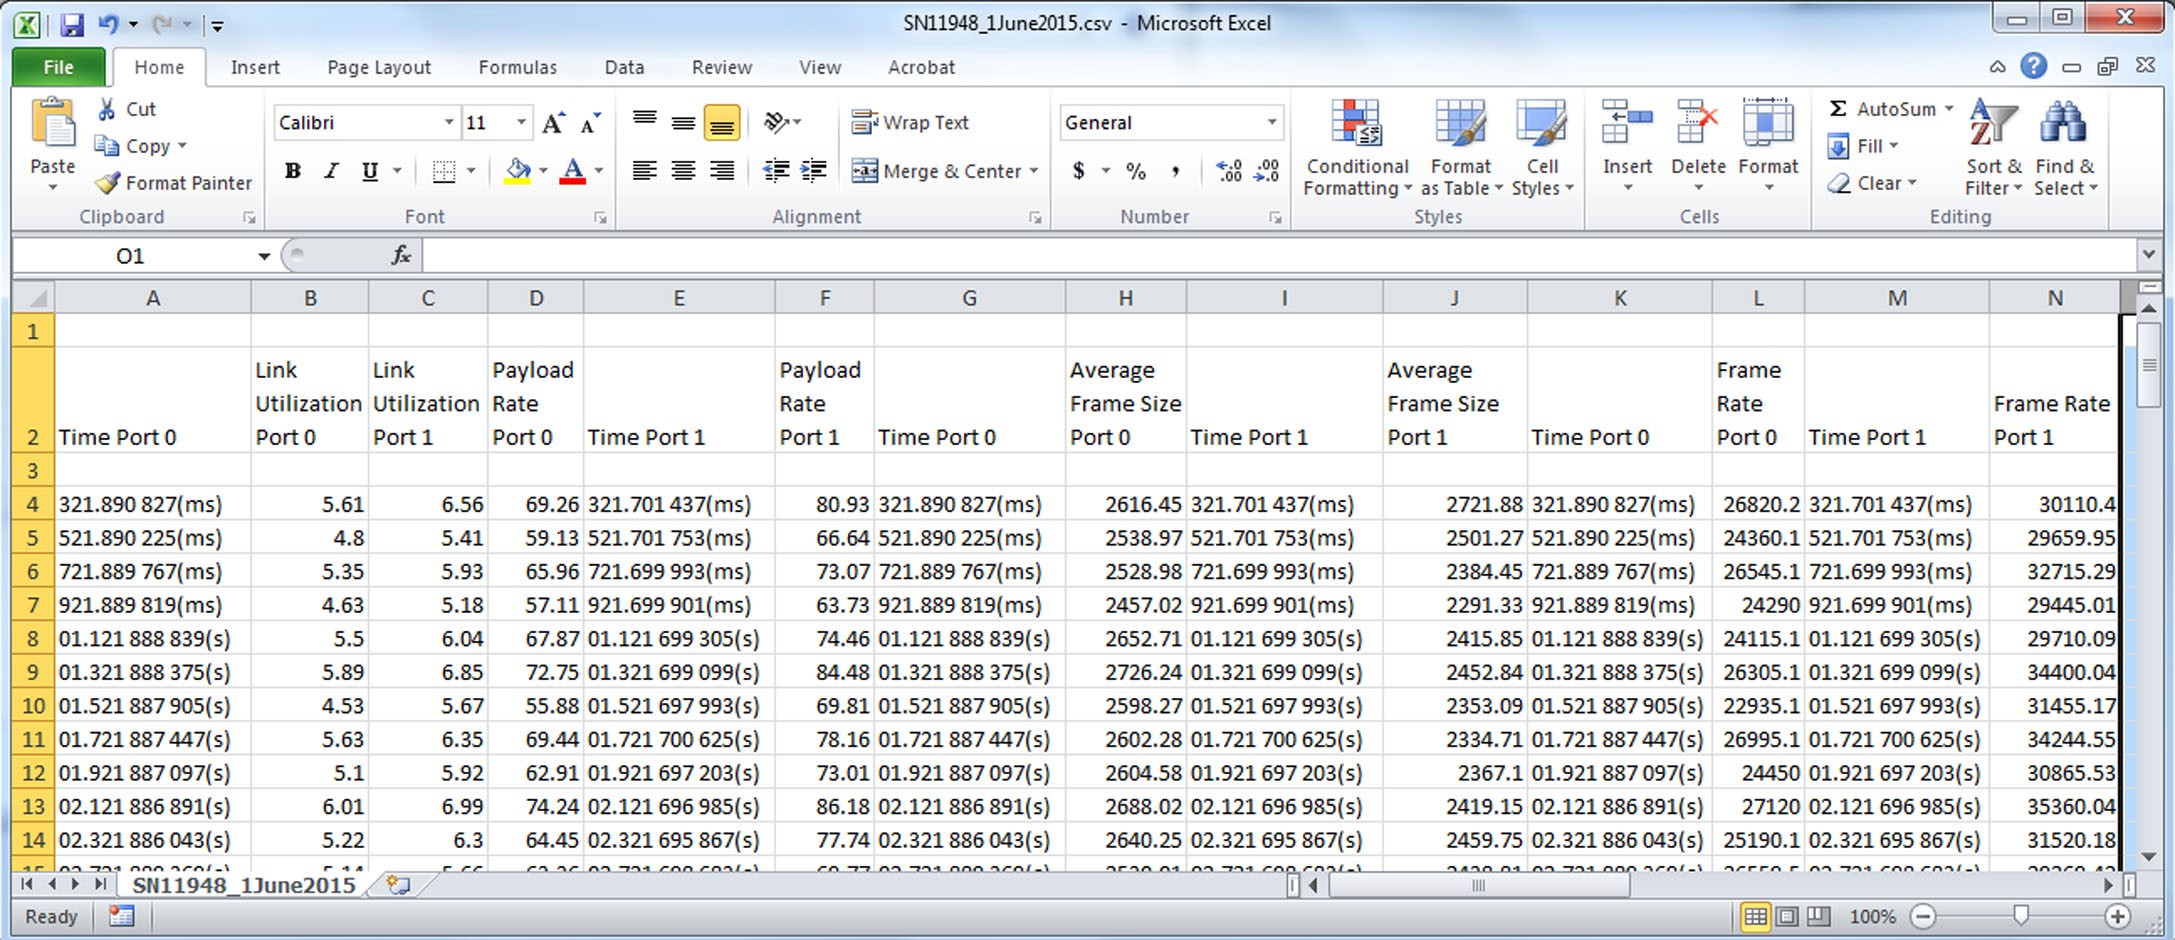
Click the Start icon to display traffic in the various windows and generate a log file. The log file for the current scenario is named SN11948_1June_2015.
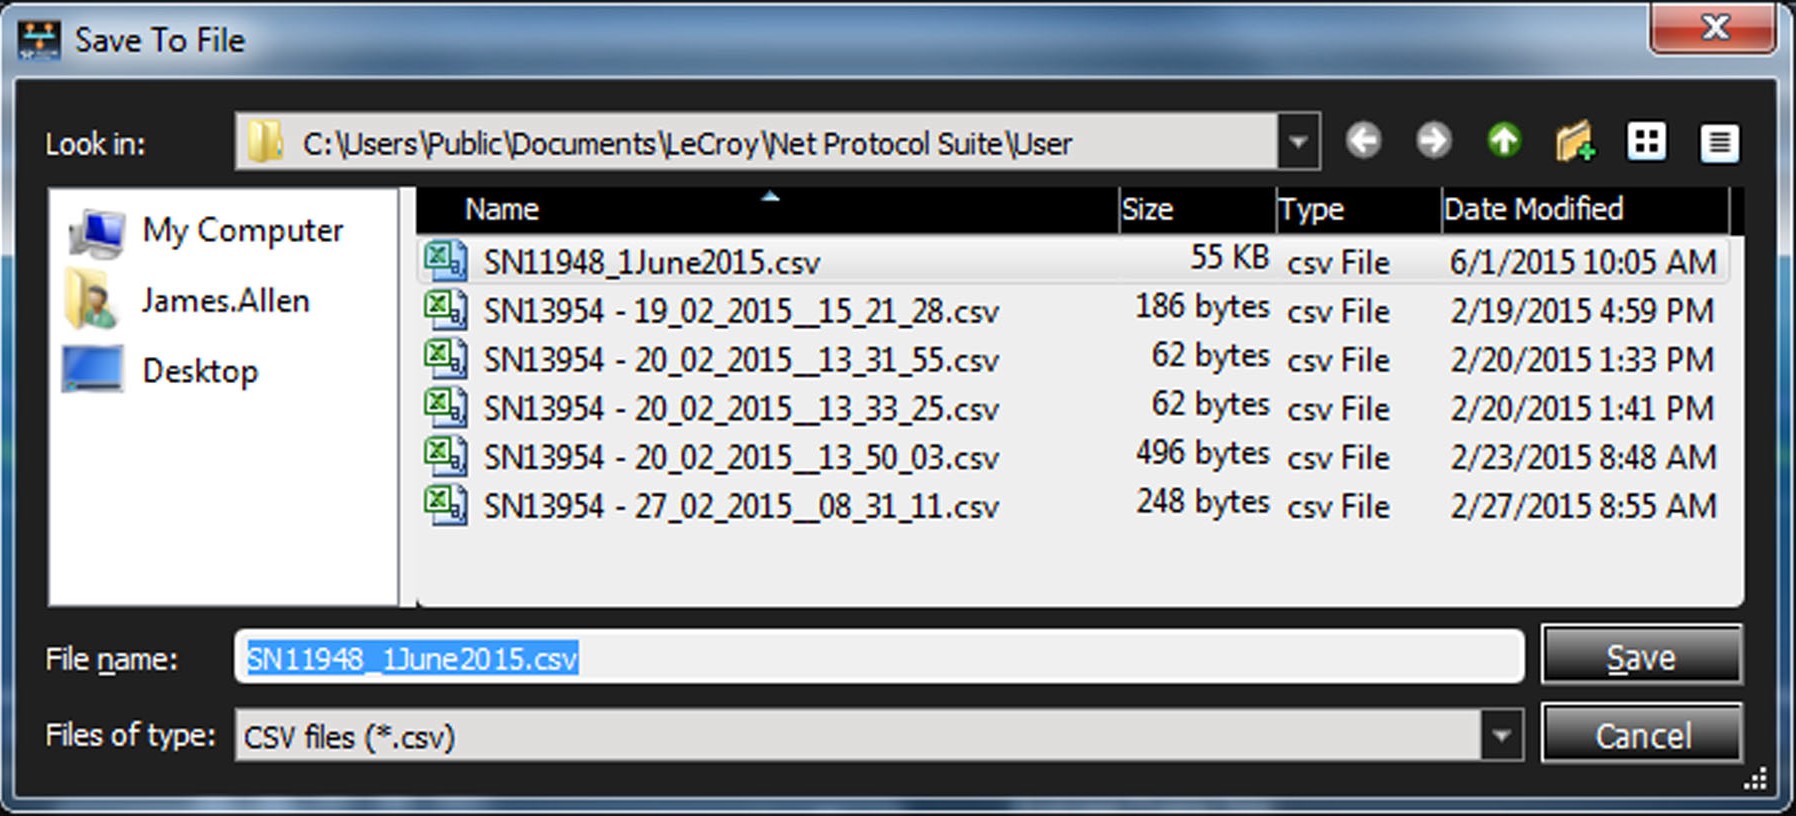
If you open the file, you will see a spreadsheet similar to the image below. This log file has been manually edited to remove ports that are not being used.