
The Navigator is a tool for navigating within the trace. It allows you to view the location of errors and triggers in a trace and to narrow the range of traffic on display. It also allows you to quickly jump to any point in the trace.
Display the Navigator
Click 
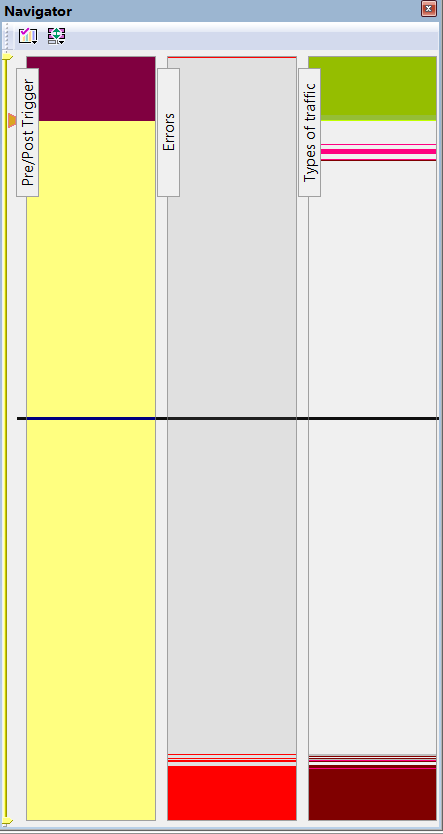
The Navigator appears on the right side of the main window. It has a two-button toolbar and a vertical slider bar. It also has colored panes for navigating the trace in different ways. You set which panes are displayed through Navigator pop-up menus.
The Navigator bar can be repositioned in the trace and can be oriented horizontally or vertically, docked or undocked, by dragging the parallel bars at the top or side of the Navigator bar. By default, the Navigator bar appears vertically to the right of the trace window.
The Navigator bar represents different types of trace information in the order of the packets. The top of each bar corresponds to the first packet in the trace, and the bottom corresponds to the last packet. The Navigator bar is made up of three parts: Pre and Post-Trigger traffic, Errors, and Types of Traffic.
At any time, a line in the navigator bar of one pixel in height represents a fraction of the trace data. If the Navigation bar is 400 pixels high, then each bar in this example would represent 1/ 400 of the trace. If the trace had 4000 packets total, each bar would represent ten packets. In the Types of Traffic portion of the navigation bar, the color of the bar would be that of the most important item in those ten packets.
Drag the yellow caret, at the top or bottom, to set the packet range. When you move the caret, a message shows the packet range.
The blue caret indicates the current packet position in the trace view.
Navigator Toolbar
The Navigator toolbar has two buttons that let you quickly set Navigator features:


Navigator Ranges
You set the viewing range by dragging the yellow range delimiters along the slider.
To set the lowest packet viewable, drag the top delimiter up. As you do so, a tool tip appears to indicate the current range. Stop dragging when you reach the desired lowest packet.
To set the highest packet viewable, drag the bottom delimiter down. Stop when the tool tip indicates you are at the desired highest packet.
Determine Current Position
In addition to the two yellow range delimiters, the slider has a gold current-position indicator. The current-position indicator shows where you are in the trace display with respect to the possible viewing range.
For example, you set the viewing range to packet 0 through packet 500 (the top range delimiter is at packet 0, and the bottom range delimiter is at packet 500). If you move the current-position indicator on the slider to midway between the top and bottom delimiters, packet 250 appears in the middle of the trace display.
Reset Navigator Range
You can reset the Navigator range using the toolbar Navigator Range button. Press the button to bring up the Navigator Range drop-down menu.
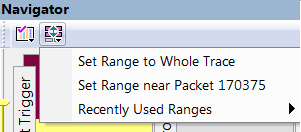
The menu has the following options:
-
Set Range to Whole Trace: Allows you to reset the range to include the entire trace file contents. The top range delimiter is placed at the lowest packet number in the trace. The bottom range delimiter is placed at the highest packet number in the trace.
-
Set Range Near Packet xxx: Allows you to collapse the range so that only the packets immediately above and below the xxx packet are displayed. The xxx packet is whatever packet is currently at the top in the trace display.
-
Recently Used Ranges: Allows you to reset the range to any of a number of recently used (previously set) ranges.
Navigator Panes
You can display any combination of trace Navigator panes.
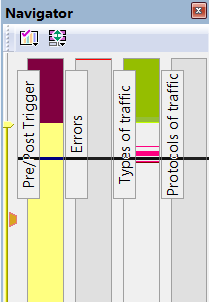
From left to right, the panes are: Pre/Post Trigger, Errors, Traffic Types, and Protocols of Traffic. Each pane represents the entire trace with respect to different types of information. The top of each pane represents the start of the trace file, and the bottom represents the end of the trace file.
-
Pre/Post Trigger: To view the trigger event in the trace and the relative size of pre-trigger and post-trigger portions of the trace. The two portions are set apart as different colors. The trigger event occurs at the point the two colors meet.
-
Errors: To view any errors in the trace. A thin red line represents each error in the pane.
-
Traffic Types: To view the types of packets that occur in the trace. A different color represents each packet type in the pane. The relative size of colored portions in the pane corresponds to the amounts of the various packet types in the trace. As described below, you can use the Navigator legend to change the types of packets that take precedence in the display.
-
Protocols of Traffic: To view USB 2.0, USB 3.2 Host Tx, or USB 3.2 Host Rx.
Show/Hide Navigator Panes
You can show/hide any of the panes using pop-up menus accessible through right- click the Navigator Panes button or by right-click anywhere in any Trace Navigator pane.
Navigator Slider
The Navigator slider appears at the left of Navigator panes. The slider has yellow upper and lower range delimiters and a gold current-position indicator.
The Navigator slider lets you to set the range of packets viewable in the trace display. In other words, it sets scrolling range of the display. You can scroll the display up to the lowest packet number in the viewing range. You can scroll the display down to the highest packet number in the viewing range.
Navigator Legend
The Navigator legend lets you control the display of content in Navigator panes. You bring up the legend through the Navigator Panes drop-down menu. Press the toolbar Navigator Panes button to access the menu. Select the Legend option to bring up the Navigator Legend dialog box.
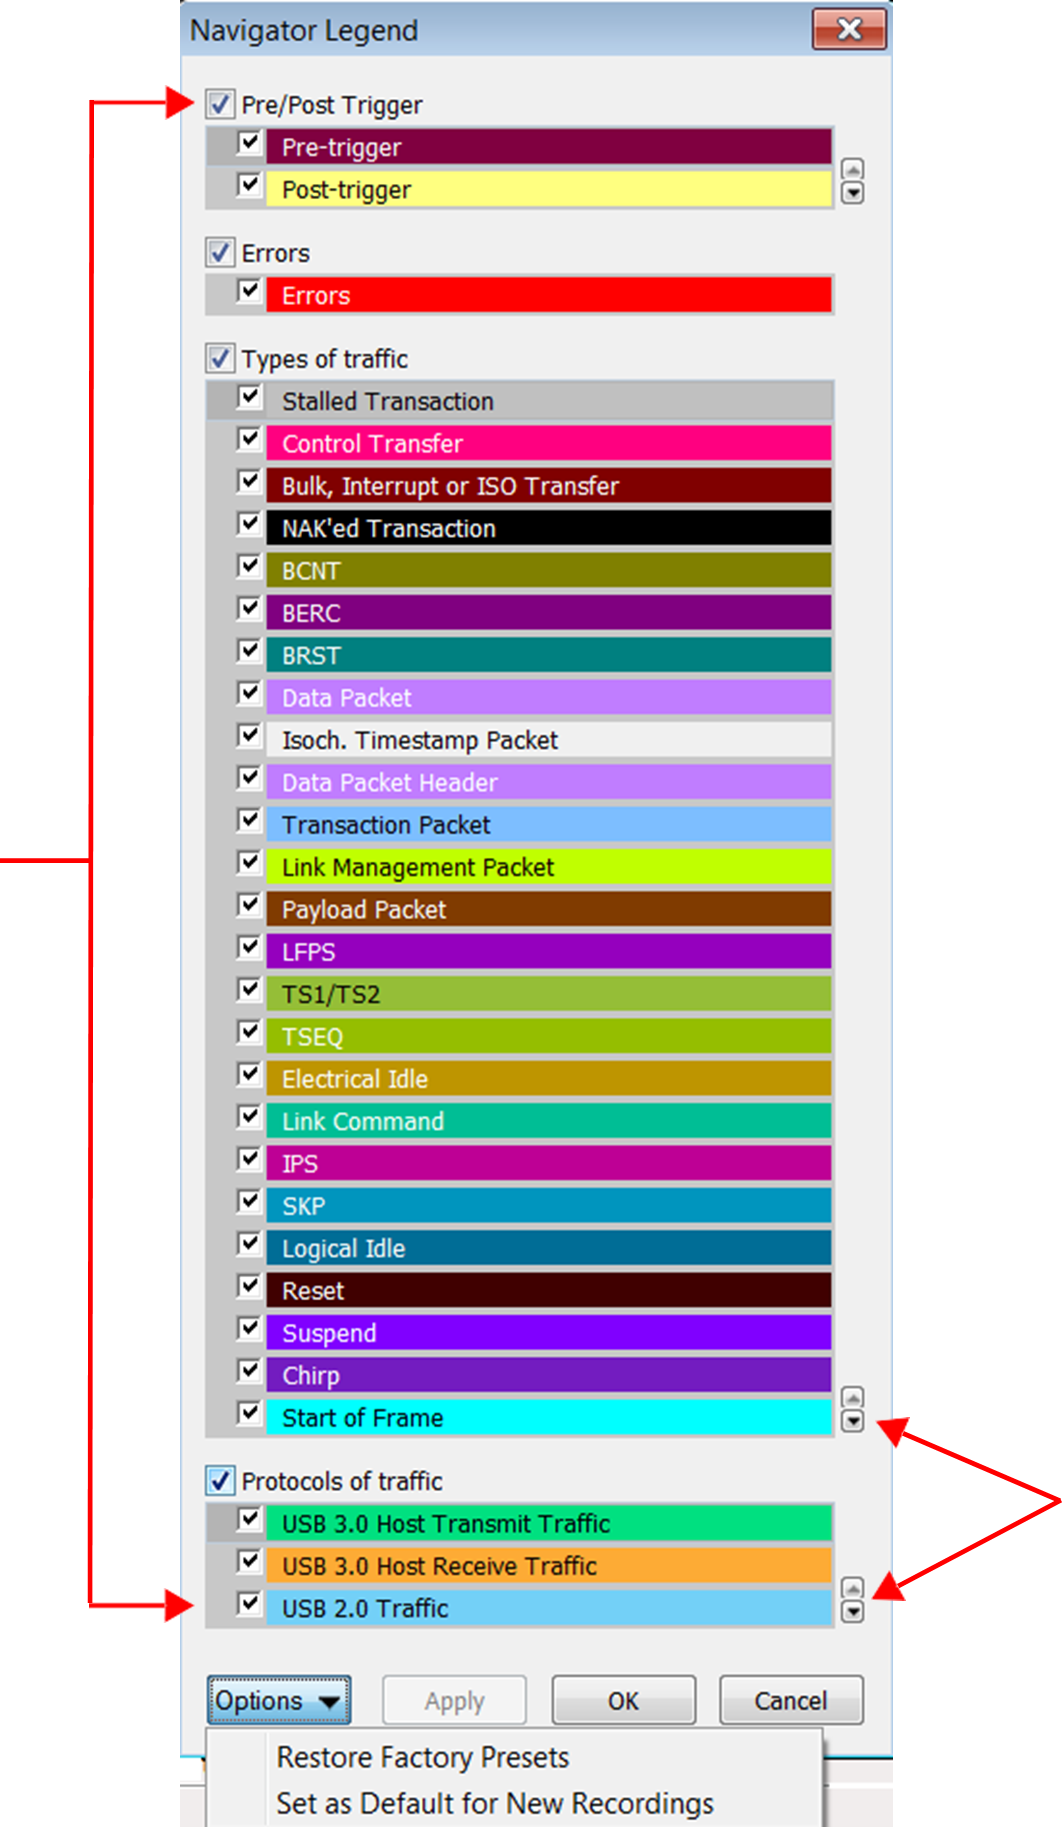
The Navigator Legend dialog box has areas corresponding to each of the panes. Each area has checkboxes that allow you to hide/display information in the pane. You can set the priority of information displayed in the panes using the up and down triangles on the right.
Show/Hide Navigator Panes
To use the legend to show/hide an entire pane, use the checkbox next to the name of each pane in the legend.
In the case of the Pre/Post Trigger and Errors areas, the action of show/hide in the legend is identical to that provided by Trace Navigator pop-up menus.
In the case of the Traffic Types pane, there is no equivalent show/hide available through the pop-up menus.
Set the Priority of Information Display
You can use the legend to set the priority of information displayed in the Pre/Post Trigger Traffic Type panes. This is a two-step process.
-
For a particular item in a pane, click the column next to the checkbox for the item. That labels the item as currently active.
-
Use the up-down arrows at the lower-right of the area to move the item higher or lower in priority.
In the case of the Traffic Type pane, priority determines display priority of each packet type. For portions of the trace that are dominated by a particular packet type, this setting no effect: only the color corresponding to that packet type is displayed in that portion of the pane. Suppose, however, that part of the trace includes equal or near equal numbers of several types of packets. In that case, you can use the legend to select which among those types is represented in that portion of the Traffic Types pane. This allows you to view only packets of interest in crowded portions of the trace display.