
The Bus Utilization window displays information on bandwidth use for the three recording channels.
To open the Bus Utilization window, go to Report > Bus Utilization or click the 
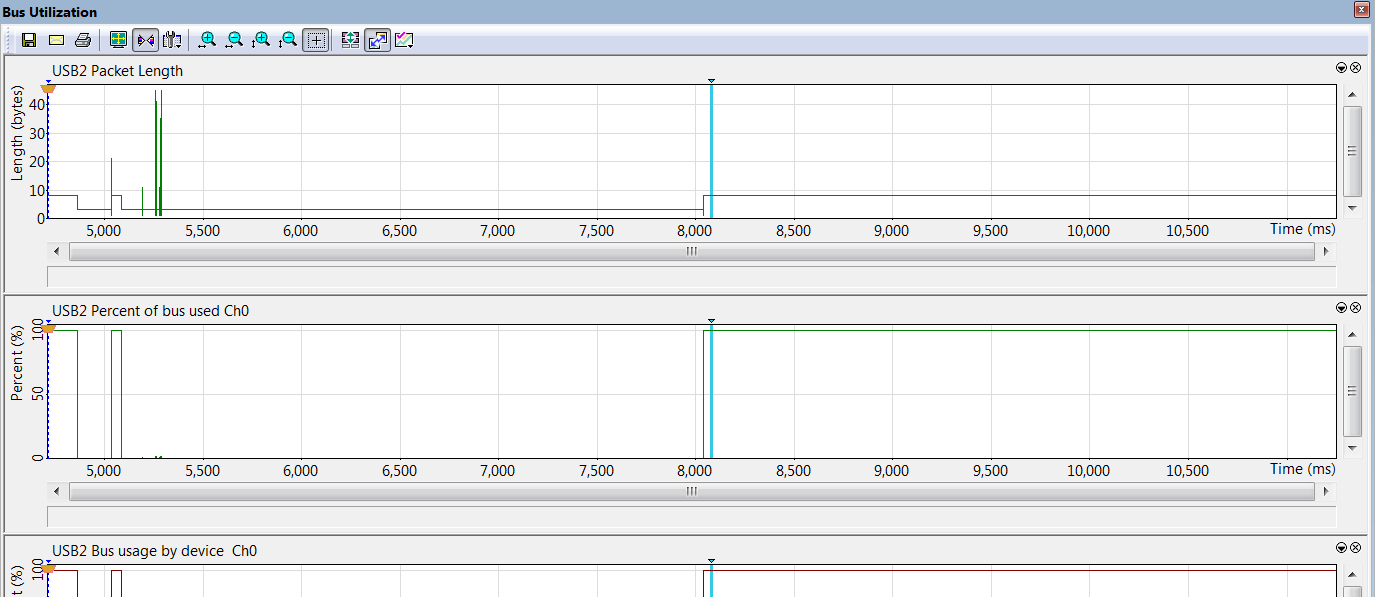
A window opens with graph areas. For USB 2.0, the display is similar to the following image.
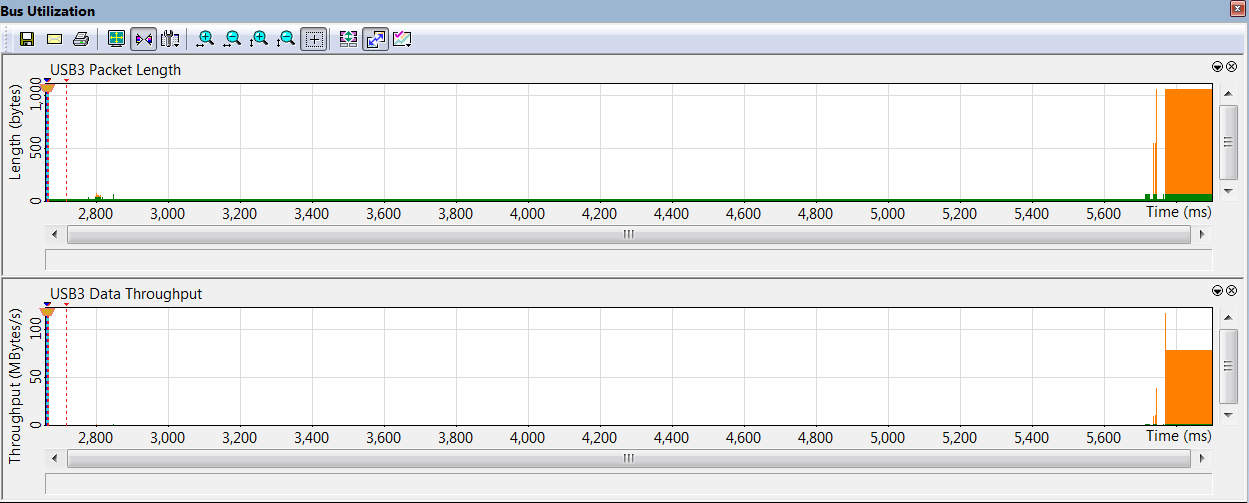
For USB 3.2, the display is similar to the following:
For USB4 the display is similar to the following:
Bus Utilization Buttons
The Bus Utilization window has a row of buttons for changing the format of the displayed data and for exporting data:

The buttons have the following functions:
|
Button |
Functionality |
|
Button |
Functionality |
|---|---|---|---|---|
|
|
Save As: Saves the graphs as a bitmap file (*.bmp) |
|
|
Horizontal zoom out |
|
|
Email: Creates an email with a *.bmp file attachment of the graphs |
|
|
Vertical zoom in |
|
|
|
|
|
Vertical zoom out |
|
|
Full Screen |
|
|
Click and Drag zoom: Click diagonally to select and zoom in on part of the graph |
|
|
Synchronize with Other Views. See Synchronize with other Views. Synchronizes the View windows so that a move in one window repositions the other. See Link Tracker Buttons. |
|
|
Select Range. |
|
|
View Settings: opens a sub-menu with options for formatting the dis- play. See View Settings Menu, below. |
|
|
Sync and Graph areas: If two or more graphs are displayed, this button syn- chronizes the graphs to one another. Once synchronized, the positioning slider of one graph moves the other graphs. |
|
|
Horizontal zoom in |
|
|
Graph Areas: Presents options for displaying additional graphs of data lengths, packet lengths, and percent- age of bus utilized. |


View Settings Menu
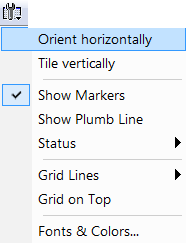
Click the View Settings button 
-
Orient Horizontally: Changes the orientation of bus usage to horizontal. After selecting this option, the menu has Orient Vertically.
-
Tile Vertically: Tiles the two graphs vertically (i.e., side by side). After selecting this option, the menu has Tile Horizontally.
-
Show Markers: Places “tick” marks along the x axis of each graph.
-
Show Plumb Line
-
Status: Opens a sub-menu:
-
Bar: Displays a status bar at bottom of graph.
-
Tooltip: Causes a tooltip to appear if you position your mouse pointer over part of the graph and leave it there for a couple of seconds.
-
No Grid: Turns off tooltips and the status bar.
-
-
Grid Lines: Opens a sub-menu:
-
Both Axis: Displays both X and Y axis grid lines
-
X Axis: Displays X axis grid lines
-
Y Axis: Display Y axis grid lines
-
None: Turns off grid lines
-
-
Grid on Top: Moves the grid lines above the graph.
-
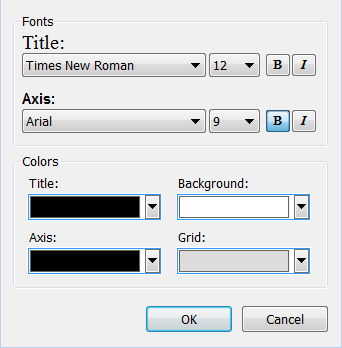
Fonts and Colors: Opens a dialog box for setting the colors and fonts used in the graphs:
Graph Areas Menu
The Graph Areas menu allows you to view different information in the Bus Utilization window.
Click the 
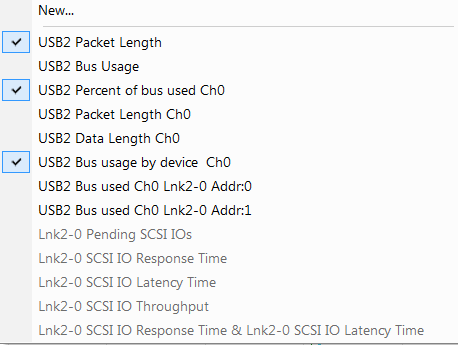
For USB 3.2. the display is similar to the following:
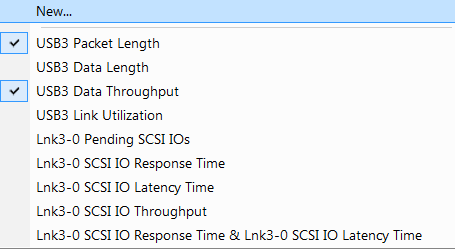
For USB4, the display is similar to the following:
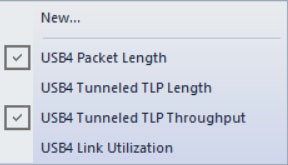
Select the data you want to appear in the Graph Areas window.
Change the Properties in the Bus Utilization Graph
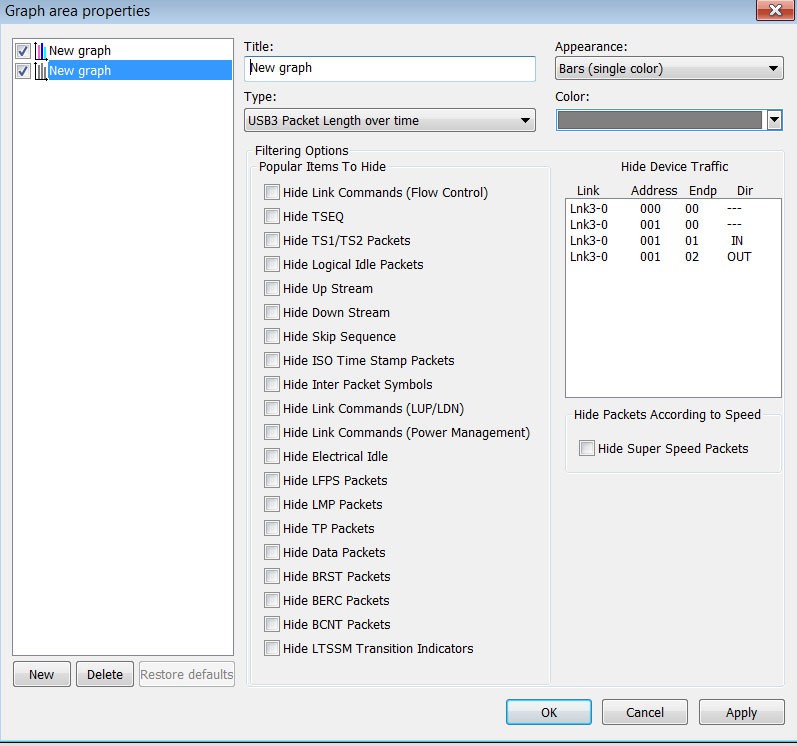
To change the properties in the Bus Utilization graph, in the Graph Area properties dialog box, below, select the options to display in the graph display, then click OK.
Creat a New Bus Utilization Graph
To create a new Bus Utilization graph:
-
Select New in the Graph Areas menu.
-
In the Graph Area properties dialog box, select the options to display in the graph.
-
Enter a Title for the new graph, then click OK.
USB4 Graph Areas
-
USB4 Packet Length: Shows the length of all USB4 HS packets over time.
-
USB4 Tunneled TLP Length: Shows the length of Tunneled payload data over time.
-
USB4 Tunneled TLP Throughput: Shows the throughput of Tunneled payload data over time.
-
USB4 Link Utilization: Shows the throughput of all USB4 HS packets over time.
NOTE:The measurement interval can be customized in USB4 Throughput and Link Utilization graphs via the Properties window.