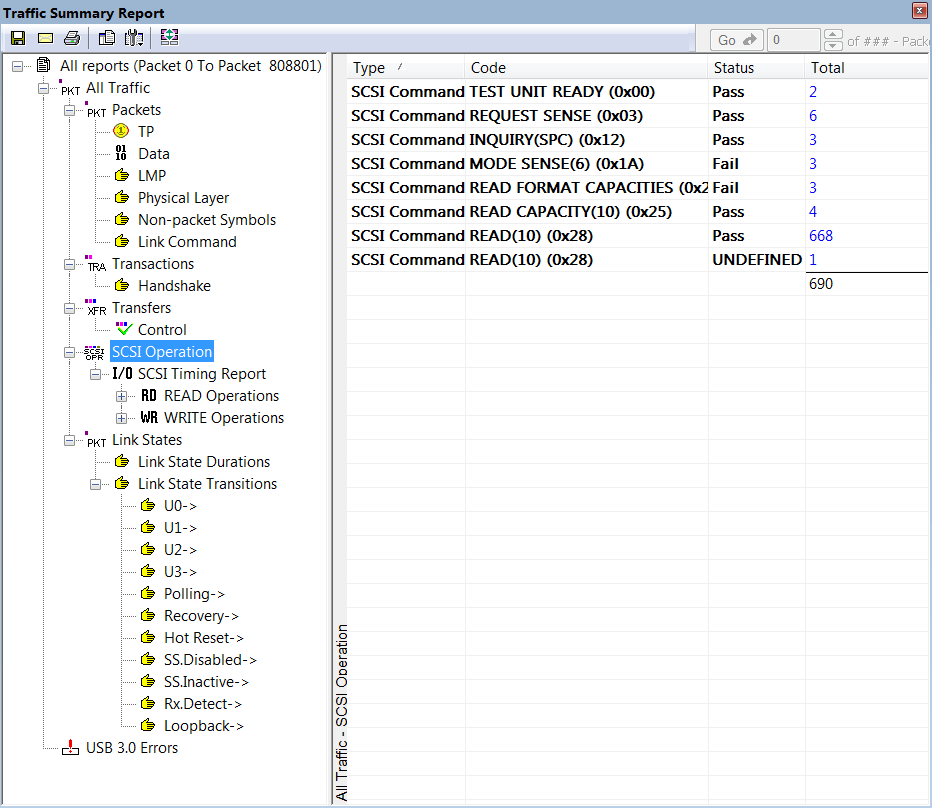
The Traffic Summary Report summarizes the numbers and types of packets, transactions etc. that occurred in the open trace. To run a Traffic Summary Report:
Go to Report > Traffic Summary Report or click the 
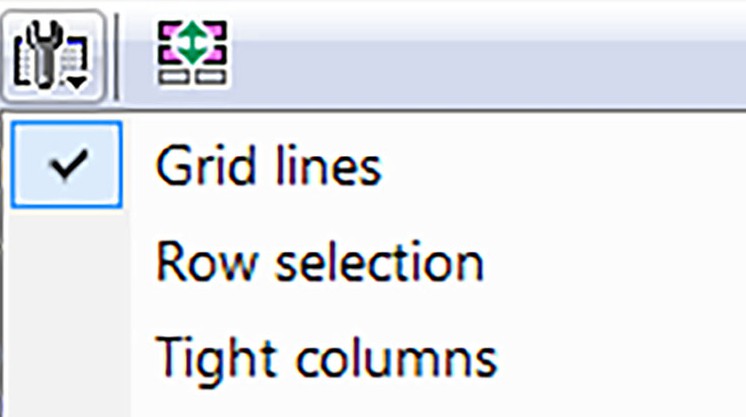
Click the Options button to display the Options menu, which allows you to show Grid lines, Row selection, and Tight columns.
Click 
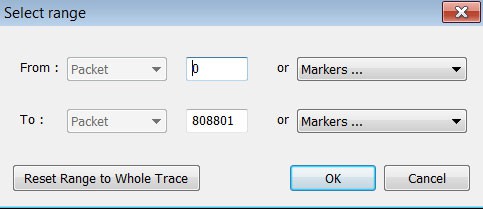
Enter a number From and a number To. You can also Reset Range to Whole Trace.
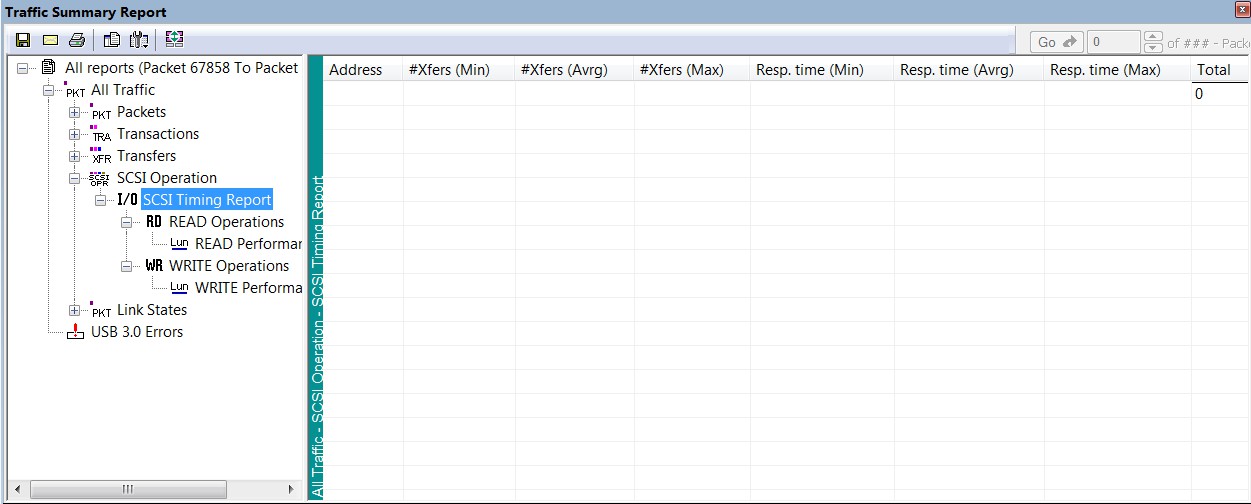
SCSI Metrics Report
The SCSI Metrics are:
Address
-
Number Of Transfers (Min., Avrg., Max.): Total number of transfers that compose the SCSI operation
-
Response Time (Min., Avrg., Max.): Time to transmit on the USB link, from the beginning of the first transfer in the SCSI operation to the end of the last transfer in the SCSI operation
-
Latency: Time from the transmission of the SCSI command to the first data transmitted for the SCSI IO operation
-
Data To Status Time: Time between the end of data transmission for the SCSI operation and the status transfer
-
Payload: Number of payload bytes transferred by the SCSI operation
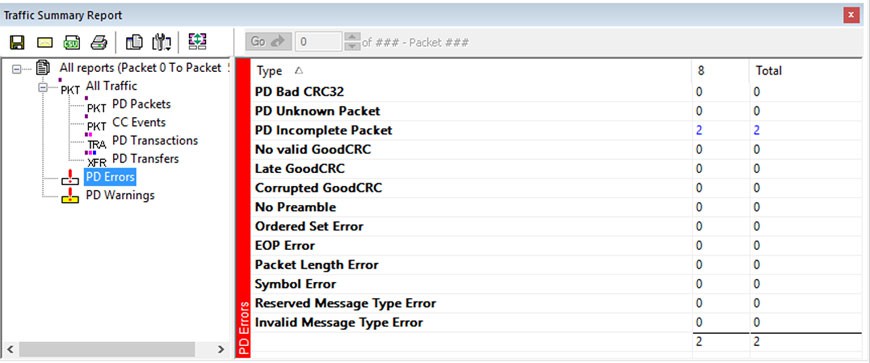
Power Delivery (PD) Traffic Summary Report
Power Delivery Traffic, Errors, and Warnings are also available on Power Delivery equipped analyzers in the Traffic Summary Report.