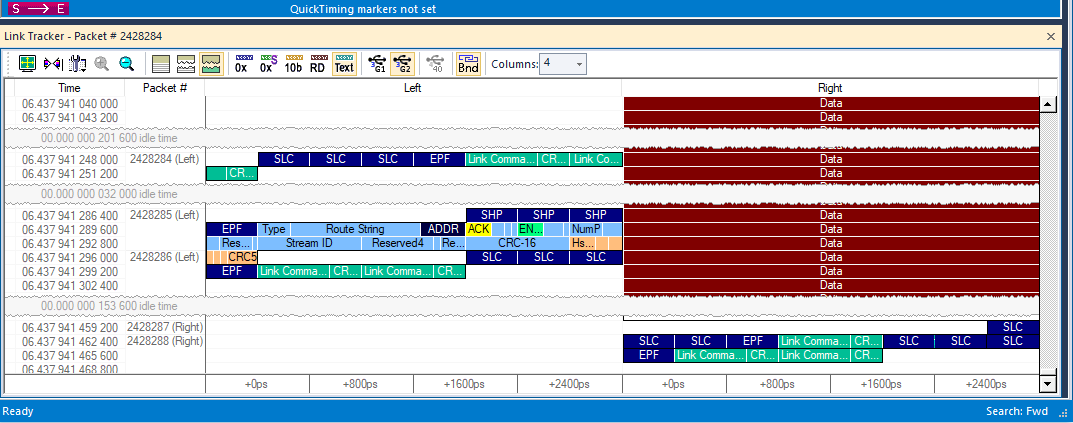
The Link Tracker window displays a detailed chronological view of events. Events are shown on a channel-by-channel basis in columns within the window.
-
Select the number of columns to view more or less data at one time.
-
Each time slot in the vertical axis represents the minimum time that a DWORD requires to traverse the bus when the “Columns” is selected as 4.
NOTE: On Symbol Displays, there will occasionally be “blank” symbols inserted into the Link Tracker display (or symbols removed) to compensate for timestamp rate matching between the various time bases. The issue is that there are 3 clock domains (Rx, Tx, and our precision timestamp) that need to be represented in the trace.
The nominal 2nSec/symbol Transmit and Receive clocks can vary up to 500ppm per the USB Specification, whereas the analyzer is accurate to 3ppm. Blank entries and missing entries in the link tracker are there to compensate for this difference, and to try to maintain the most accurate relationship among these clocks and present the closest time relationship between the downward and upward streams.
The clock listed in the Time column is our precision 3ppm clock timestamp.
-
Toolbar: Shows buttons to change the format of the Link Tracker window.
-
Main Display Area: Displays traffic chronologically as it occurred in the recording. The window divides into columns: the first column shows time and traffic is shown channel-by-channel in the columns on the right.
Time Overlap Indicator
Due to the sampling error of the nominal symbol time vs the granularity of our precision (~3ppm) timestamps, it can sometimes occur that 2 or more symbols seem to belong in the same time location of this view.
This is denoted by the yellow circle next to the symbol.
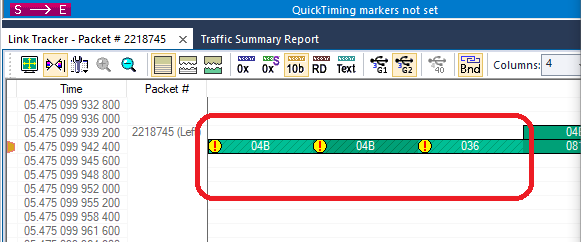
If you hover over the yellow circle for the timestamp, a tooltip will show the symbols that occur in this location.
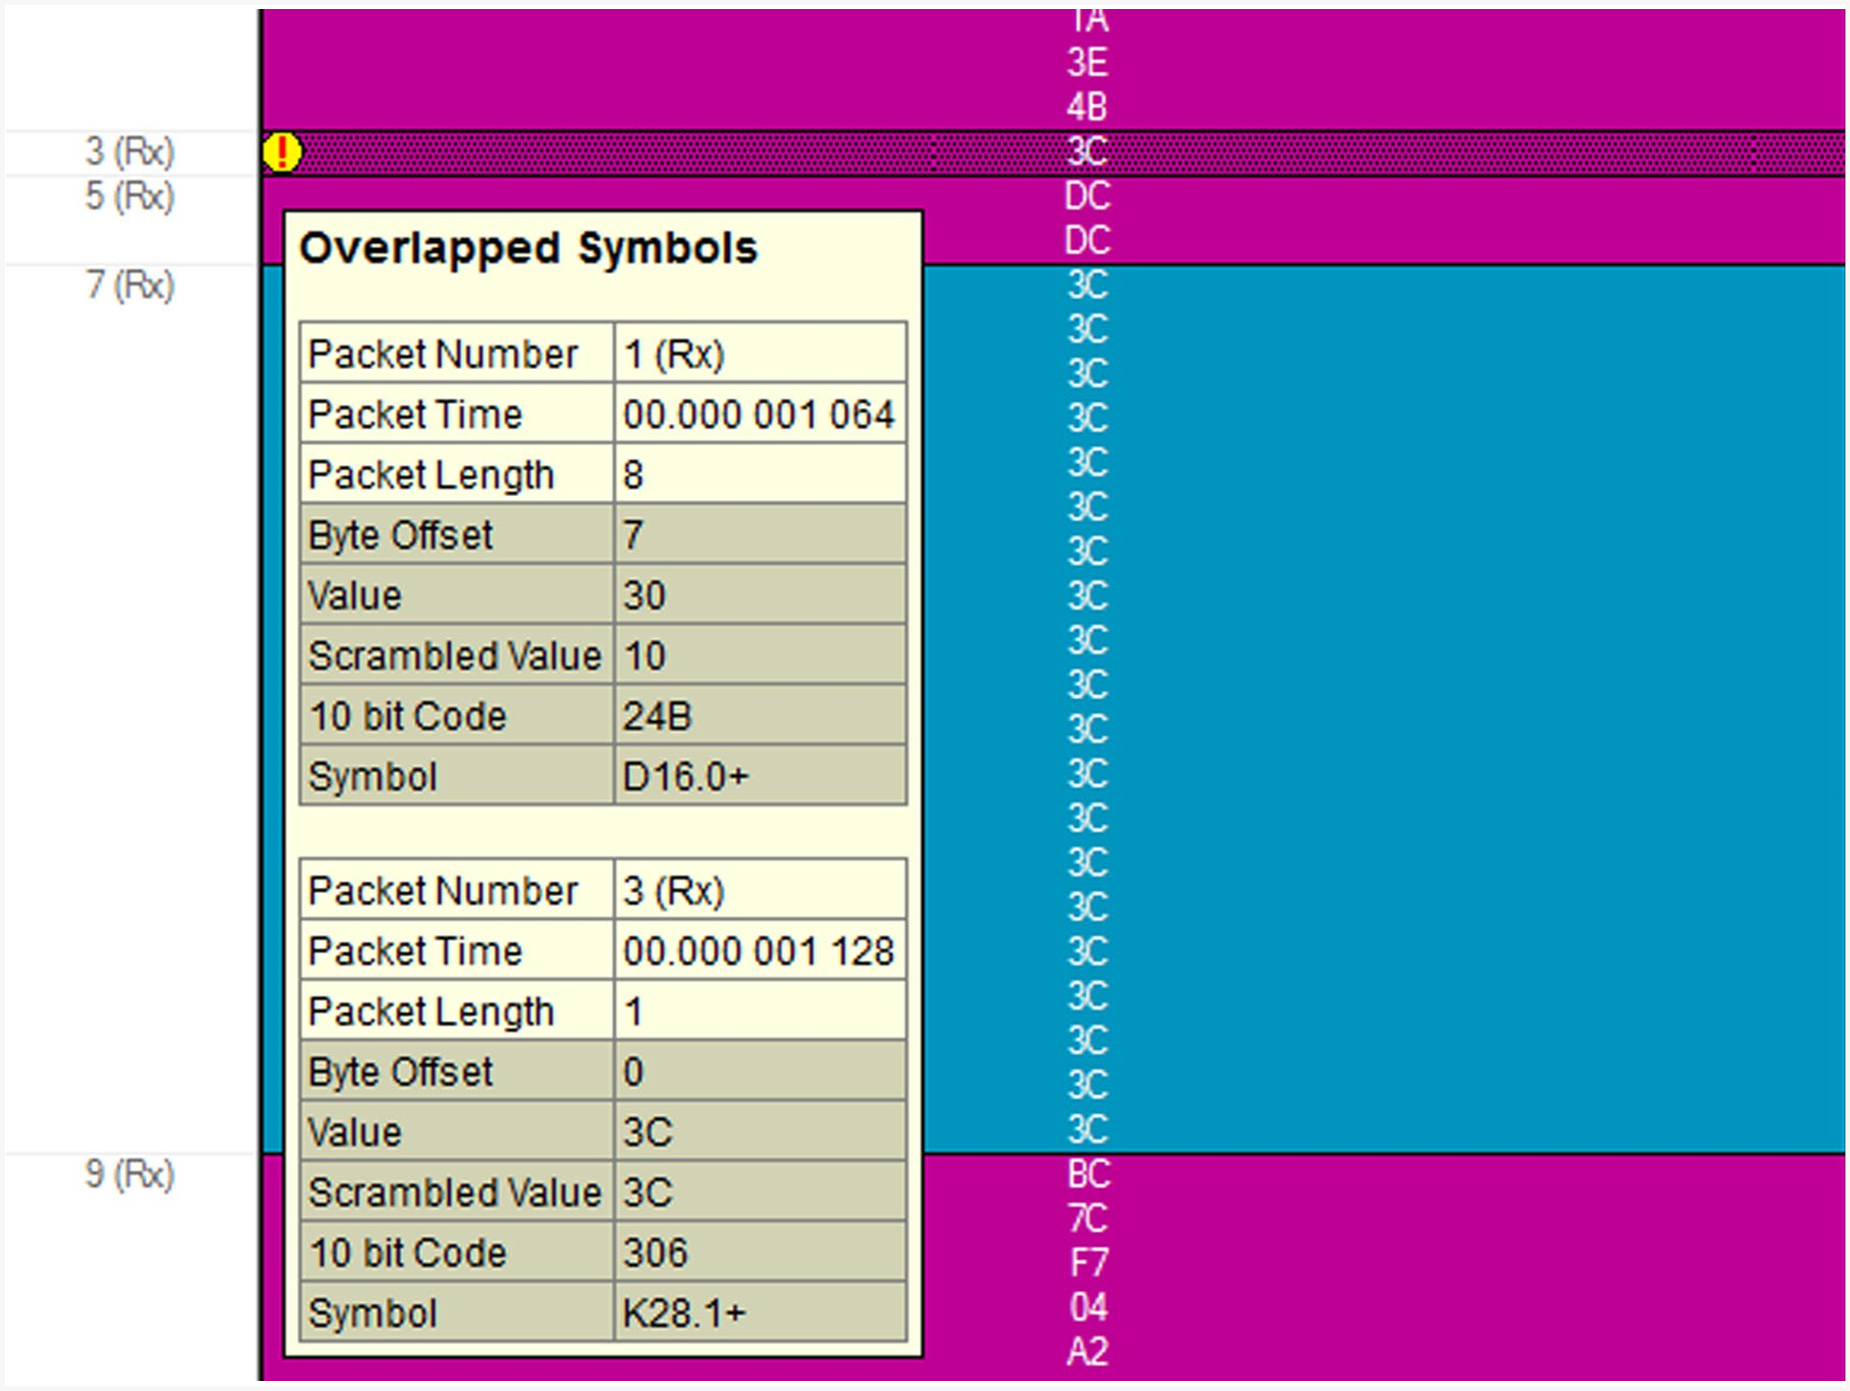
The top one occurred first, followed by the bottom one, etc. This artifact can occur occasionally throughout the Link Tracker view.
Using the Link Tracker Window
The Link Tracker window can be reformatted in several ways.
Zooming In and Out
Zooming out can give you a quick, high-level view of a trace. A fully zoomed out trace only shows columns and colored lines. Using the colors, you can see what types of traffic run through the trace.
Further information can be obtained on any point of interest in the trace by positioning your mouse pointer over it. Tooltips provide detailed description of events.
NOTE: When fully zoomed out, the smallest graphical unit is the DWORD, represented by a single line. Zooming out makes the trace appear smaller and increases the time scale in the first column.
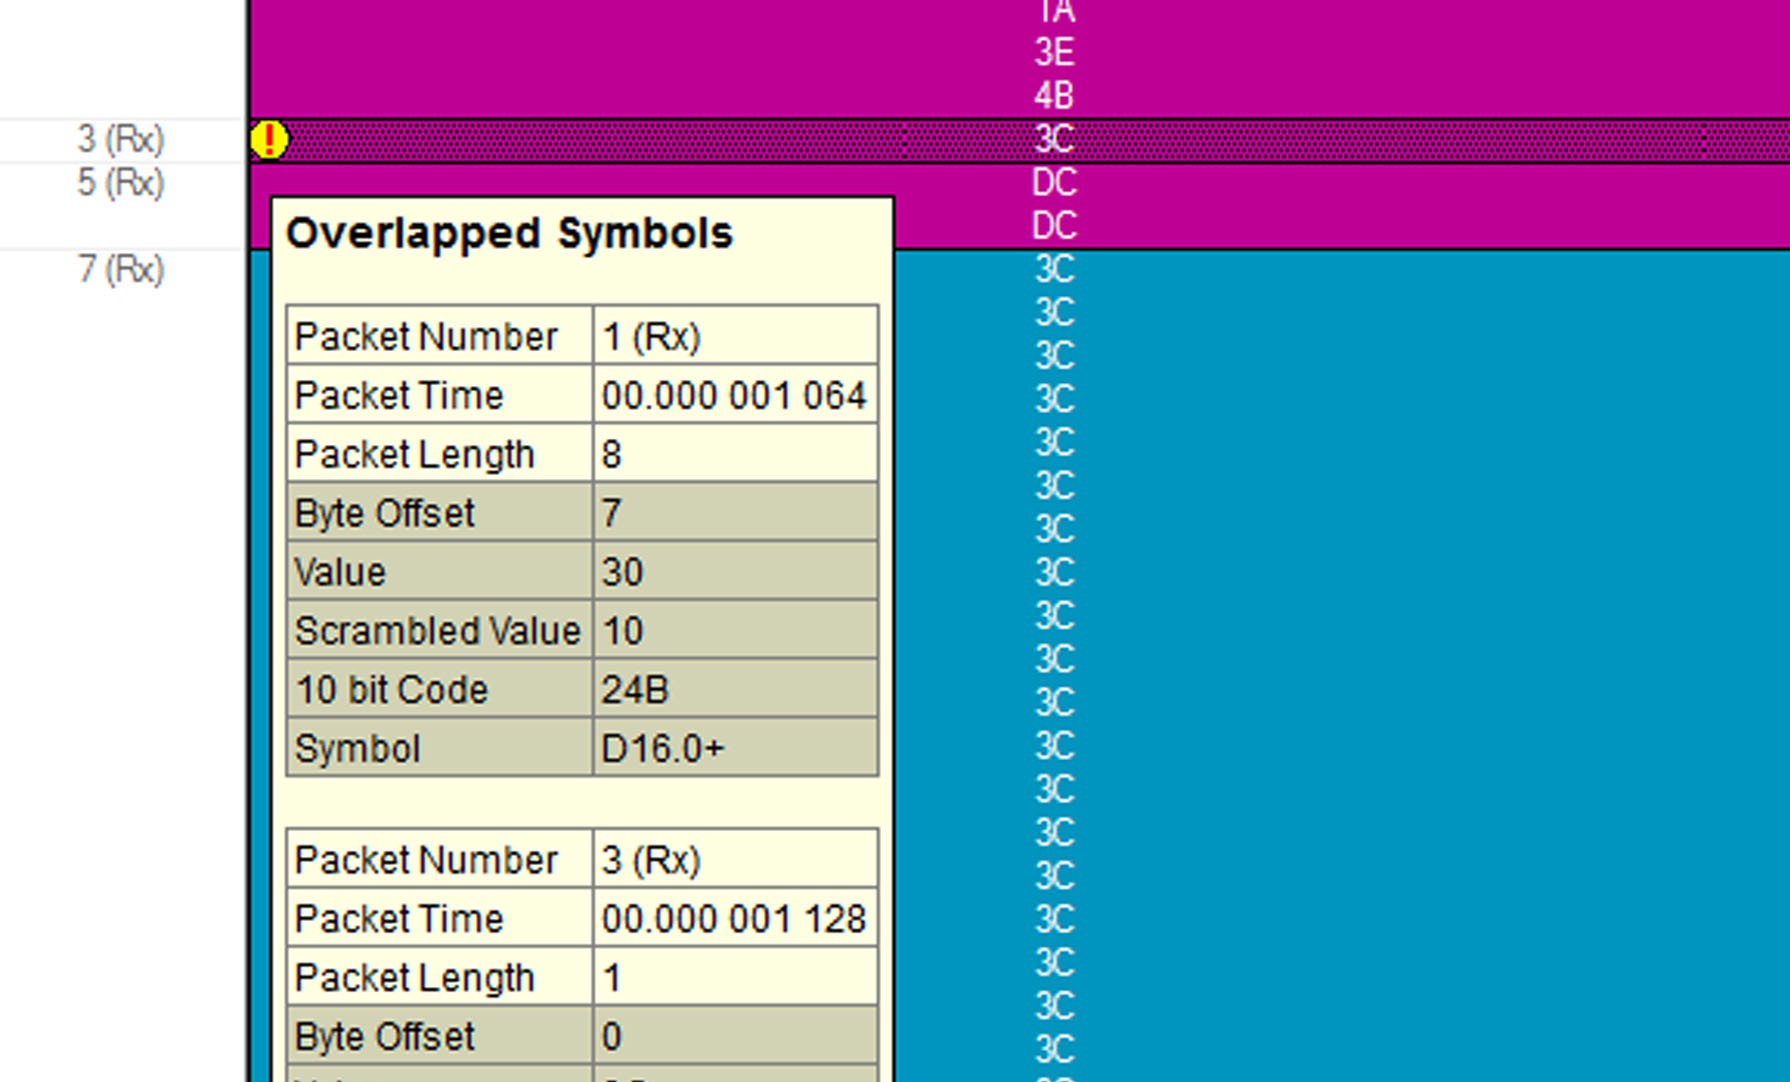
Figure 10.36: Link Tracker Window Zoomed Out
Collapsing Idle Time, Enabling Tool tips, and Resetting Column Widths
Click the View Options button 
-
Collapsible Idle Time: Opens a dialog box for setting the Idle time value. Setting a value tells the analyzer when to collapse Idle times and display them as grayed out strips within the Bus View window.
-
Time Format: Seconds or Clock.
-
Reset Column Widths: This option resets column widths to their defaults and enables columns to resize themselves automatically any time the application window is resized. Normally, columns automatically resize themselves if the application window is made larger or smaller. However, if you manually resize any columns in the Bus View window, column widths become static. Thereafter, if you resize the application window, the Bus View columns do not adjust automatically. Reset Column Widths re-enables the automatic resizing capability.
-
Reset Columns Order: Return to default column sequence.
Docking and Undocking the Window
You can undock the Link Tracker window by double-clicking the blue title bar along the left side of the window. Once undocked, the window can be dragged anywhere in the application. To redock, double-click again on the title bar.
Setting Markers
Markers can be set on any event within the Link Tracker window.
-
To set a marker, right-click an event, then select Set Marker from the pop-up menu.
-
Once marked, you can navigate to events with the Go to Marker command in the Search menu.
-
Markers set in the Link Tracker window display the packet number and DWORD number. In contrast, markers set in the Trace window just show the packet number.
Hiding Traffic
You can hide Idles and other data from the Link Tracker window by clicking the Hide buttons on the toolbar.
Link Tracker Buttons
The Link Tracker window has a row of buttons for changing the format of the displayed data and for exporting data The buttons have the following functions:
|
Button |
Functionality |
|
|
Full Screen. Expands the Link Tracker window to fill the entire screen. |
|
|
Synchronize with Other Views. Synchronizes Views so that a move in one window repositions the other. Because of the differences in scale and logic between the Link Tracker and Trace view window, scrolling produces different effects depending on which window is being scrolled. Scrolling in the trace window causes the Link Tracker window to rapidly jump from event to event. Long periods of idle time are thus skipped. Scrolling in the Link Tracker window, in contrast, produces modest movements within the trace window. Scrolling in the Link Tracker window causes the trace window to pause until the beginning of a packet is displayed. At that point, the trace window repositions itself. While scrolling long Idle periods or through the contents of a packet, the trace window does not move. |
|
|
View Options. Opens a menu with these options: Collapsible Idle Time: Collapse Idle Bigger Than n nanoseconds. Note: Does not affect Collapse Idle Plus. Time Format: Seconds, Clock Reset Columns Widths: Return to default widths Reset Columns Order: Return to default column sequence. |
|
|
Zoom In |
|
|
Zoom Out |
|
|
Continuous Time Scale. No collapsing. |
|
|
Collapse Idle. Do not show some periods of Link being idle. |
|
|
Collapse Idle Data. Do not show periods of Link being idle. |
|
|
Show Descrambled Bytes |
|
|
Show Scrambled Bytes |
|
|
Show 10b Codes USB 3.2 Gen1 only |
|
|
Show Symbols USB 3.2 Gen1 only |
|
|
Show packet Fields |
|
|
Show USB 3.2 Super Speed 5Gbps Gen 1 packets. Link tracker cannot simultaneously display SS and SS+ traffic. |
|
|
Show USB 3.2 Super Speed + 10Gbps Gen 2 packets. Link tracker cannot simultaneously display SS and SS+ traffic. |
|
|
Show USB4 Packets |
|
|
Bonded/Unbonded Mode. USB 3.2 only |
|
|
Columns to view |