
The analyzer produces a range of reports that break down the results of tests based on different criteria. Select the Report tab to see the full range.
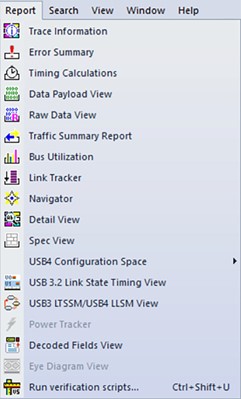
The available reports are:
Trace Information: Shows general information about the trace file.
Error Summary: Shows a count of errors in a trace file.
Timing Calculations: Shows timing measured between two events set within the trace file.
Data View (Packet Data): Shows packet payload contents.
Raw Data View: Shows the raw values of the entire packet as they were seen in the PHY layer (see Raw Data View).
Traffic Summary Report: Shows a summary of protocol-related information in the trace file summary about a selected group of items in the trace file (such as a count of particular frame or packet types).
Bus Utilization: Displays information on bandwidth usage for the transmit and receive channels.
Link Tracker (3.2): Displays a detailed chronological view of events.
Navigator: Navigates within the trace to view the location of errors and triggers, narrow the range of traffic on display, and jump to any point in the trace.
Detail View: Shows details of selected packet.
Spec View: Shows packet header information and other items in a view that matches the USB 3.2, Power Delivery, USB4, and Display Port specifications. See (Spec View).
USB 3.2 Link State Timing View: Graphically shows how much time the link spends in each link state.
USB 3.2 LTSSM View: Displays the LTSSM diagram depicted in the USB 3.2 specification.
Power Tracker: Displays voltage, current, and power. You can select Hide, Full Screen, Sync by Time, or Real Time Monitor (see Power Tracker—VBUS & Configuration Channel (CC)).
Decoded Fields View: See Decoded Fields View.
Eye Diagram View: See Eye Diagram View.
Run Verification Scripts: Opens a window where you can run verification scripts over the open trace.