
While there are some differences between the range of Teledyne LeCroy analyzers, there are also many shared features.
Graphical Bus Traffic Display
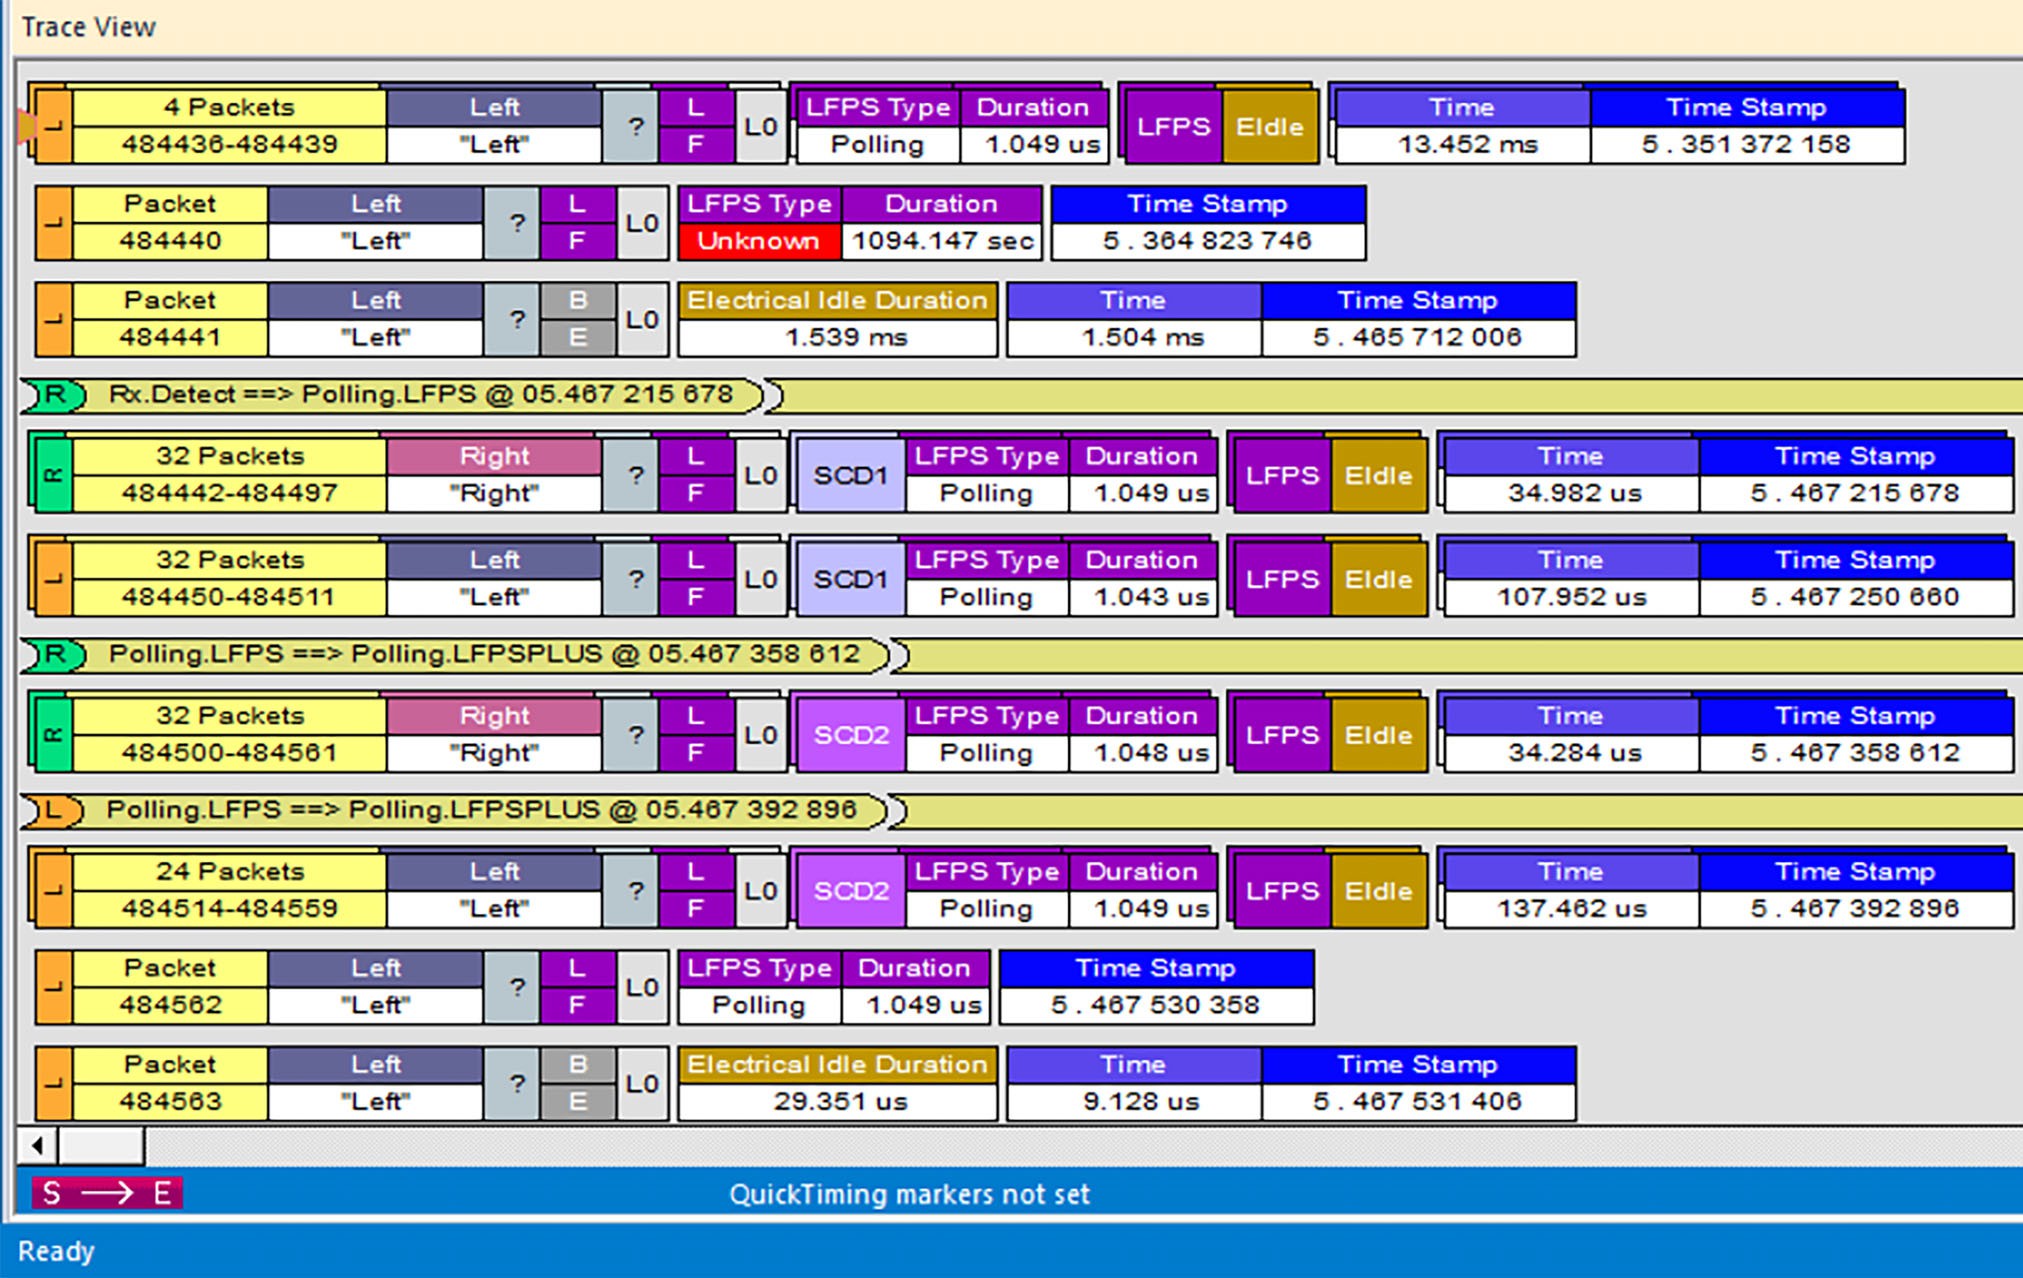
In the Trace Viewer, bus traffic displays use color and graphics to show captured transactions (shown below). Packets appear on separate rows, and receive timestamps and sequential numbers as the system records them. Fields have labels and color codes. When the system automatically detects protocol errors, they are highlighted in red. The display color scheme and field formats are customizable.
You can use the hide feature to suppress SOF packets and uninteresting user-defined packets or fields in different contexts. You can name and save display formats for later use. The display software operates independently of the hardware, allowing it to function as a standalone “trace viewer” that you can freely distribute.
Accurate Time Measurement
The internal counter/timer circuitry enables reliable, accurate time-stamping of recorded bus traffic. Traces and measurement and analysis functions display this timing information. Time fields are timestamps, idle times, bit times, or time deltas, in either decimal or hexadecimal format. You can add any number of markers to denote specific packets, you can make further timing measurements from one marker to another or from marker to trigger.
An essential feature of time management is that idle traffic does not consume analyzer memory. Because of this technology, the system can make accurate timing calculations while still preserving valuable recording memory for important bus traffic.
CrossSync Control Panel
The CrossSync Control Panel allows you to select analyzers for synchronization and manage the recording process. It supports a wide combination of Teledyne LeCroy analyzers, including PCI Express, USB, DDR, Serial ATA (SATA), Serial Attached SCSI (SAS), Fibre Channel (FC), and Ethernet.
CrossSync is Teledyne LeCroy’s analyzer synchronization solution that enables time-aligned display of protocol traffic from multiple daisy-chained analyzers showing packet traffic from multiple high-speed serial buses. A lightweight software control panel allows users to select analyzers for synchronization and manage the recording process. Captured traffic is displayed using the latest analyzer software (in separate windows) with all the protocol specific search and reporting features.
Captured packets are displayed in separate windows that share a common time scale. Navigating the traffic in either direction will scroll to the same timestamp in a synchronized window. When using the CrossSync option, users can access the full complement of analysis capabilities available within the individual Teledyne LeCroy software. Search, reporting, and decoding all operate normally (see CrossSync Control Panel).
Comprehensive Error Detection and Analysis
The system detects, and alerts you to, every potential bus error and protocol violation, and their combinations. The analyzer BusEngine™ circuitry performs real-time triggering on multiple error conditions, such as PID bad, bit stuffing bad, header or data CRC bad, end-of- packet bad, babble, activity loss, frame length violation, time-out or turn-around violation, and data toggle violation. The analyzer program highlights all hardware-detected errors and further examines the trace file for additional protocol errors, including wrong packet length, data payload violation, and packet termination not on a byte boundary.
Real-Time Event Triggering and Capture Filtering
The analyzer can accurately identify and selectively record transactions of interest from the crowded stream of bus traffic. The system uses more than a dozen configurable hardware building blocks that you can optimize to perform particular activities. Such “recording resources” can independently await an initialization signal, monitor its external environment (external signals or other resources) in search of a particular event, and take a subsequent action, such as triggering, inclusive or exclusive filtering, and counting. In the user interface, you can select, configure, and combine these resources to search for complex trigger conditions and selectively capture associated transactions.
The system can trigger on basic events, such as specific bus conditions and packet identifiers (PID). It can also trigger on complex events, such as “trigger on the fifth occurrence of a SETUP Token device number nine” or “trigger on a SET INTERFACE request, following a specified eight-byte bulk data pattern match from this scanner, and do not capture any start-of-frame (SOF) packets.”
You can set the size of the recording memory, specify the pre-trigger to post-trigger capture ratio, and truncate large data packets up to 256 bytes.
Advanced Event Counting and Sequencing
The count and sequence options configure and control the order of events selected for triggering or filtering during data recording sessions.
Using this feature, you can specify a sequence of up to seven events that must occur before the analyzer triggers and finishes capturing data, allowing you to specify event types for recording. Without this feature, you may have to scroll through megabytes of recorded data to locate an occurrence of a sequence.
BusEngine Technology
The analyzer uses Teledyne LeCroy BusEngine Technology. The BusEngine core uses Electrically Programmable Logic Device (EPLD) technology and incorporates both a real-time recording engine and configurable building blocks that implement data/state/error detection, triggering, capture filtering, external signal monitoring, and event counting and sequencing. Like the flash-memory-based firmware that controls its operation, all BusEngine logic is fully field upgradeable, using configuration files.
General Analyzer Specifications
-
Fully complies with USB specification revisions
-
Uses field-upgradeable firmware and recording engine
-
Supports capture of Power Delivery 2.0 and 3.0 protocol and Configuration Channel “CC” events over the CC wire in the USB Type-C type cables (M4120, M480x, M4x, M310e, M310P, M310C, T2C, T2P)
-
Displays bus traffic using color and graphics in the user-friendly CATC Trace interface
-
Has free non-recording, view-only Trace Viewer software
-
Comes with an online manual
-
Self-diagnoses at power on
-
Uses software-upgradeable Exerciser function (M4120, M480x, M4x, M310e, M310P, M310C, M310, M3x)
-
Allows remote control of USB analyzers from a local PC or on a network
Common Physical Components
Teledyne LeCroy USB analyzer families share many components:
-
Plug-and-play USB installation
-
USB 3.2 Super-Speed connection to desktop or portable host machine (M4120, M480x, M4x, M310e, M310P, M310C, M310, M3x)
-
USB 2.0 Hi-Speed connection to desktop or portable host machine (T3, T2C, T2P, T2)
-
USB 3.2 USB Type-C™ type connectors for capture and generation USB 3.2 Super-Speed connection to desktop or portable host machine (M4120, M480x, M4x, M310e, M310P, M310C)
Integrated CATC Sync ports to support cascading analyzers or Cross-Sync configurations USB 3.2 Super-Speed connection to desktop or portable host machine (M4120, M480x, M4x, M310e, M310P, M310C, M310, M3x)
Recording Options
Teledyne LeCroy USB analyzers share recording options:
-
Versatile triggering: bit-wise value and mask data patterns up to sixteen bytes wide for Setup transactions and data packets
-
Triggering on High-Speed PIDs and split transaction special tokens (ERR, SPLIT, PING, NYET, DATA2, and MDATA) (USB 2.0)
-
CATC Trace display and enumeration of High-Speed Micro Frames (USB 2.0)
-
Three forms of triggering: Snapshot, Manual, and Event
-
Transaction sequencer: Allows triggering on a token qualified by a data pattern and/or specific handshake, or can filter transactions (for example, NAK’d transactions) (USB 2.0)
-
Advanced triggering with event counting and sequencing
-
Dedicated trigger for recording input and output used to interface to external test equipment (Optional purchase item for T2P, T2C, T2)
-
Triggering on multiple error conditions: PID bad, bit stuffing bad, CRC bad, end- of-packet bad, babble, activity loss, frame length violation, time-out or turn- around violation, data toggle violation, Token, Bus Conditions, Data Length, and excessive empty frames (USB 2.0)
-
Real-time traffic capture filtering and data packet truncation variable up to 256 bytes (USB 2.0)
-
Adjustable buffer size
-
Up to 32 GB (M4120, M480x, M4x)
-
Up to 16 GB (M310, M310e M310P, M310C)
-
Up to 4 GB (M3x)
-
Up to 2 GB (T3)
-
Up to 512 MB (T2P)
-
Up to 256 MB (T2C, T2)
-
-
Idle filtering
Display Options
Many display options are the same for different analyzers.
-
Uses the CATC Trace graphical display of bus packets, transactions, split transactions, and transfers
-
Groups numerous packets and transactions under a single transfer while quickly decoding all essential information
-
Decodes split transactions upstream and downstream of a transaction translator with a special hierarchical view
-
Has reports summarizing key statistics and conditions of interest, with the ability to jump to the selected item in the trace display
-
Indicates trigger position by different pre-trigger and post-trigger packet colors
-
Sets markers to assist with navigation and time calculations. Each marker can contain unique comments
-
Hides start-of-frame (SOF) packets, as well as any packet or transaction from a device address and endpoint
-
Searches for a specific PID
-
Detects and alerts to every potential bus error and protocol violation, and their combinations
-
Has high-resolution, accurate time stamping of bus packets and timing measurement and analysis functions
-
Allows search and packet hiding
-
Allows device class decoding and user-defined protocol decoding
-
Has a Data View (USB 2.0 and USB 3.2)
-
Uses Link Tracker to view symbols of traffic (not available on Mercury-series analyzers)
-
Uses a Spec View to show packets in the same format as the USB 3.2 specification (not available on Mercury-series analyzers)
-
Uses Quick Timing Markers to immediately show time deltas and bandwidth use
-
Power Tracker view shows Current and Voltage samples coordinated with Packet timestamps.
LFPS Signals
Voyager M4120, M480x, M4x, M310e, M310P, M310C, M310
Voyager Exerciser requires received “Ping” LFPS signals to be a minimum of 50 nanoseconds to be reliably recognized. Voyager Analyzer can recognize “Ping” LFPS signals above 60 nanoseconds and report their durations to ±70 nanoseconds of accuracy, typically ±15 nanoseconds.
Voyager M3x
Voyager Exerciser requires received “Ping” LFPS signals to be a minimum of 150 nanoseconds to be reliably recognized. Voyager Analyzer can recognize “Ping” LFPS signals above 60 nanoseconds and report their durations to ±15 nanoseconds of accuracy.
Traffic Generation (M4120, M480x, M4x, M310e, M310P, M310C, M310, M3x)
USB 2.0 and USB 3.2 traffic generation options allow you to transmit custom packets over standard USB cables with low-level control of headers, payloads, timing, and link states.
USB 2.0 Trainer
The USB 2.0 Trainer can play back trace files bit-for-bit, allowing validation engineers to recreate problems reported in the field or test-specific functionality.
To build 2.0 generation script files, you can edit example test scenarios or export any traffic stream from a previously recorded trace. The 2.0 Trainer includes a Generation Script Editor.
A script pre-processor allows you to organize script code and create reusable generation blocks.
The Voyager USB 2.0 Trainer can transmit low, full, or high-speed traffic and supports both host and device emulation. It is backward compatible with existing USBTrainer traffic generation scripts.
For USB 2.0 applications, the Trainer supports both bitstream mode or Intelliframe mode. In Intelliframe mode, the Trainer can wait for the appropriate response from the DUT before transmitting the next packet. For example, after issuing an IN, the generator waits for the DATAx packet returned by the device to finish, and then issues an ACK. When NAKs are received, the Trainer can automatically resend the previous packet.
USB 3.2 Exerciser ReadyLink™ Emulation
The Teledyne LeCroy Voyager USB 3.2 Exerciser features ReadyLink Emulation Mode. The ReadyLink feature handles all USB 3.2 link training and link flow control, allowing the emulator to operate at full line rate and respond to the DUT as defined by the specification. The ReadyLink Emulation Mode helps simplify development of USB 3.2 test scenarios.
By default, ReadyLink Emulation Mode automatically manages:
-
Header Packet Acknowledgments (L_GOOD_n)
-
Buffer Credit (L_CRD_x)
-
SKIPs at required intervals (SKP)
-
Link Synchronization
-
Responds to LFPS (Polling.LFPS)
-
Responds to polling sequence (Polling.RxEQ)
-
Responds to TS1/TS2 handshaking sequence
-
Responds to SS.Inactive (with RX.Detect)
-
Responds to 3.2 SS+ LPBM and SCD1 and SCD2 LFPS messages
-
-
Power Management Link Commands
-
Responds to LGO_Un (with LAU)
-
Responds to LAU (with LMPA)
-
Test scripts can customize ReadyLink Emulation Mode to include error scenarios, such as:
-
Header LBADs
-
Invalid link commands
-
8B10B/CRC Error
-
Running Disparity Error
-
Corrupt Link Commands
-
Corrupt Flow Control (Wrong L_CRD_x, Wrong L_GOOD_n, Drop L_Good_n)
-
Corrupt Header Packet acknowledgment (Send LBAD, LRTY)
-
Corrupt Packet Framing (SHP, SDP, END)
At the packet level, you can send customized data payloads anywhere within the stream to insert logic errors, perform corner-case, or do stress testing. Commands, such as the Set ErrWrongLCRD command, allow link-layer error injection anywhere within the script.