
After installing and launching the software, you can follow these steps to test the system:
-
Connect a USB cable to each of the two connectors on the analyzer, then connect the other ends to the USB device under test and USB host.
NOTE: During connect/disconnect testing, always plug/unplug the “B” or “2/ Right” connector on the analyzer (connected to the Host under Test), to insure that the host machine detects the event properly. In some cases, using the “A” or “1/Left” connector (attached to your Device) for this purpose can cause the host machine to misinterpret the terminations.
-
Select Setup > Recording Options on the Menu Bar.
-
Select the General tab to display a window showing factory default settings, such as Snapshot and 4 MB buffer size.
-
For the first recording, you can leave these settings unchanged.
-
Under Recording Channels, select 2.0 to record USB 2.0 traffic.
-
Click OK to activate the selected recording options.
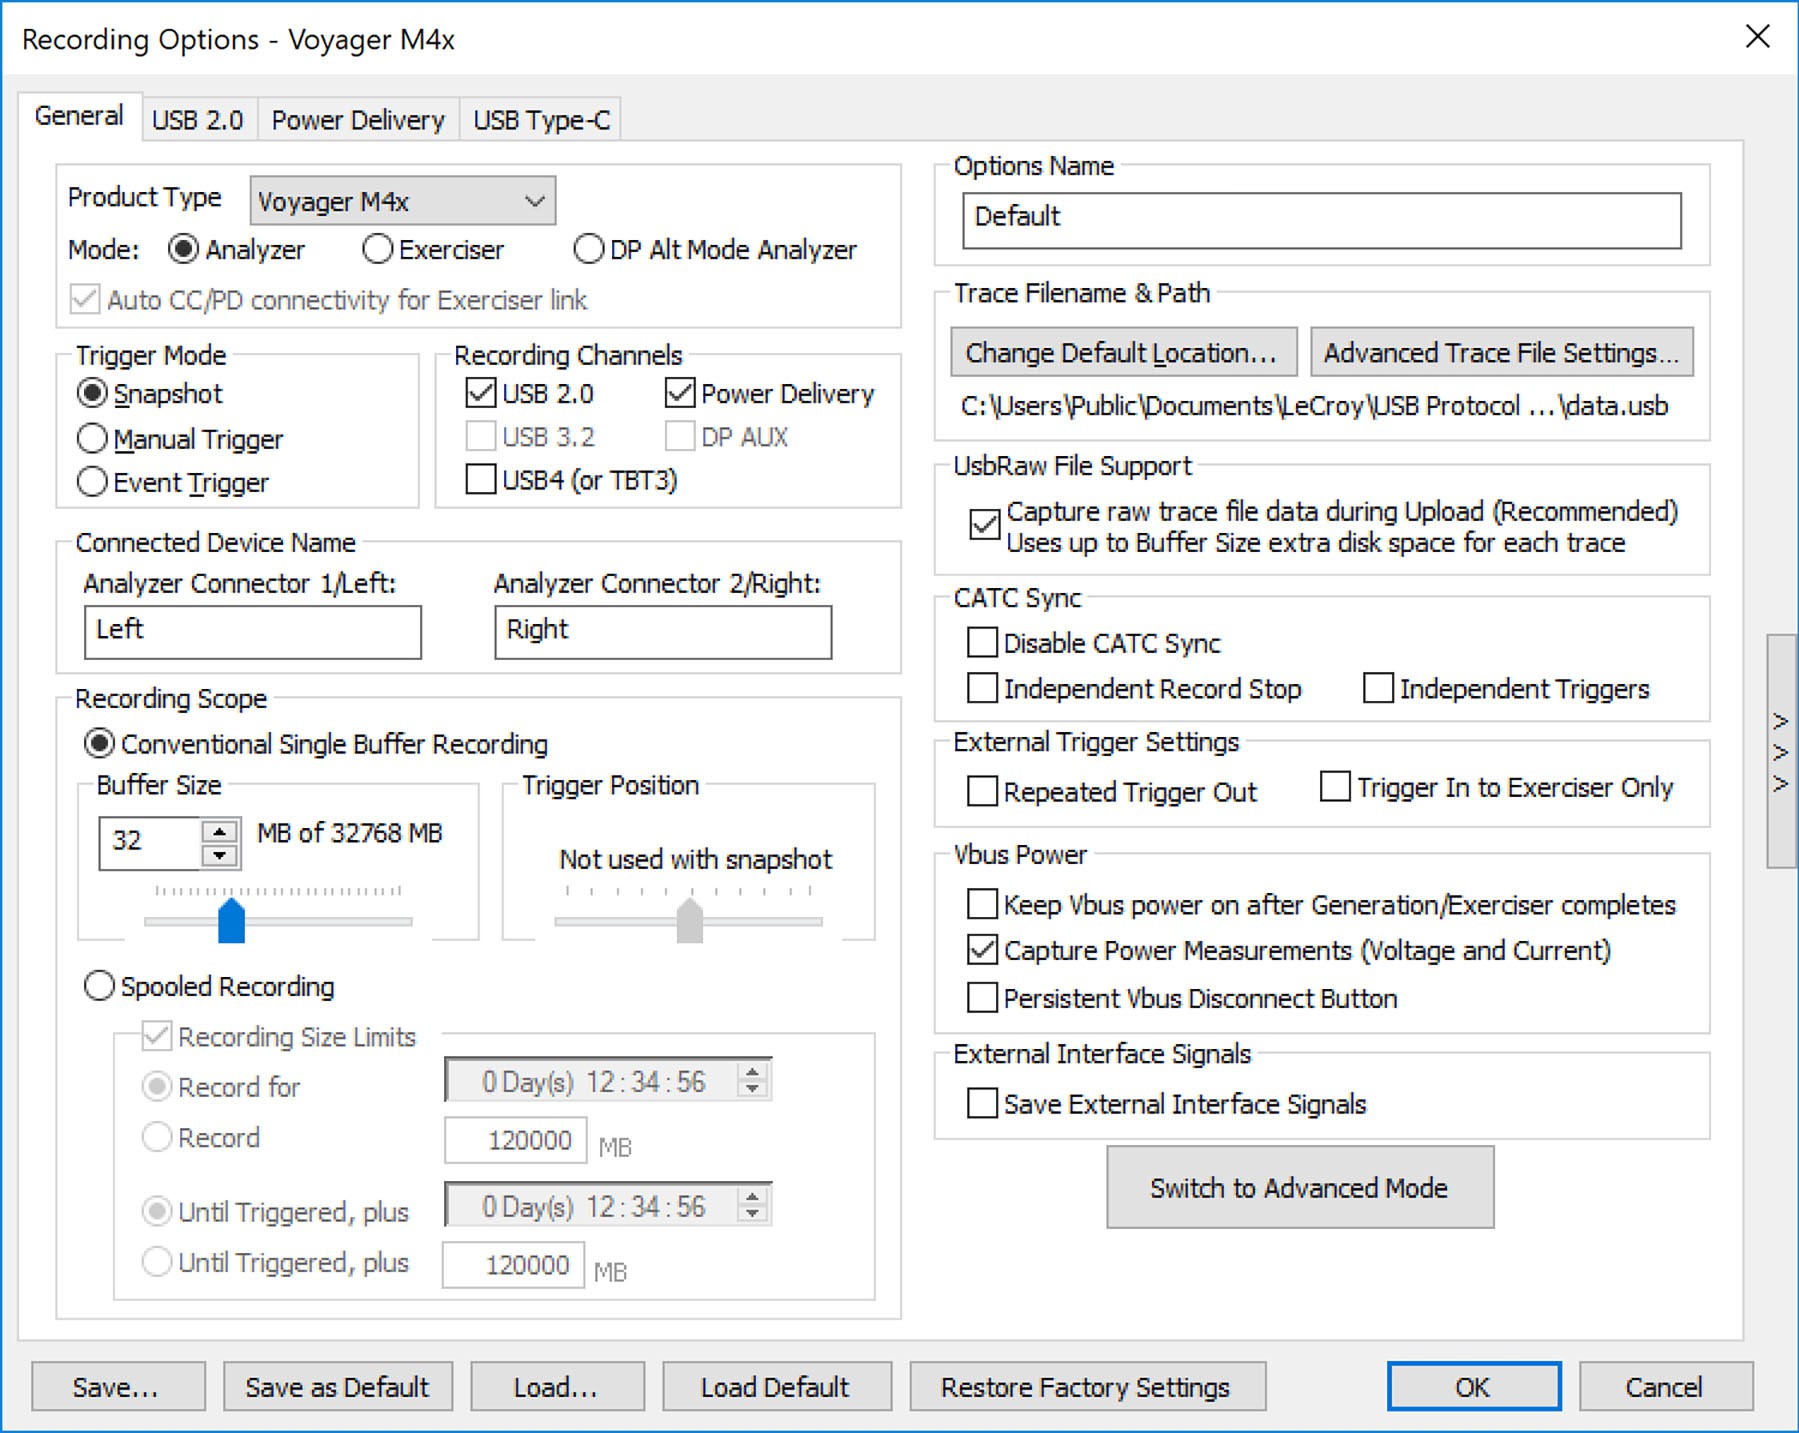
Recording Options: Voyager M4x
-
-
Turn on the USB devices that are to be tested and have them generate USB traffic.
-
Click

-
The system starts to record the USB traffic immediately. After 4 MB of traffic are recorded, the analyzer uploads the data and displays the packets in the trace window.
-
To terminate recording before the snapshot automatically completes, click

-
When the recording session finishes, the traffic uploads from the analyzer to the hard drive on your host machine as a file named data.usb or the name you assigned as the default filename. While the file is uploading, you should see a brown progress bar at the bottom of the screen. When the bar disappears, the data has uploaded to disk.
-
To save a current recording for future reference, do one of the following:
-
Select File > Save As on the Menu Bar, enter a unique name for the recording, and save it to the appropriate directory.
-
Click

NOTE: Options not supported by your hardware are either inactive or not shown.
Trace View Features
After the recording terminates, the results display.
-
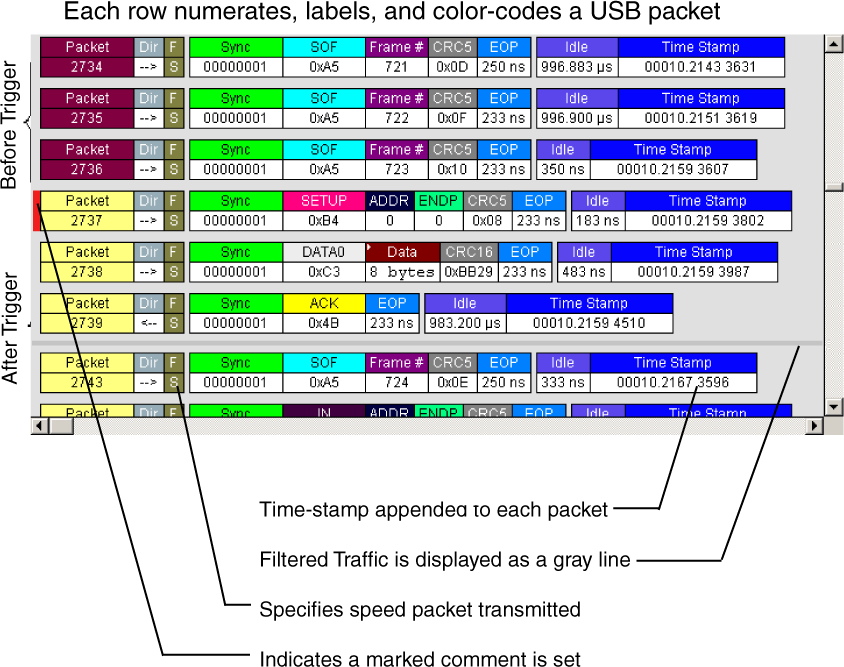
The packet view uses color and graphics to document captured traffic.
-
Packets are on separate rows; individual fields are labeled and color-coded.
-
Packets are numbered sequentially (as recorded), time-stamped (with a resolution of 2ns on 3.2 signaling), and highlighted to show the transmitted speed (low-speed, full-speed, high-speed, or SuperSpeed).
-
You can name and save display formats for later use.
-
Data fields can collapse to occupy minimal space in the display.
You can start the application from the Desktop or from the installed directory.
The display software can operate independently of the analyzer. When used without the analyzer, the program functions in a Trace Viewer mode to view, analyze, and print captured protocol traffic. When used with the analyzer, you can set trigger conditions, record, monitor, and analyze the activity of your USB bus.