NOTE: Power Capture can only be enabled on licensed analyzer models.
VBUS Power Tracker
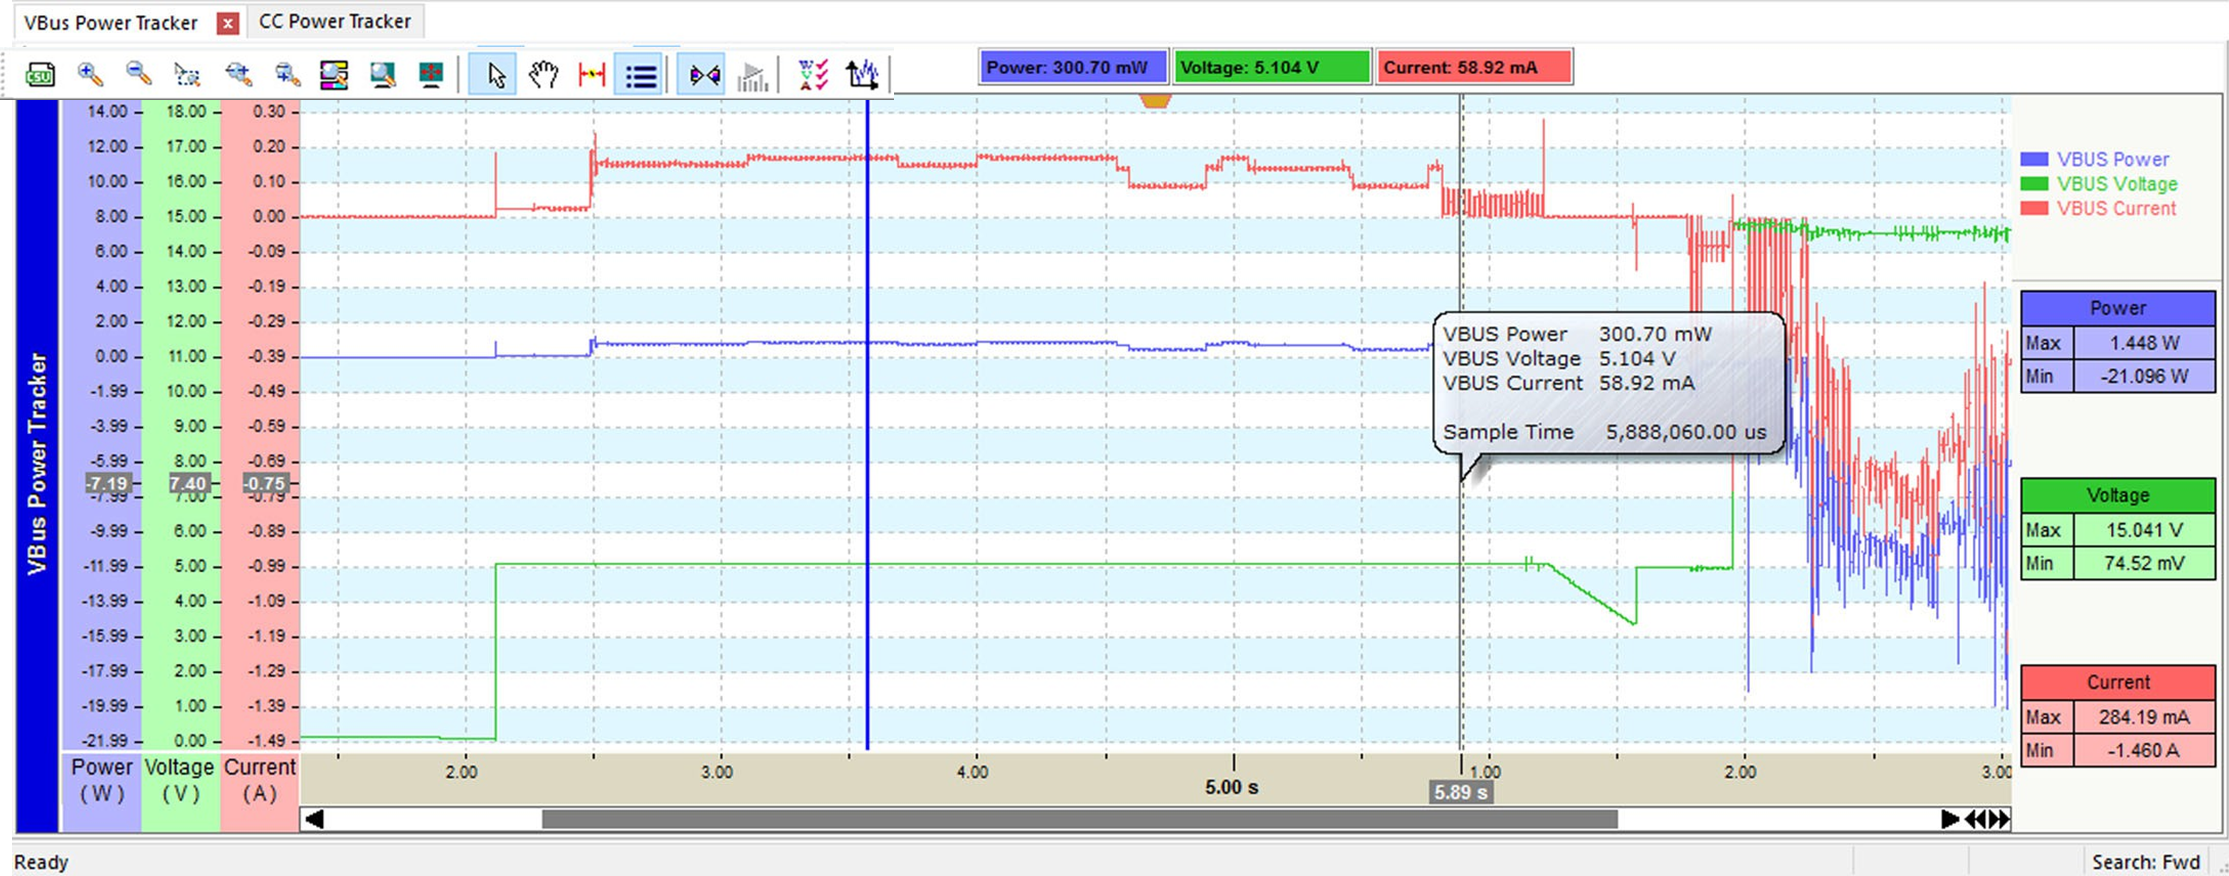
The Power Tracker displays the power, voltage and current at each point in time. Power Tracker assumes the direction of current flow is from the Right connector (“2”) to the Left connector (“1”) which is the behavior if a normal USB Device was connected to the Left connector, and the Host was connected to the Right connector. If the direction of current flow is going the OTHER way, it is shown as a Negative value. With Power Delivery and Type-C, there are many situations where current can flow in either direction, so we just use this orientation as our standard. For the Exerciser port, we use the Voyager supplying current as the Positive value, and the Voyager sinking current as the Negative value.
NOTE: Current direction or direction of current flow can be used to search for this section.
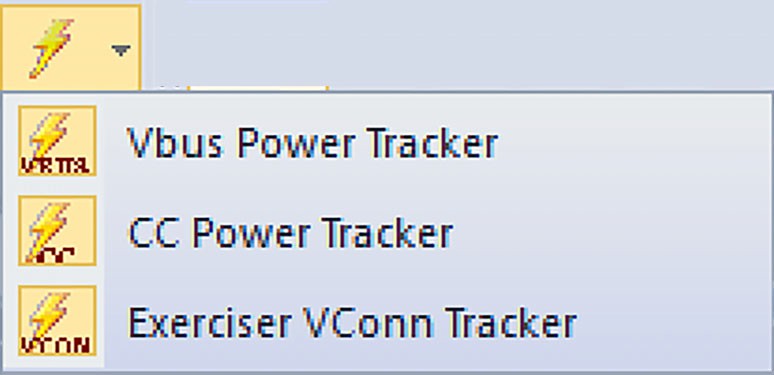
Go to Report > Power Tracker, or click 
-
When you select VBUS Power Tracker, the Power, Voltage, and Current waveforms are displayed.
-
When you select CC Power Tracker, the Configuration Channel voltage is displayed.
-
When you select VCONN Tracker, the power used on the VCONN connection is presented. On the M310P/M310e, this will apply to the Exerciser port. On the Mercury T2P, this will apply to whatever analyzer connector was selected in the Recording Options. See Configuration Channel (CC) Power Tracker.
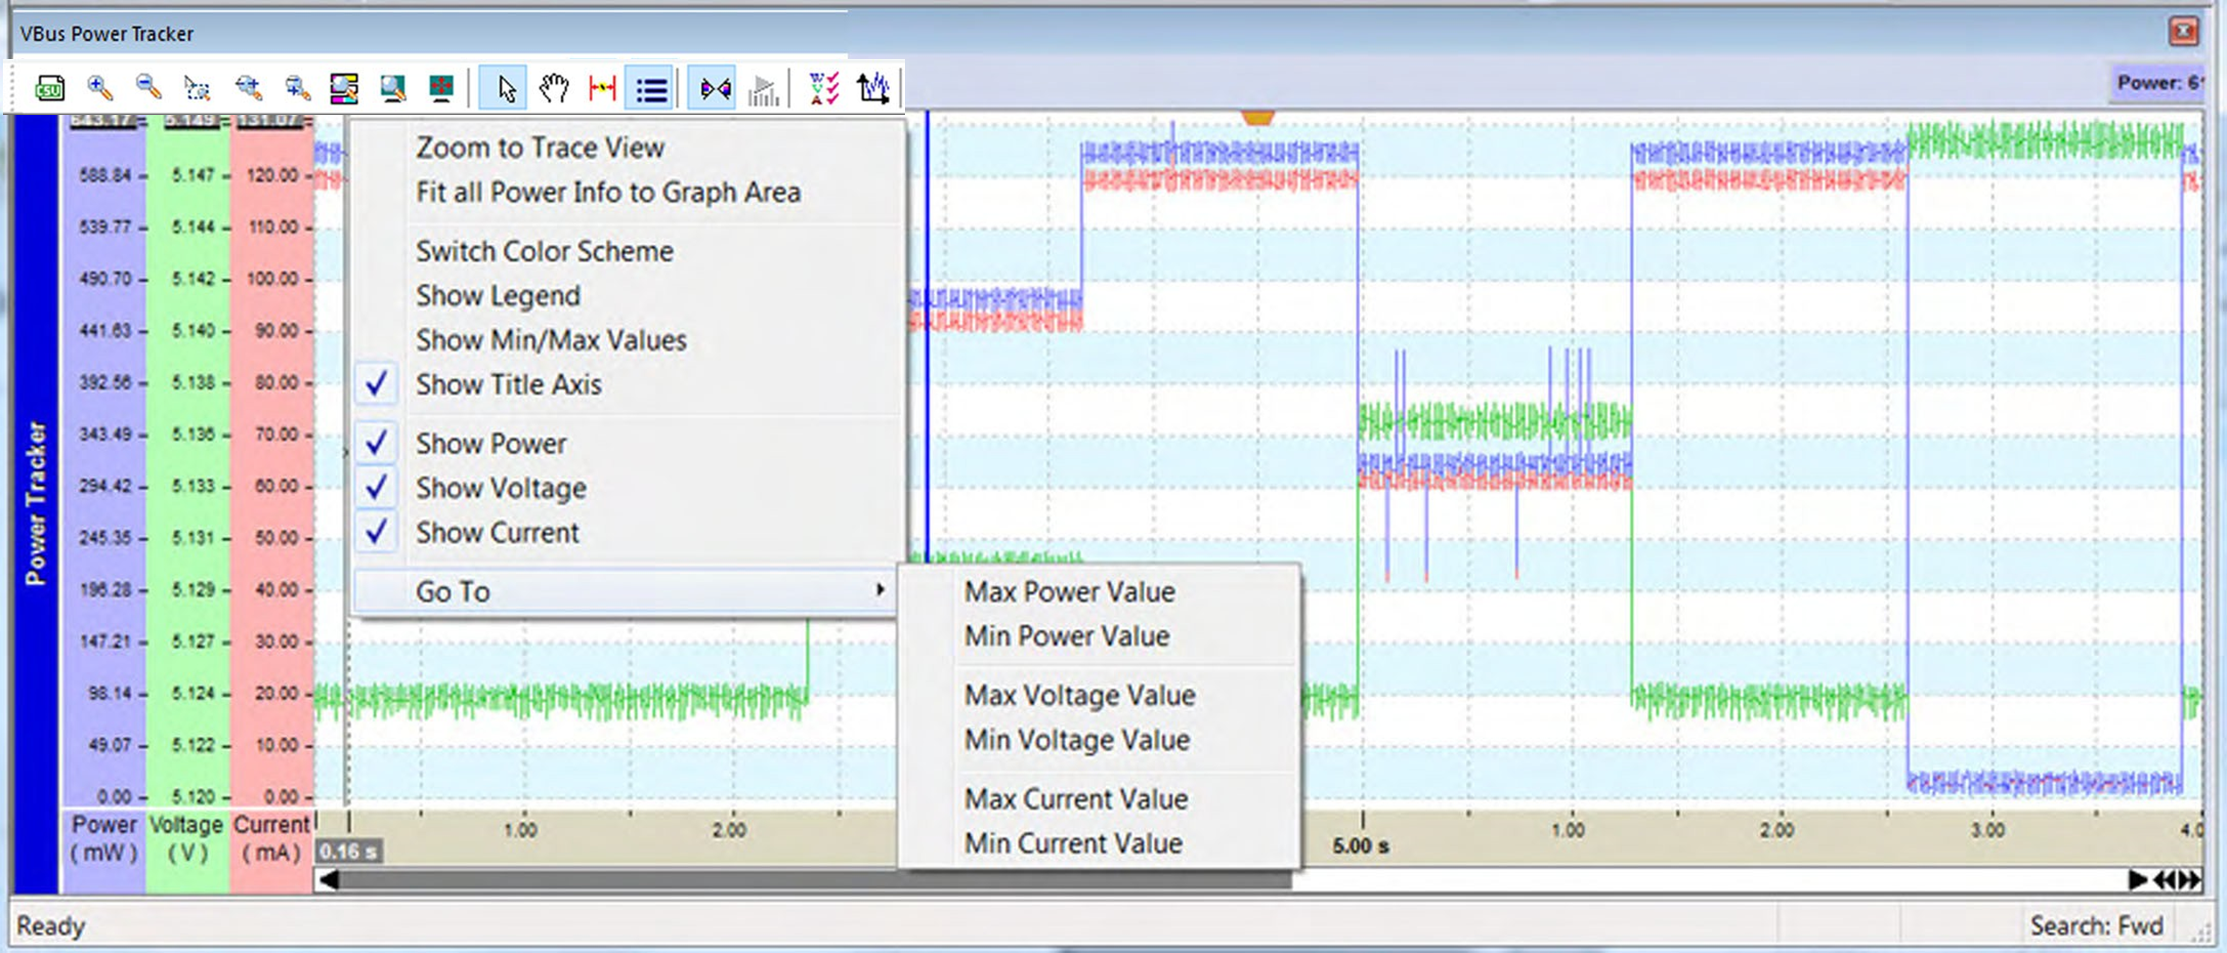
If you right-click within the display, the following window appears.
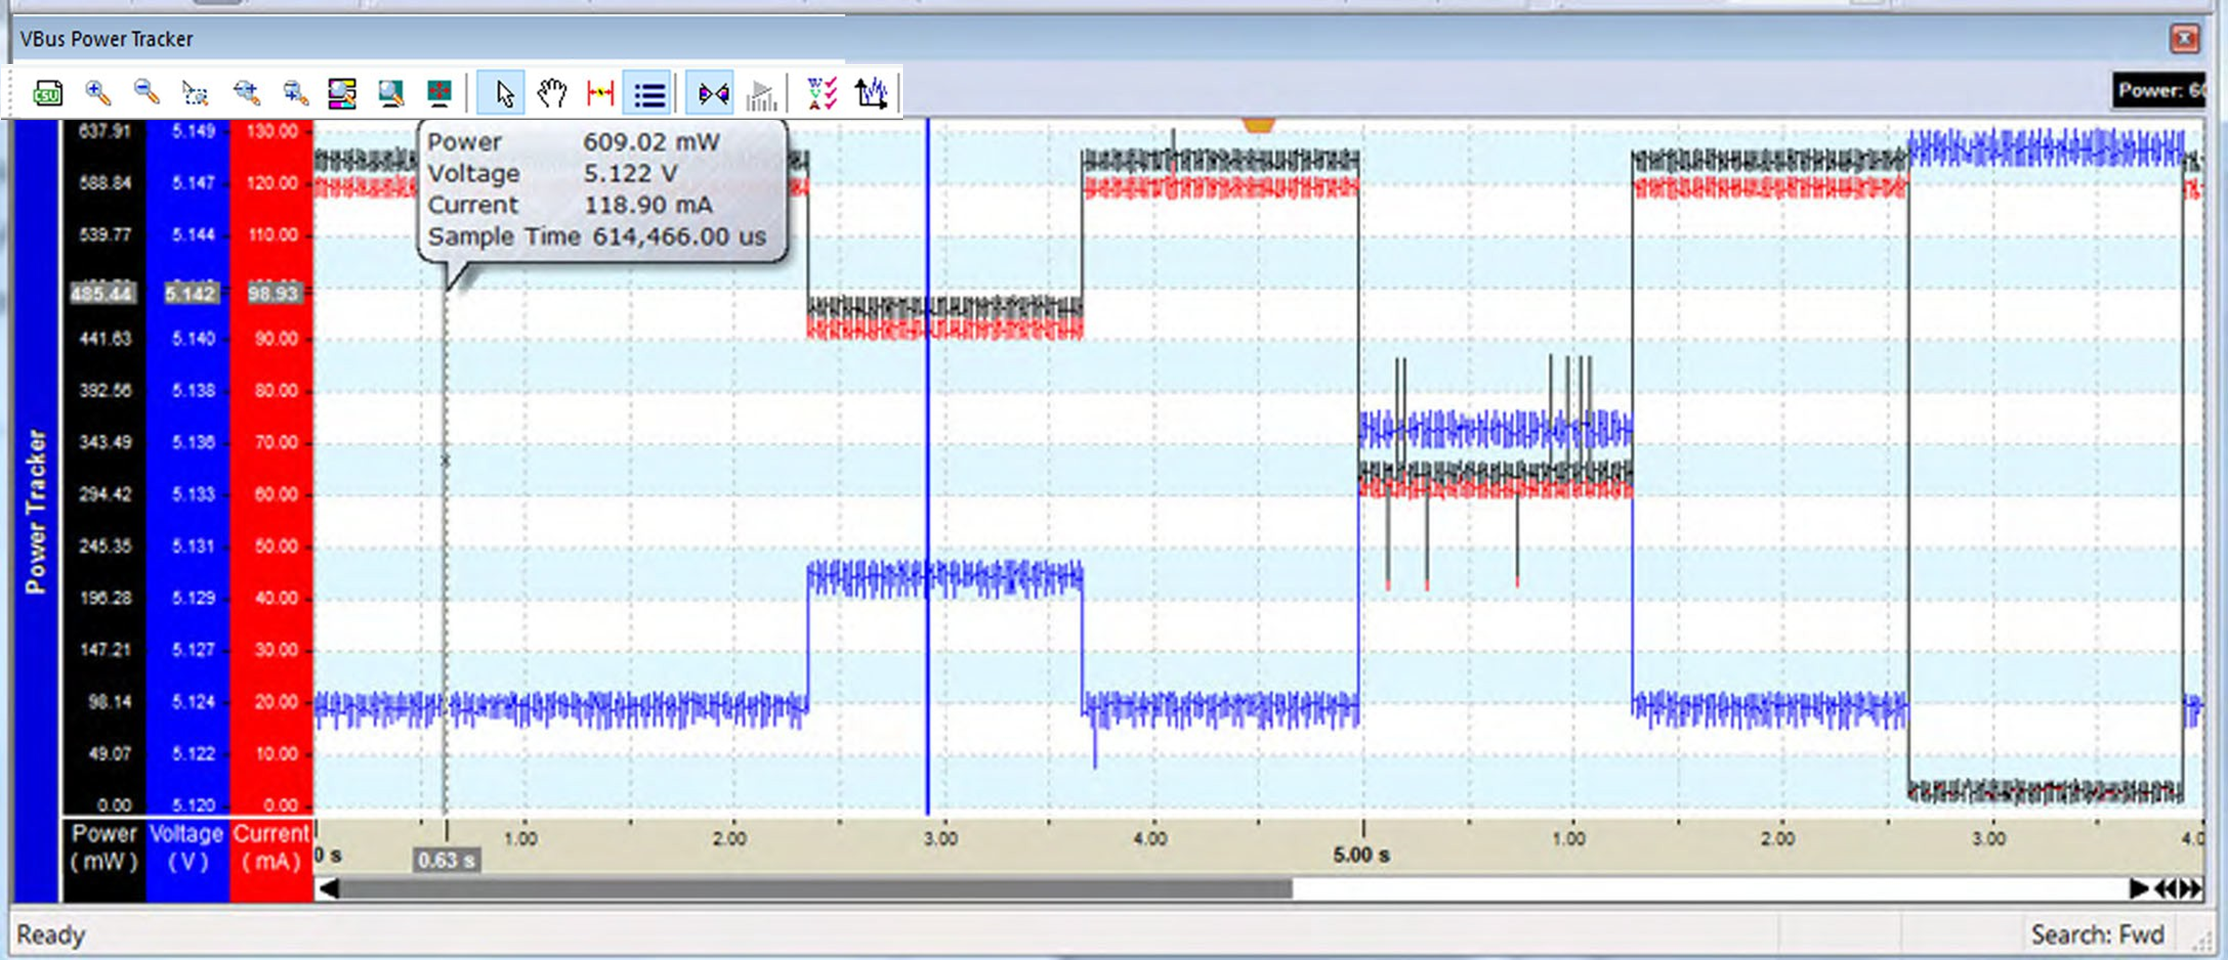
If you select Switch Color Scheme the Power, Voltage, and Current background colors change to black, blue, and red.
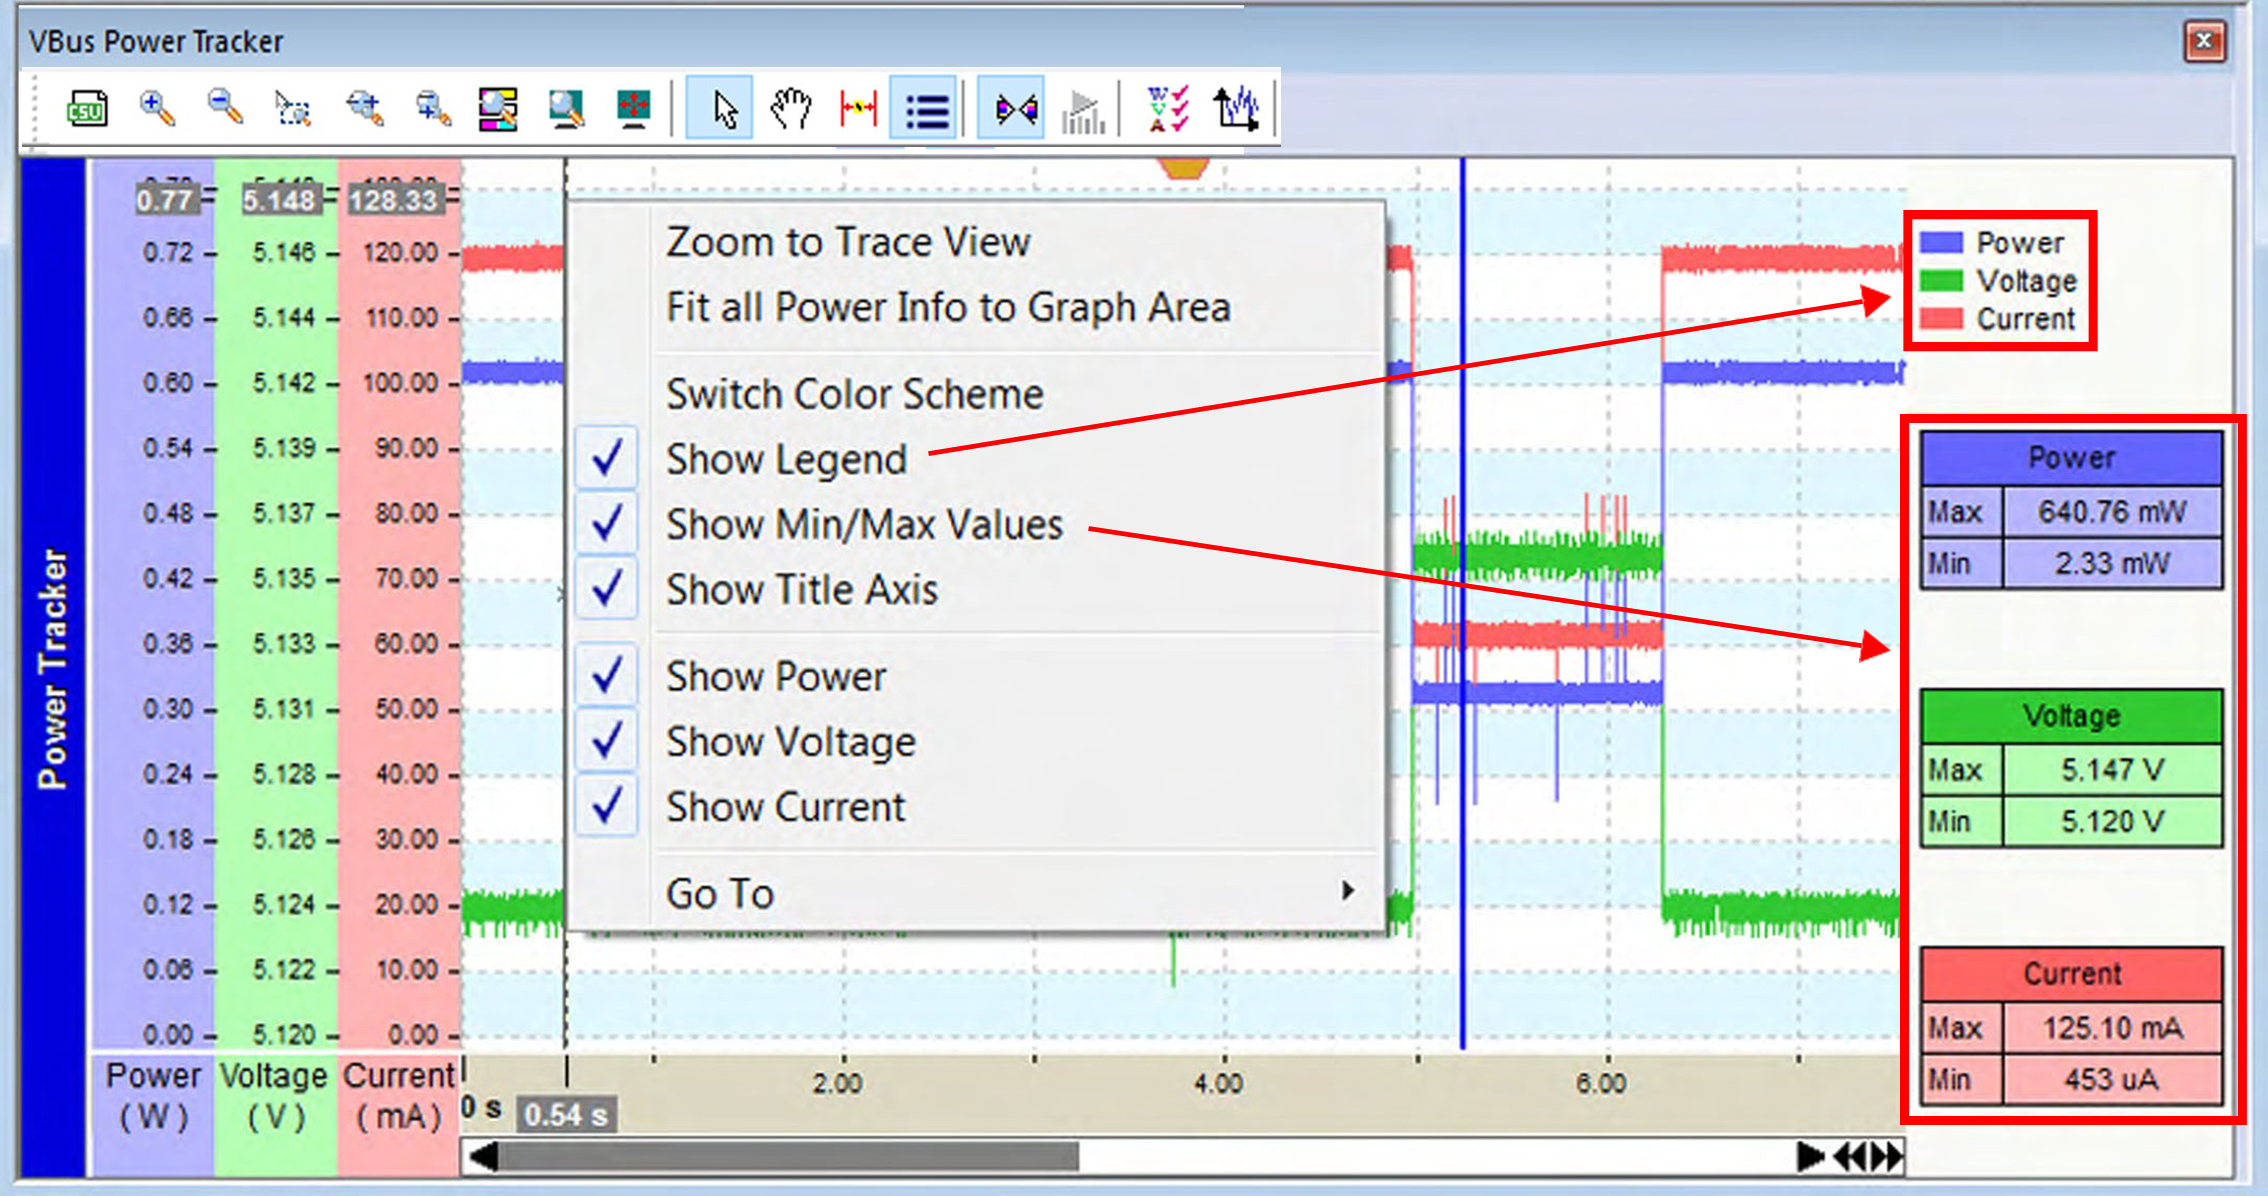
If you select Show Legend and Show Min/Max Values, they appear in the display.
Power Tracker Options
If you select Power Tracker from the Report menu, you can select Hide, Full Screen, Sync by Time, or Real Time Monitor (see Power Tracker Toolbar, below).
-
The left side shows power, voltage, and current levels. Right-clicking a column allows you to select the vertical-scale origin. The origin is 0 or near the minimum measurement value.
-
The horizontal axis shows time in milliseconds. You can navigate with the slider. The slider sets the left vertical line. The distance to the right dashed vertical line represents the sampling interval.
-
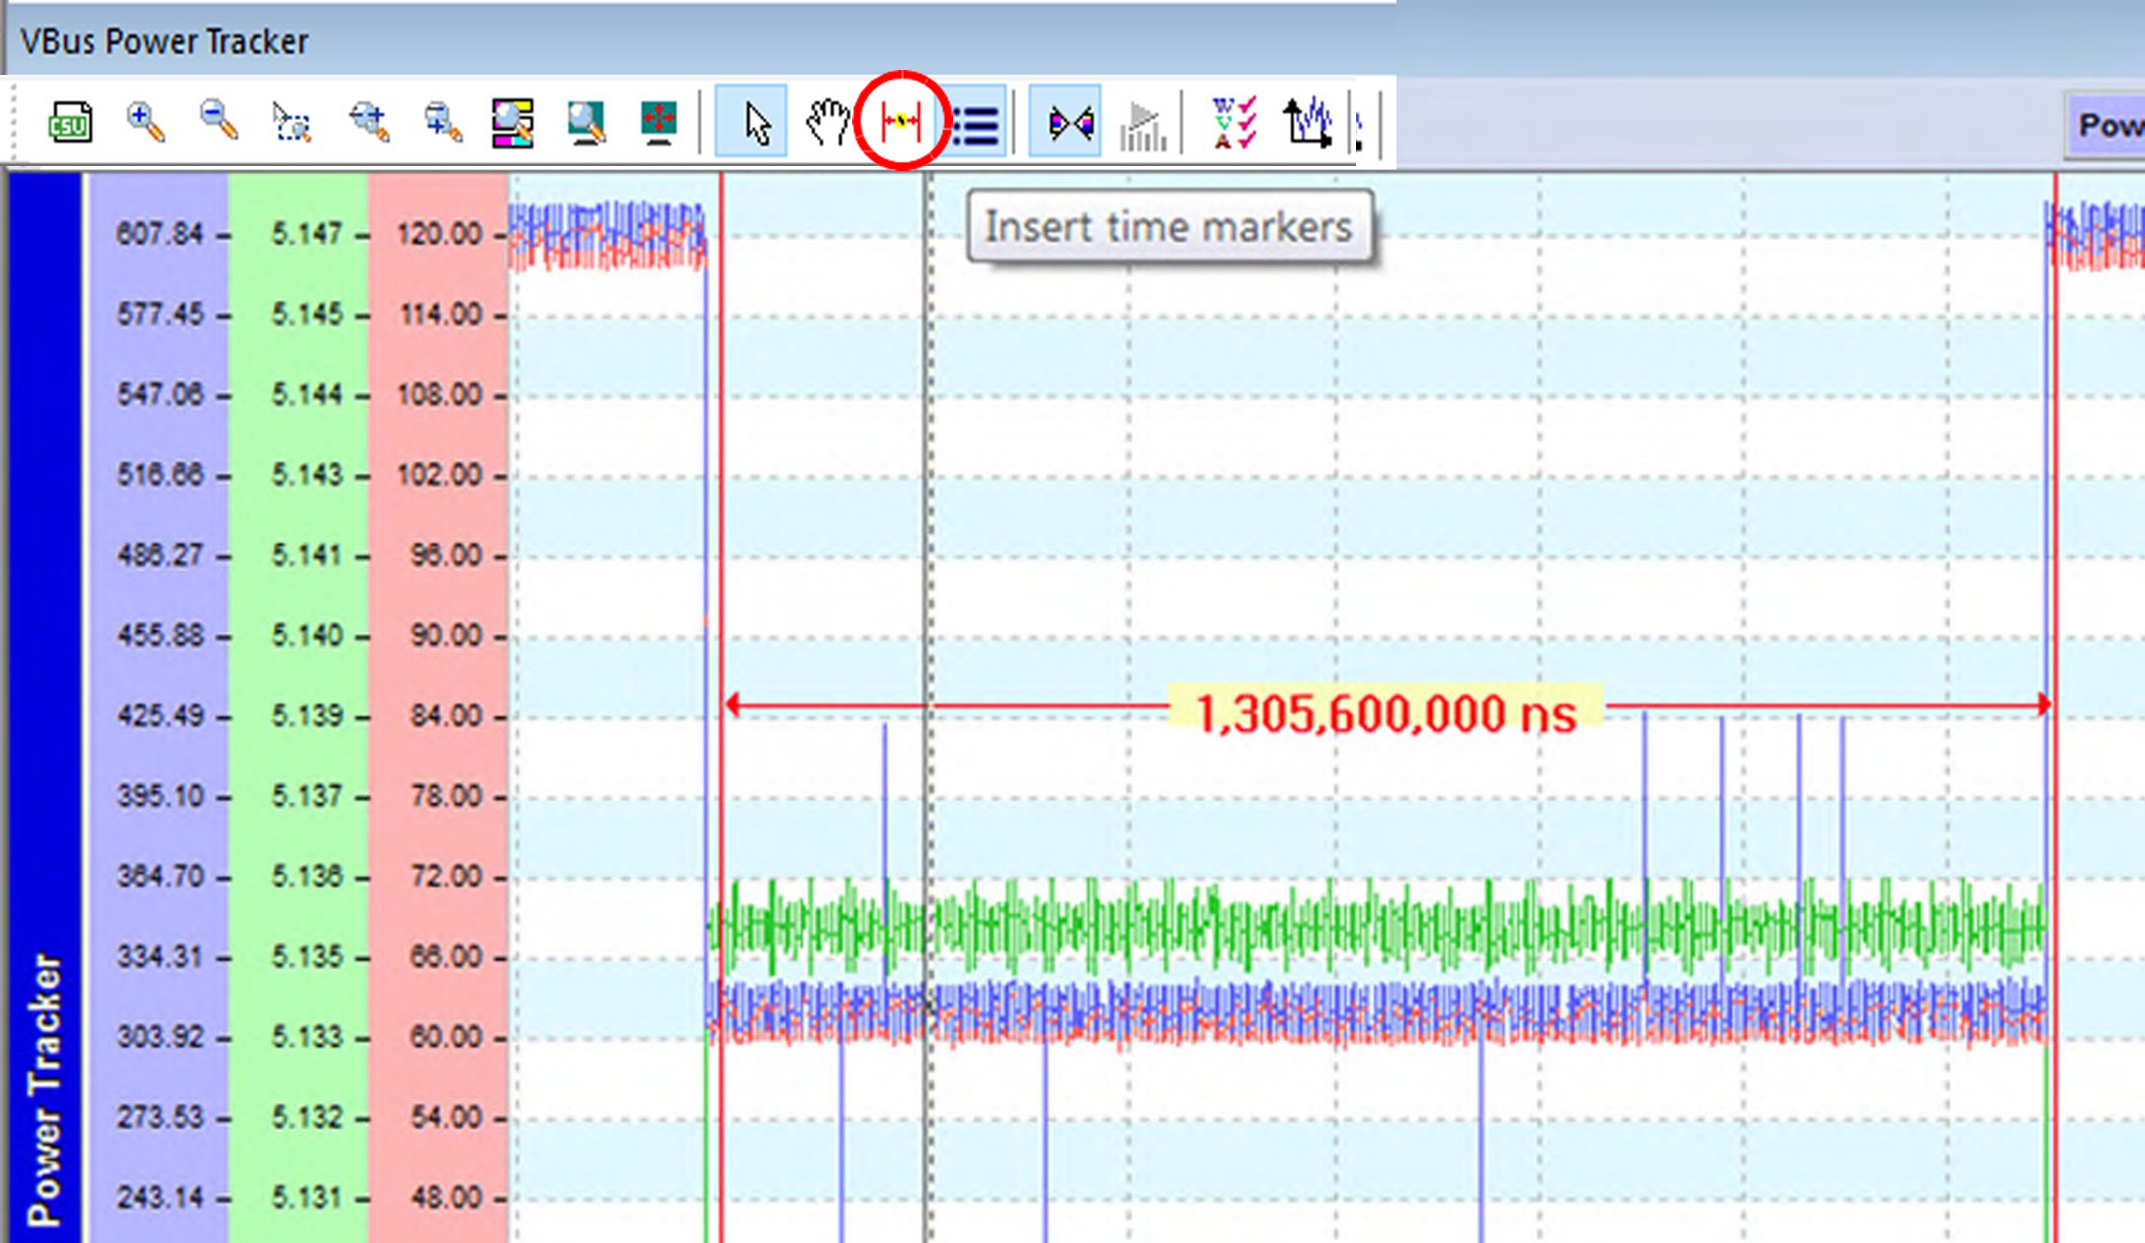
You can use time markers to measure times in this view. To delete markers, right-click the marker and select Delete Marker(s).
-
You can show/hide minimum and maximum values for Power, Voltage, and Current by right-clicking and choosing Show Min/Max Values from the popup menu.
NOTE: The Min or Max values presented here are not exactly the same as those shown in the CATC or Spreadsheet views. This is because this view presents the values as they exist when sampled at 20 microsecond intervals. The values shown in the Packet type views are linearly interpolated from these samples to show the approximate value at the time the packet is timestamped.
-
You can go to the time at which Minimum or Maximum values of Power, Voltage, or Current occur by right-clicking and choosing Go To from the popup menu and then choosing a submenu item.
-
The Power Tracker samples are acquired from the start of the recording to the finish. Since packet traffic or other “Bus Condition” events can start long after the recording starts or finish long before the recording ends, many power samples in these end ranges can “map” to the first packet or last packet in a trace. For all events, when synchronizing between the Power Tracker view and other views, the items associated in the other views are the ones closest in time to the timestamp of the Power Tracker sample.
NOTE: Power measurement accuracy for Current is +/- 10 mA. Power measurement accuracy for Voltage is +/- 50 mV. Power measurement accuracy for Power is +/- 50 mW.
-
The sampling interval of current and voltage is 20 µs (50 kHz) on Voyager analyzers and 100 µs (10 kHz) on Mercury T2P.
-
On Voyager M310P, M310e, M4x, and Mercury T2P, current-sensing circuitry and averaging filters are utilized to maximize measurement accuracy at low currents. Following large current transitions, readings may take several hundred milliseconds to fully settle to steady state.
Power Tracker Toolbar

NOTE: VBUS Voltage Values shown when running Power Delivery 2.0 Load Tests use built-in compensation factors to adjust for the voltage drop across the required cable: USB18CAB-X (926763-00). The voltage drop across this cable due to the current is added to each sample so that the voltage captured and displayed represents the value at the user's connector. This compensation is ONLY done during these Load tests, so all other Voltage values captured and shown are measured at the Voyager Connector and are unaware of cable voltage drops.
The buttons have the following functions:
|
Button |
Functionality |
|
Button |
Functionality |
|---|---|---|---|---|
|
|
Export Trace to CSV file (see VBUS Power Tracker Export to CSV File). |
|
|
Pointer Mode |
|
|
Zoom in |
|
|
Hand Panning |
|
|
Zoom out |
|
|
Insert Time markers. After clicking, click in the display to make a red vertical line. Select and drag the line to indicate a time interval between two lines. |
|
|
Zoom by Selection |
|
|
Show detailed information on the marker. Displays voltage and current slew rates between markers. |
|
|
Zoom by Horizontal Drag |
|
|
Sync by Time. Synchronize the USB 3.2 Link State Timing States View and the Trace View. |
|
|
Zoom by Vertical Drag |
|
|
Monitor during capture (Power Tracker Data Displayed in Real Time). |
|
|
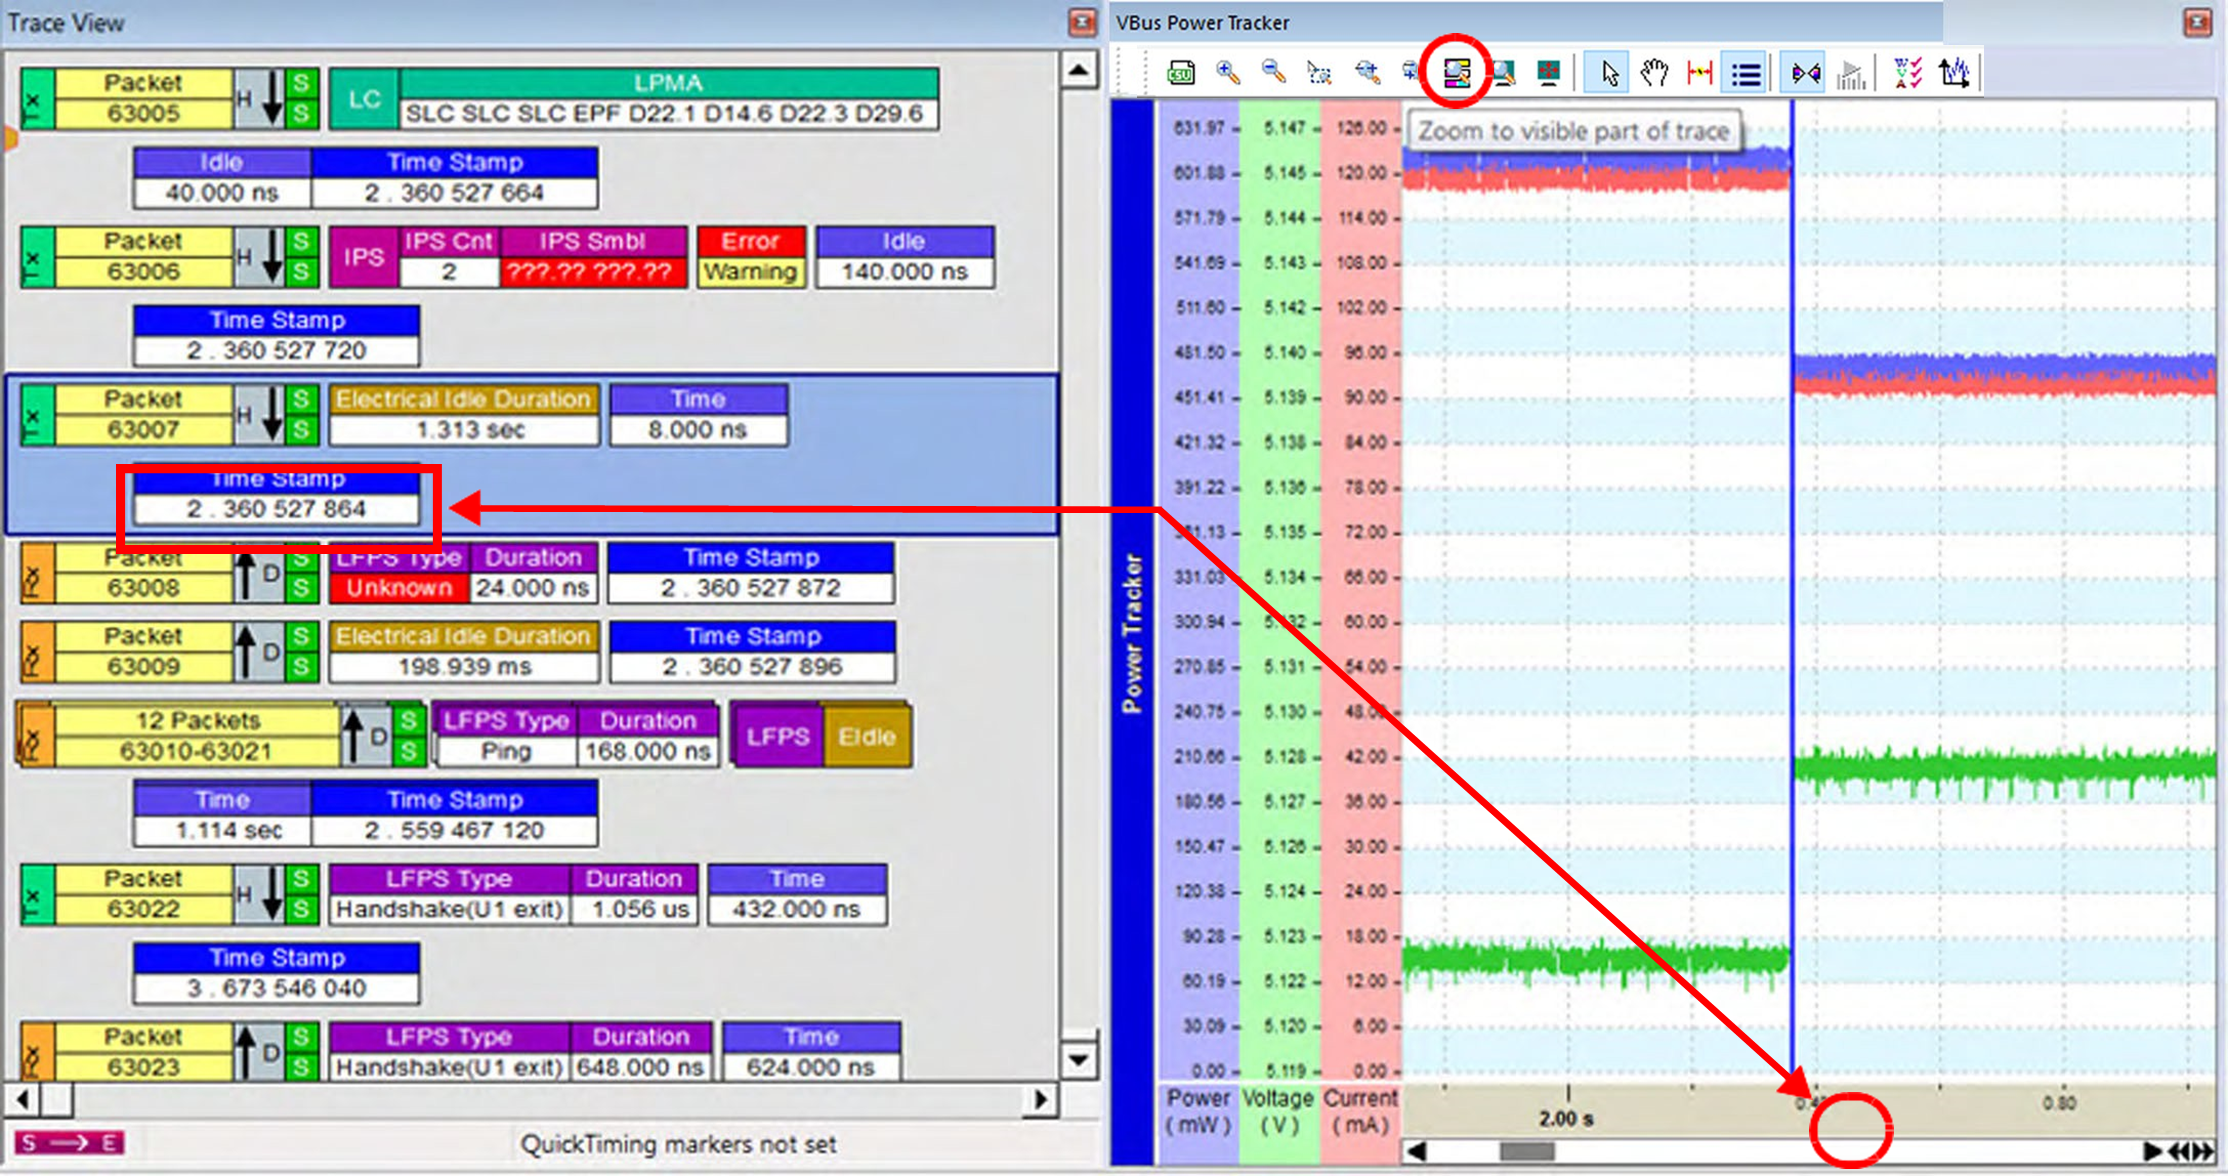
Zoom to Visible part of Trace (Power Tracker Info close to Packet of interest) |
|
|
Show/Hide Power Tracker Types: Power, Voltage, and/or Current |
|
|
Fit All Power Info to Graph Area (Power Info for Entire Trace Visible |
|
|
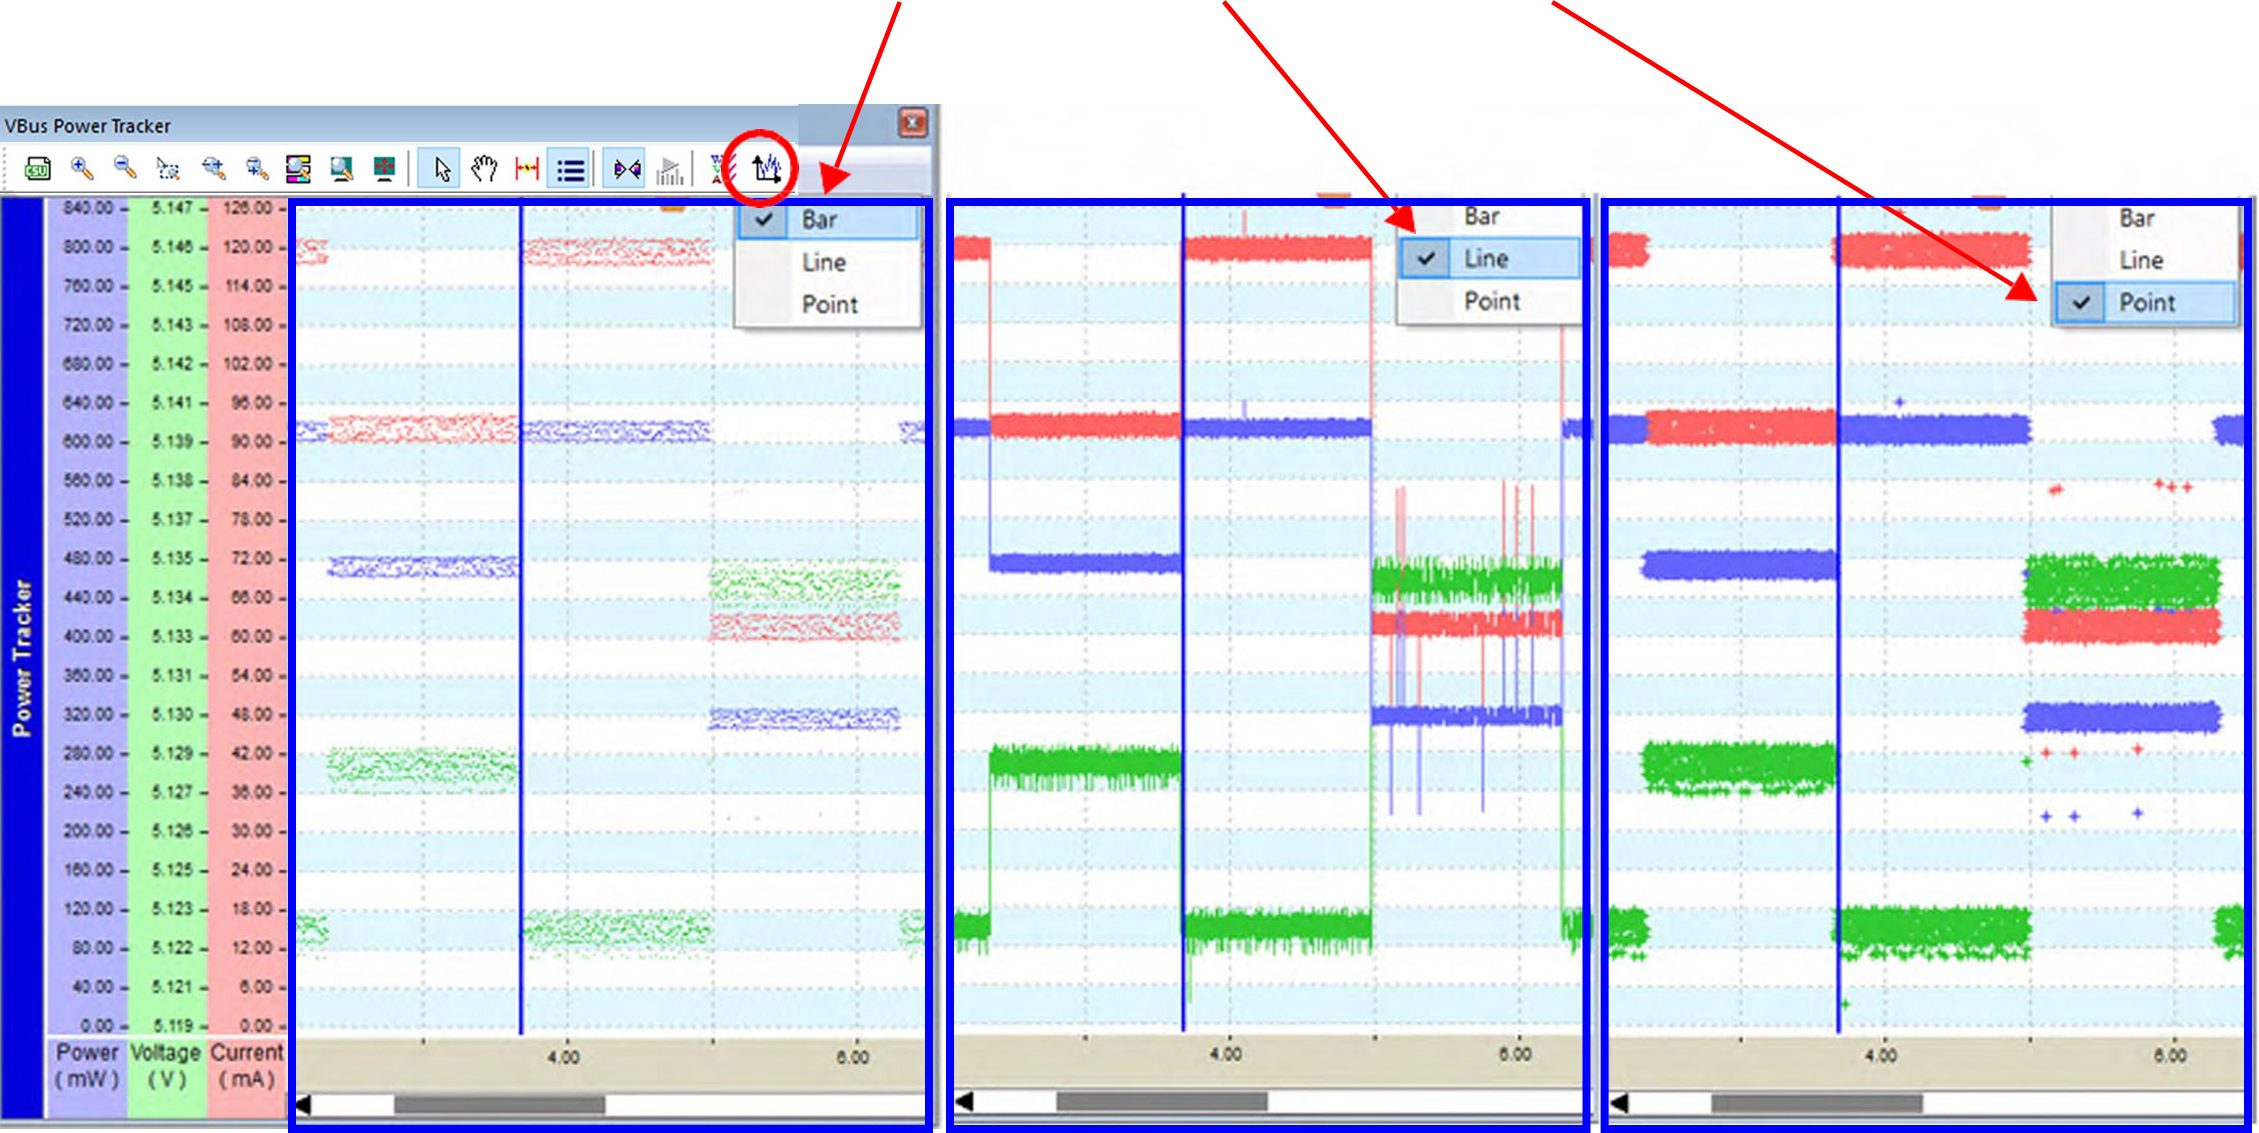
Change Power Tracker graph type: Bar, Line, and/or Point |
|
|
Full Screen |
|
|
Drop Compensation: When running USB PD 2.0 Compliance Load tests, the software can automatically compensate for the voltage drop across the Type-C cable being used during the test. This button toggles between the value we captured and the value that takes into account this extra cable voltage drop. |


Examples of the toolbar button effects are shown in the figures below.
Select Bar, Line or Points for Display of Power Tracker Data
Power Tracker—CC Power Tracker/VBUS Power Tracker Synced (Beta)
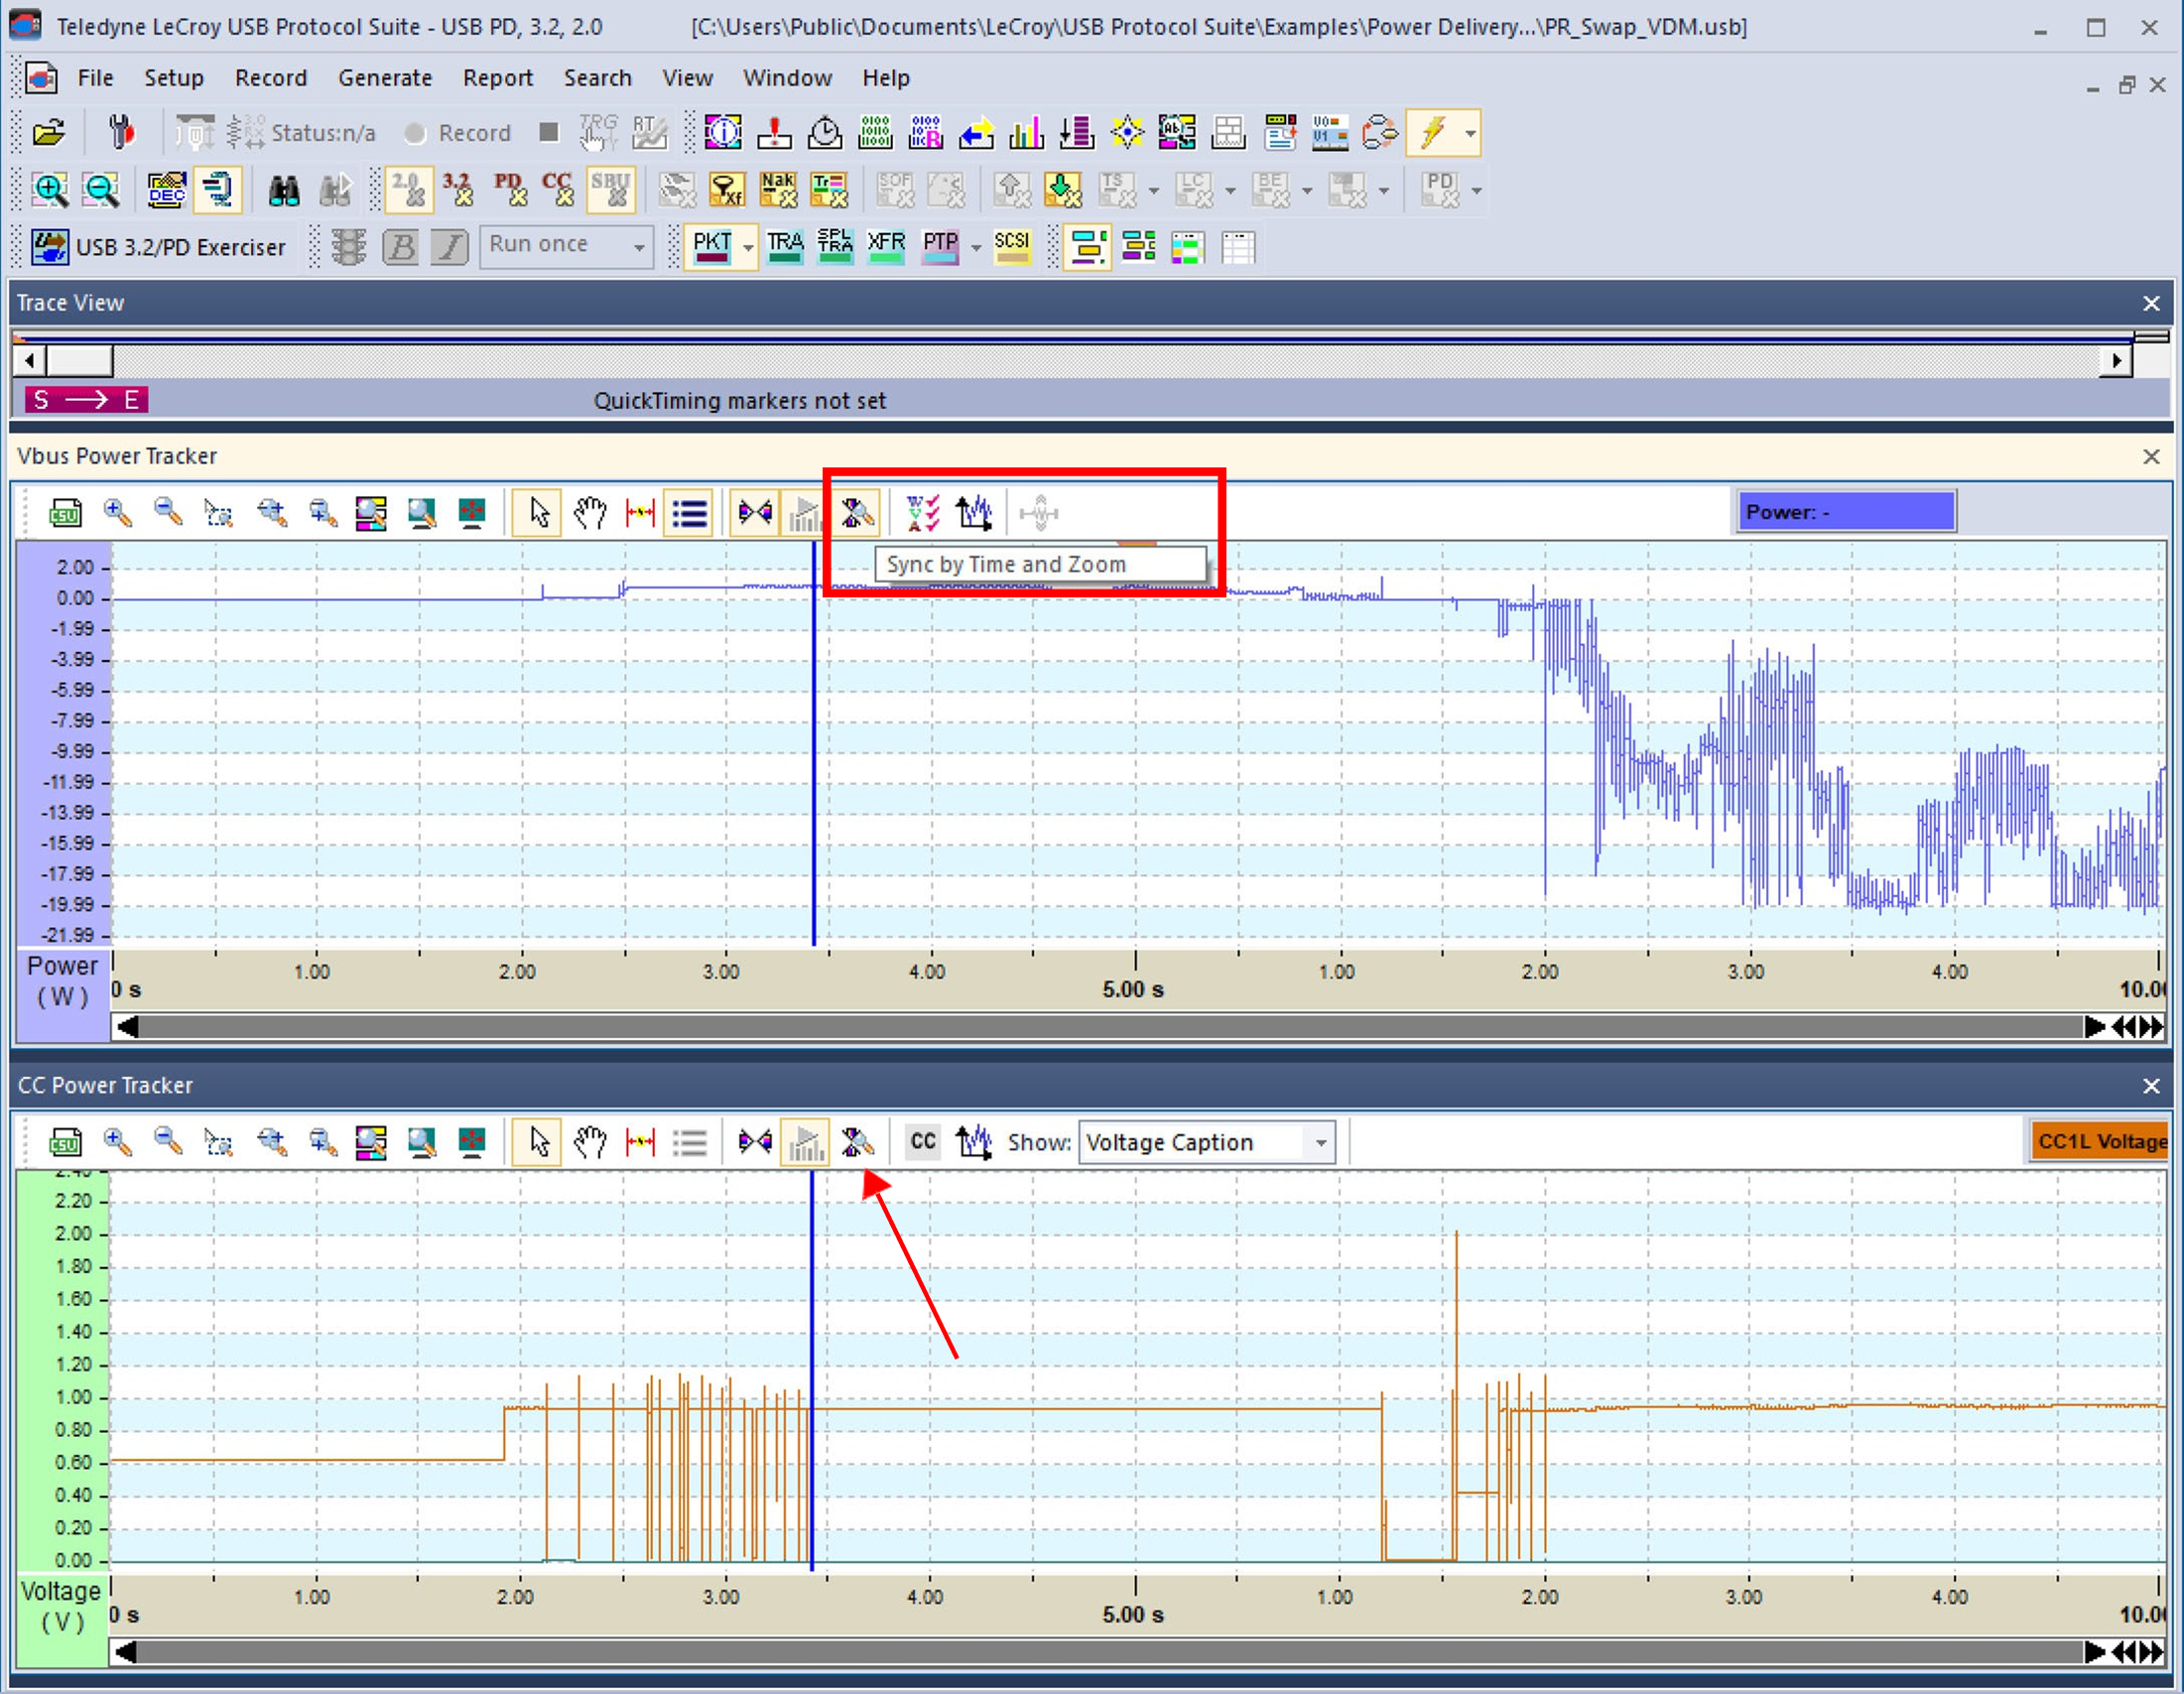
To display both the CC Power Tracker view synchronized with the VBUS Power Tracker, open an appropriate trace. In this case the trace PR_Swap_VDM.usb has been selected below.
Ensure both VBUS Power Tracker and CC Power Tracker are enabled. See below.

To use this feature, you must dock the two views so they lie above and below each other, as shown below. This is not done automatically. By pressing the Sync by Time and Zoom button, both views will track any subsequent zooms and time scrolling, so that the relationship between the events is visually consistent. In addition, the blue selection line is kept aligned as much as possible.
This feature will be improved on in the future, and is presented as a Beta version at this time. See figure below.
VBUS Power Tracker Export to CSV File
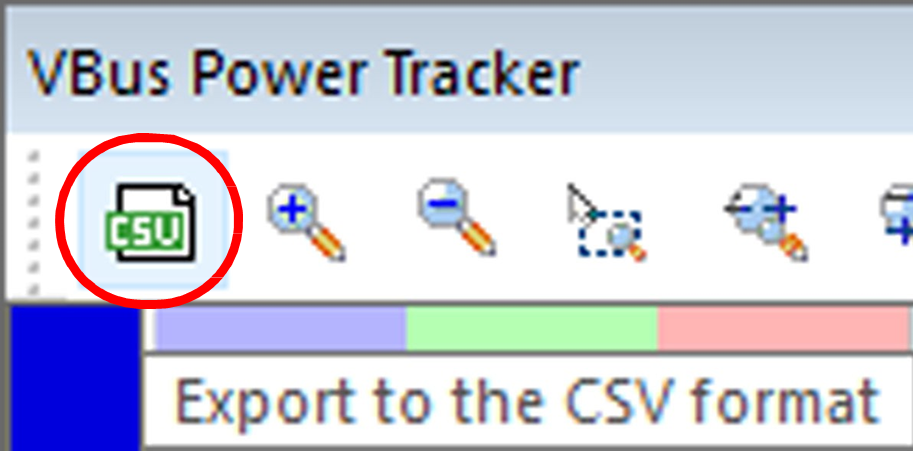
If you select the CSV icon on the toolbar, a window appears in the directory path where the USB Protocol Suite Software was installed: C:\Users\Public\Documents\LeCroy\USB Protocol Suite\Examples\Power Delivery Traces.
Choose an appropriate file title for the CSV file.
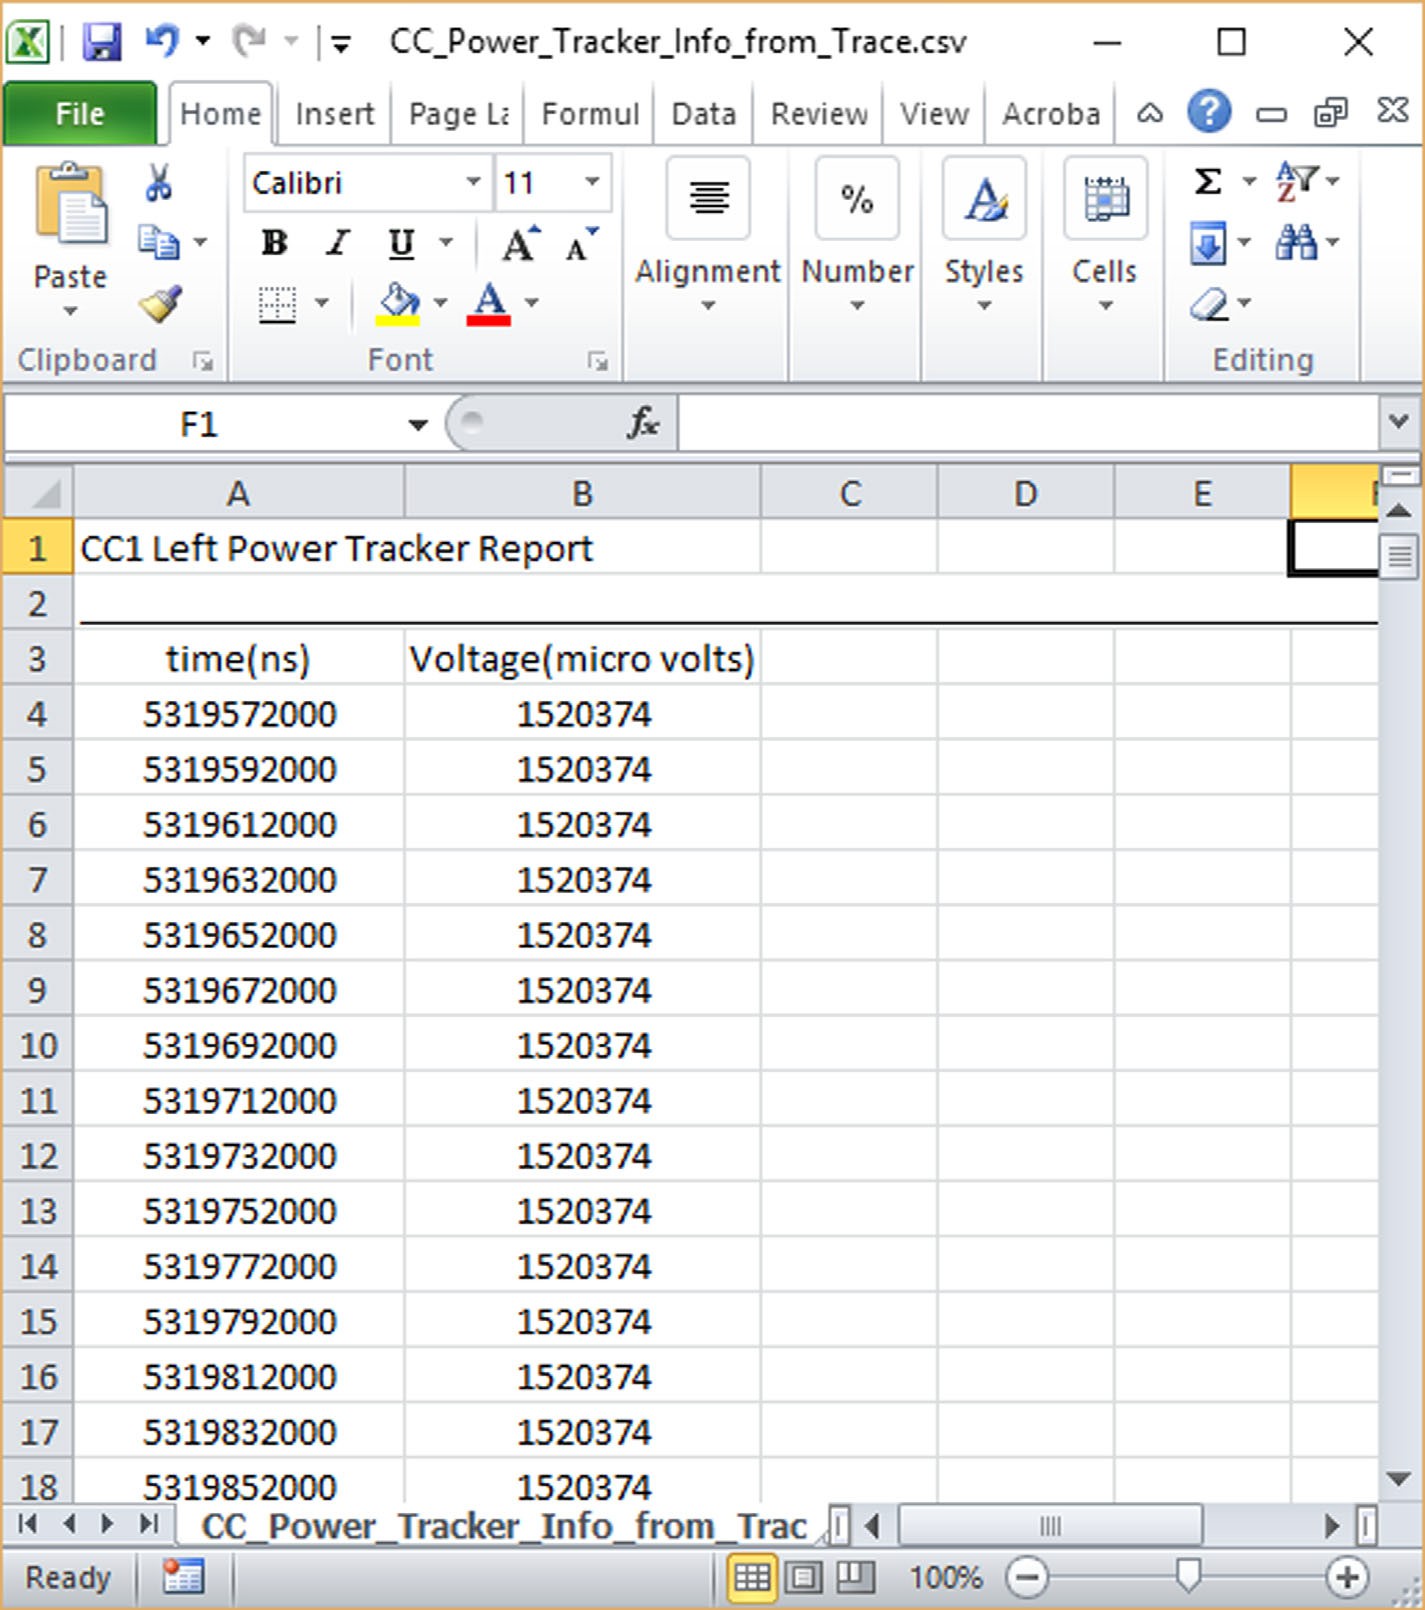
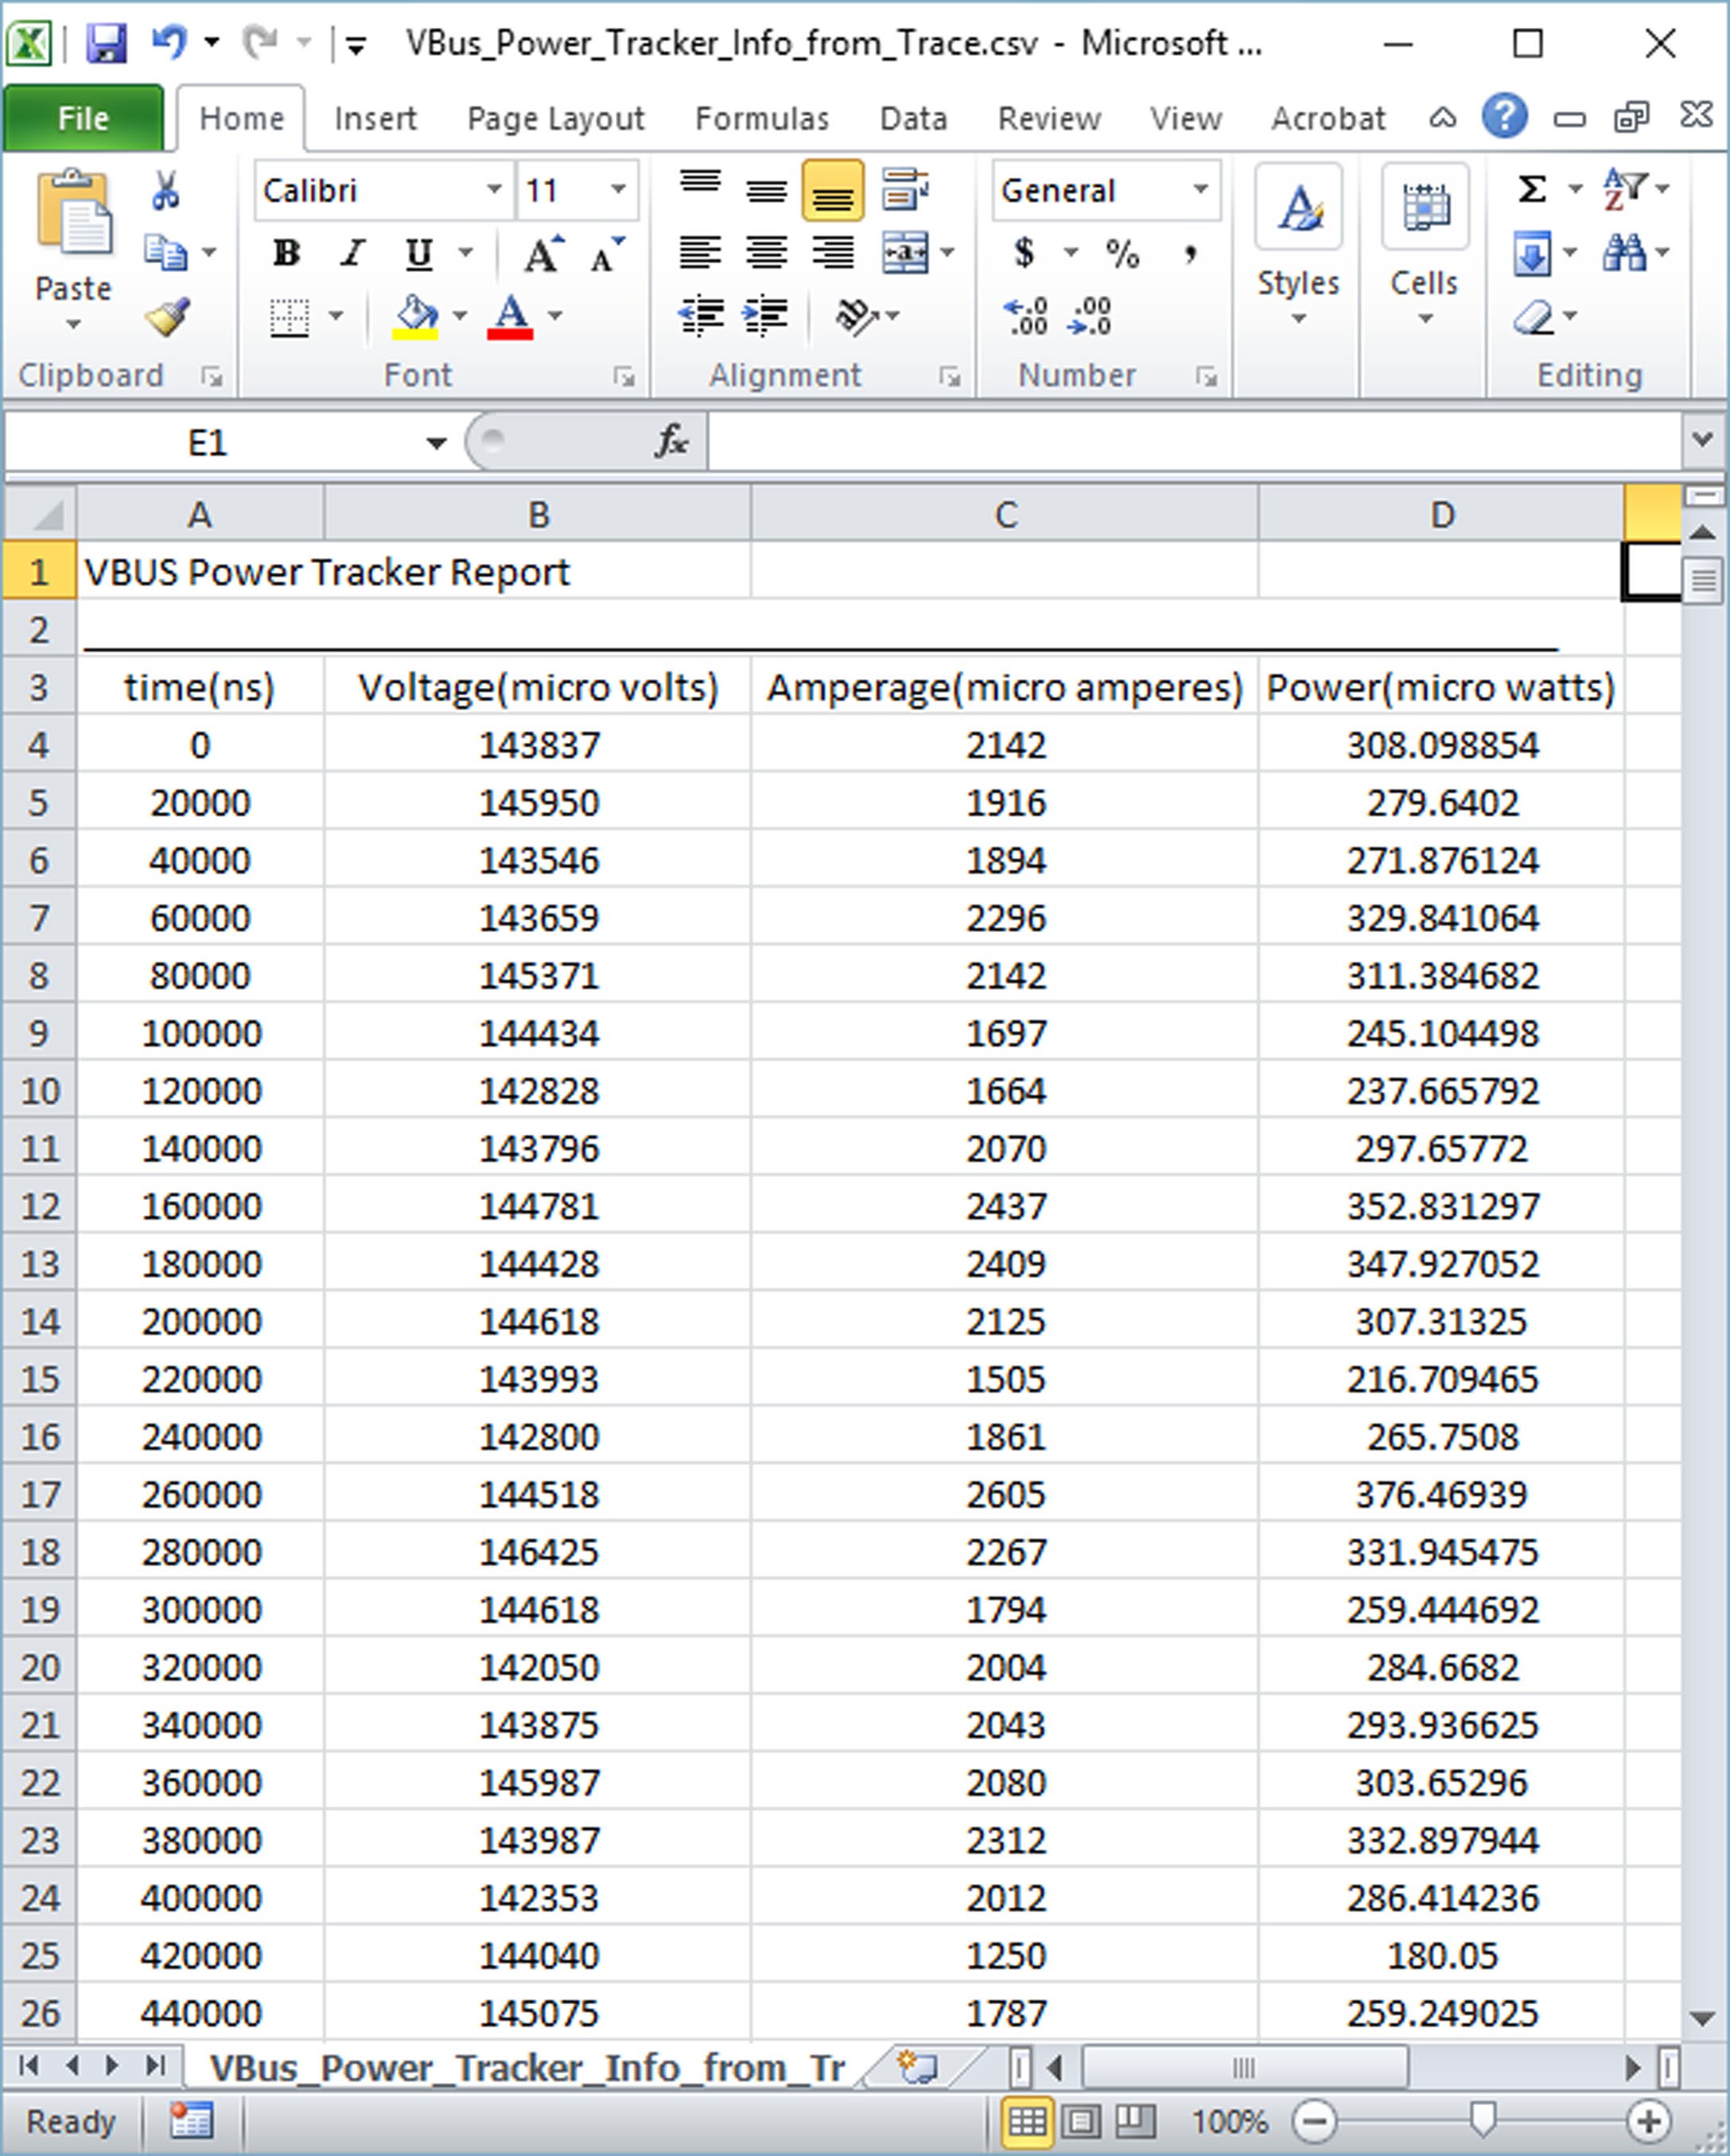
Select Save and the CSV file will be saved to the chosen directory. You can then open the file with Excel, as seen below.
Configuration Channel (CC) Power Tracker
The USB Type C cable supports two Configuration Channel (CC) pins: CC1 and CC2. The Voyager M310C/M310P/M310e/M4x/M480x/M4120 has two Type C connections: one on the left of the front panel (Connector 1) and one to the right (Connector 2).
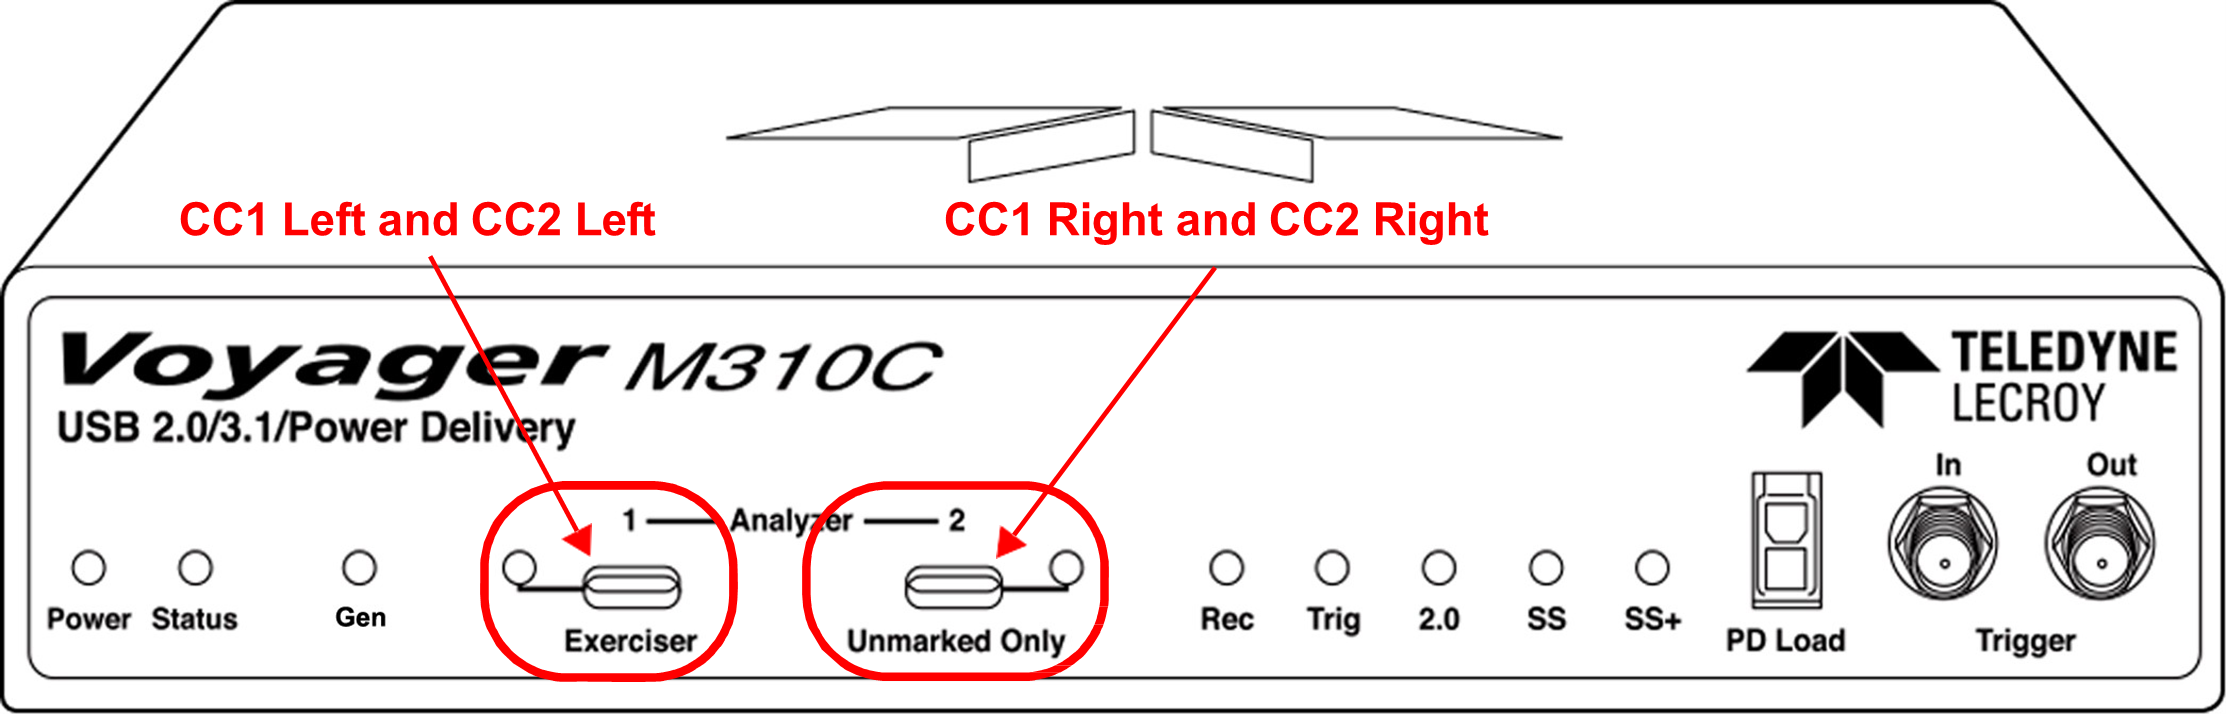
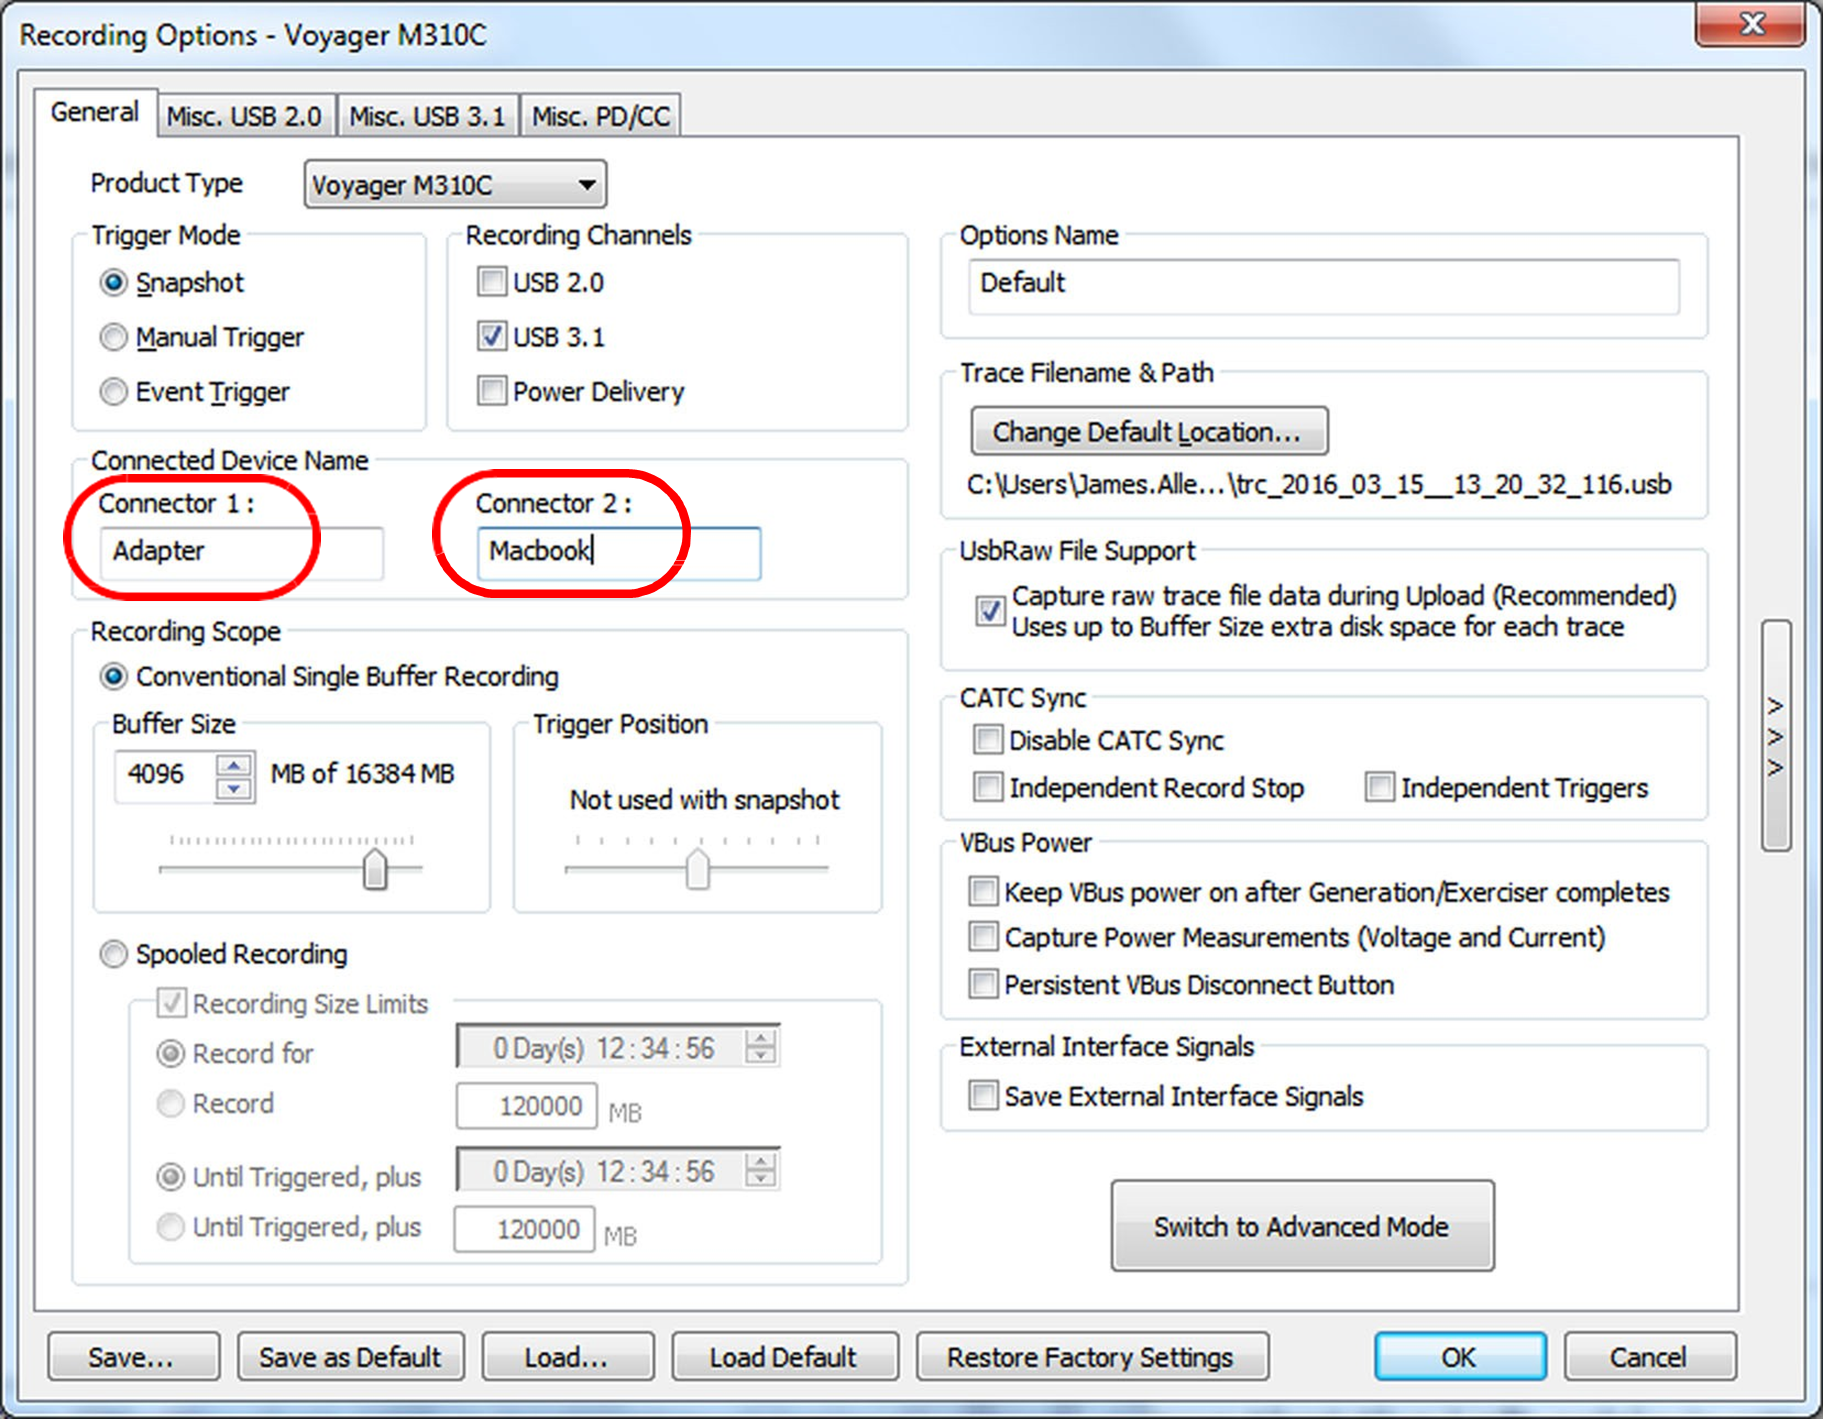
When setting Recording Options, the Left and Right analyzer connectors can be labeled and those labels will show up in the trace file.
Configuration Channel (CC) Pins
Voyager also provides the voltages of the Configuration Channel (CC) pins in a separate window (CC Power Tracker View). Left “Adapter” is for Connector 1 (CC1L, CC2L) and Right “MacBook” is for Connector 2 (CC1R, CC2R).
The Configuration Channel pins in a Type C connector can be used to determine a variety of functions:
-
Attachment of USB Port Detection
-
Cable Orientation Detection
-
Role Detection
-
Current Mode Advertisement and Detection (Default, Medium and High)
The analyzer monitors the CC1 and CC2 pins for pull-up or pull-down resistances to determine when a USB Port has been attached, the orientation of the cable and the role detected. “Rd” means the Port is configured to sink current. “Rp” means that the Port is configured to source current. “Ra” means that the Port has been configured to high impedance. Open means that the cable is unattached.
Packet 107 displays the voltages on the CC pins are as follows:
-
CC1 Left = 008.750 mV
-
CC2 Left = 001.250 mV
-
CC1 Right = 692.670 mV
-
CC2 Right = 001.528 mV
The voltages values can be read in the colored tabs or in the gray window that pops up. See images below.

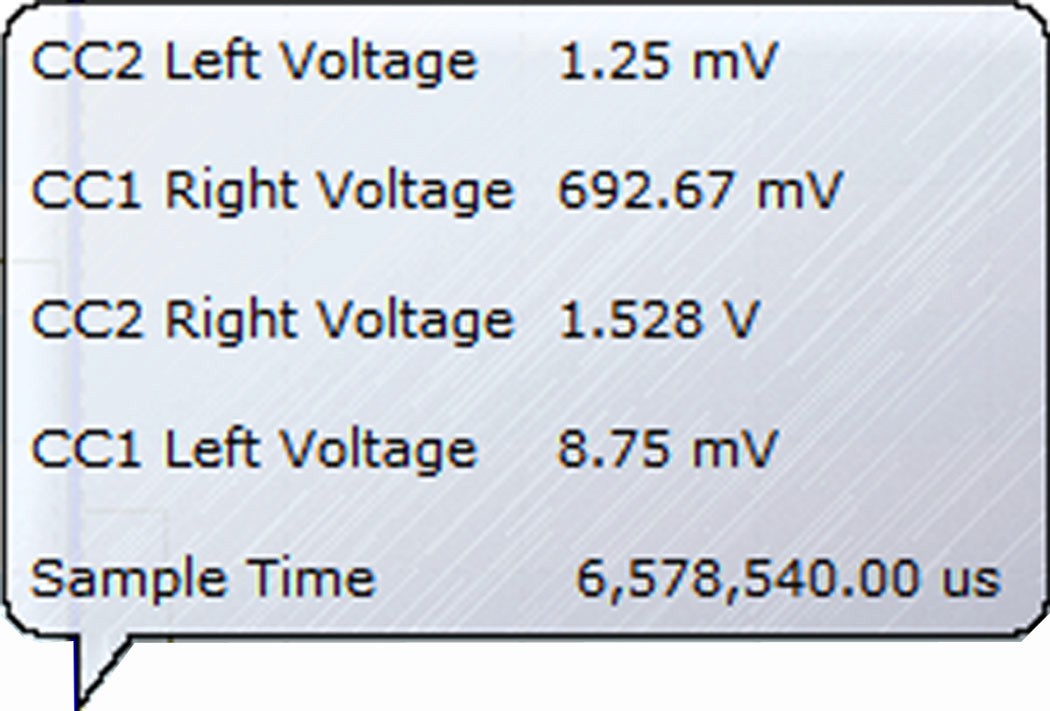
Packet 107 is highlighted below, which shows that the Left cable is attached and is a Source. The Right cable is attached and is a Sink.

Packet 000 through Packet 003 show the stages the CC1 and CC2 pins on the left and right analyzer connectors go through as the unit powers up.
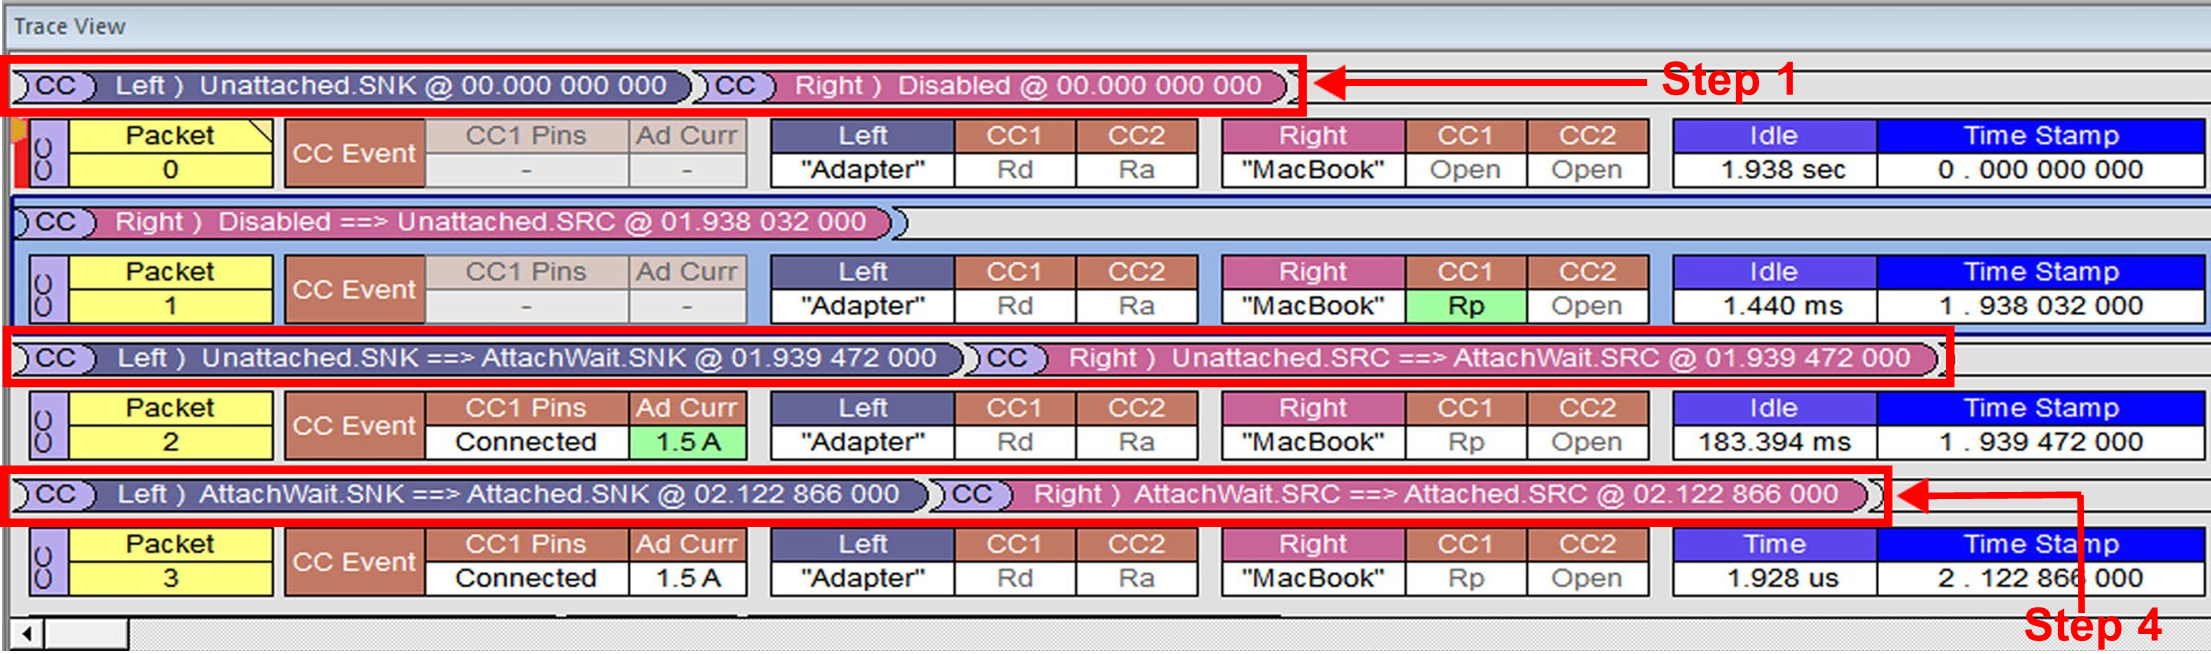
Both units start out Unattached/Disabled in Packet 000 and by Packet 003 the left unit (labeled “Adapter”) is Attached as a current Sink and the right unit (labeled “MacBook”) is Attached as a source.
CC Icon and Voltage Captions
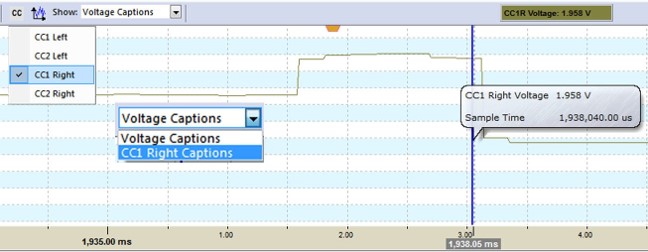
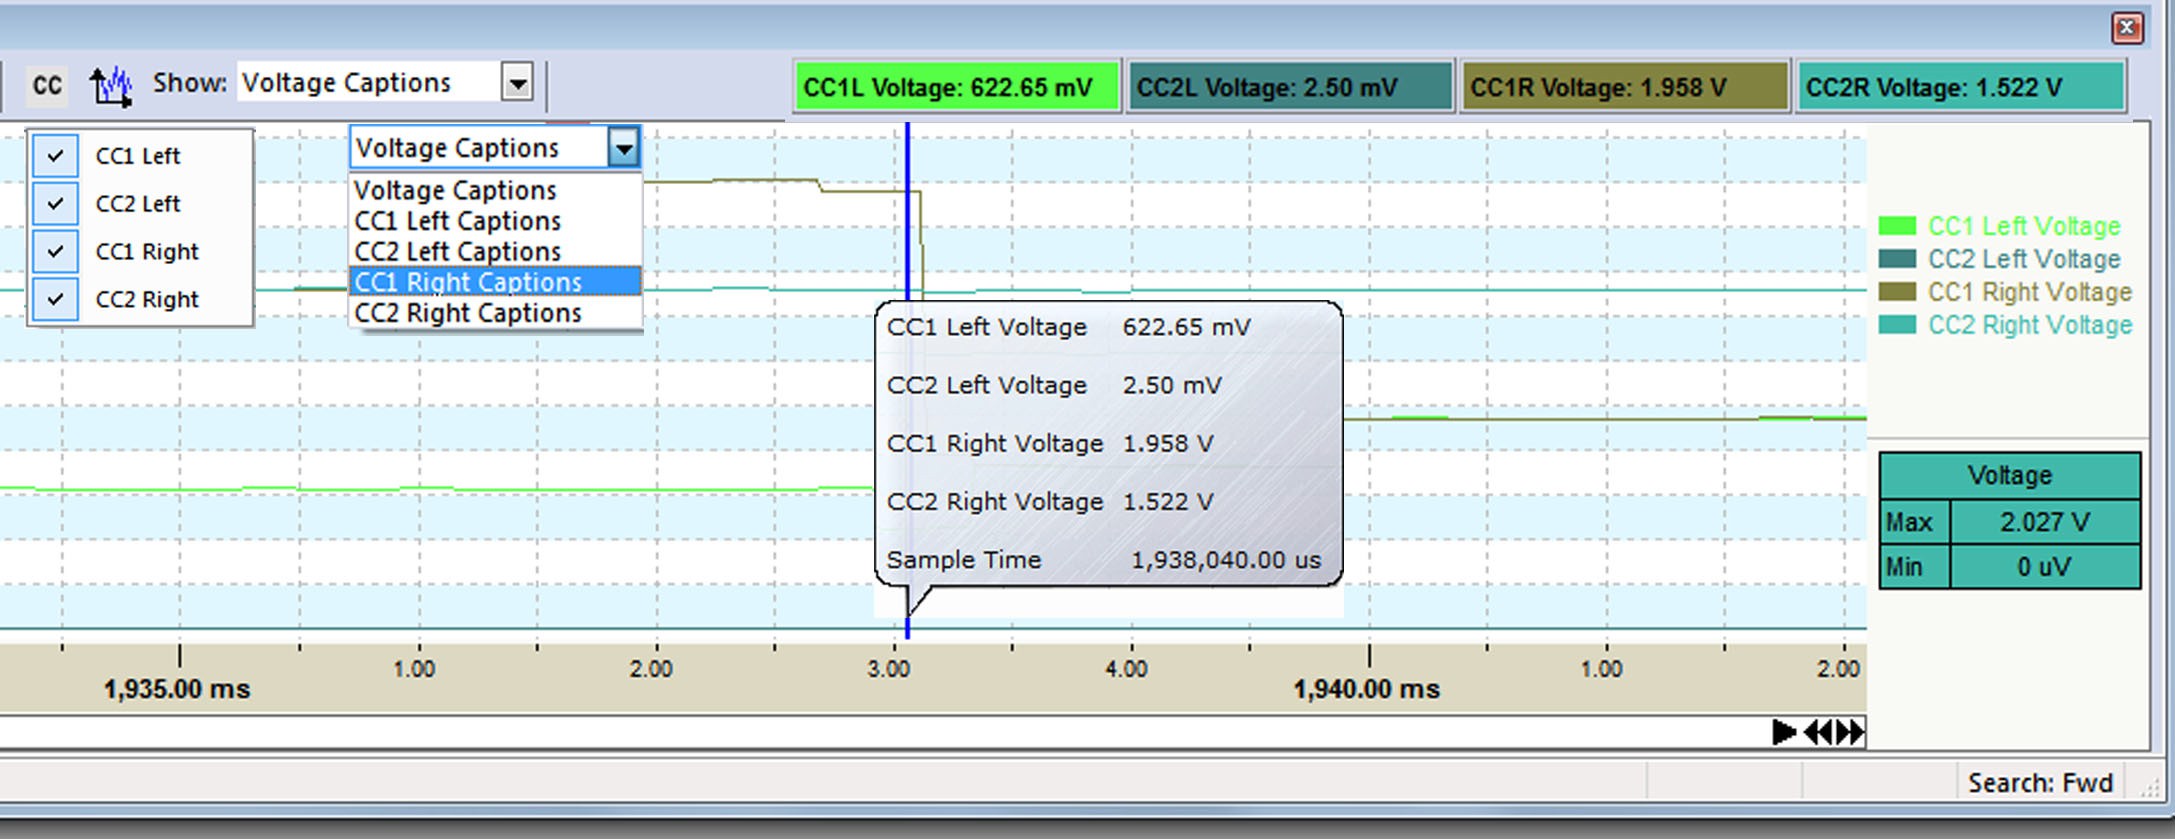
In the CC Power Tracker View you can selectively turn-on or turn-off each of the
voltages: CC1L, CC1R, CC2L or CC2R by selecting the 
If you leave all the CC voltages on for display the CC Tracker View would be more congested.
CC Power Tracker Export to CSV File
If you select the CSV icon on the CC Power Tacker toolbar, a dialog box will opens in the directory path where the USB Protocol Suite Software was installed:
C:\Users\Public\Documents\LeCroy\USB Protocol Suite\Examples\Power Delivery Traces.
Choose an appropriate file title for the CSV file.
Select Save and the CSV file will be saved to the chosen directory. You can then open the file with Excel.