
The USB Compliance Suite is an application for initiating the test process and managing test output. The software comprises five main components:
Workspace
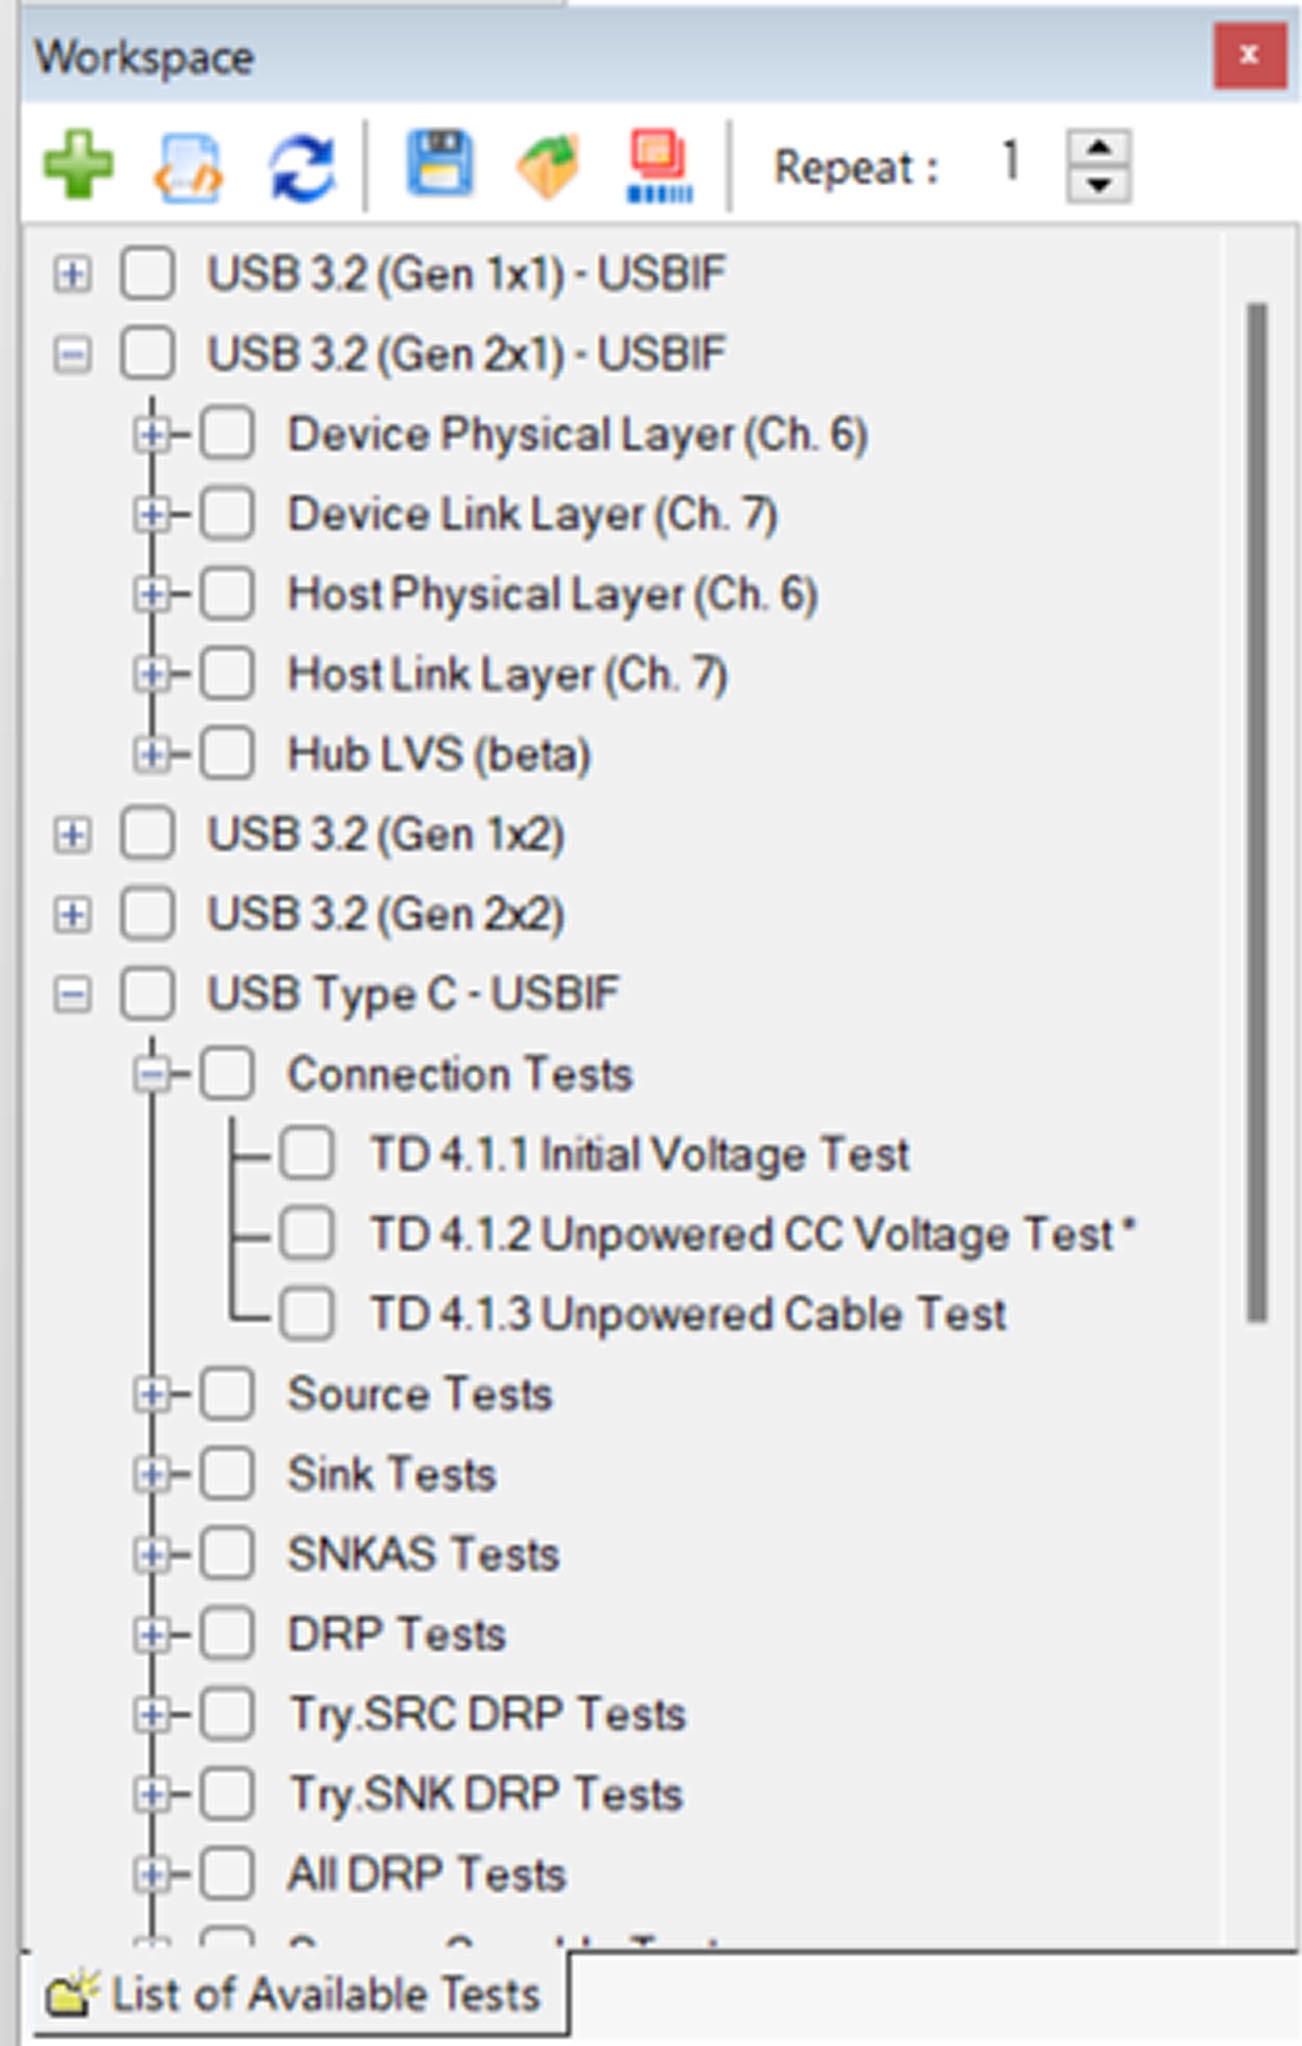
The Workspace provides a nested tree structure that allows you to select individual tests to run. Use the Workspace to select and run individual tests or groups of tests. Other functions available on the menu bar include removing selected tests from the execution path, opening output trace files, and viewing summary reports. The table below contains a full list and description of the functions and tools used in the Workspace.
Workspace Tools & Controls
|
Icon |
Tool/Control |
Description |
|
|
Add Button |
Adds selected test(s) to the execution pipe. |
|
|
View Selected Test Case VBScript |
Opens the VBScript file where a selected test case can be viewed. |
|
|
Refresh |
Refreshes the list of tests in cases where tests have been added or modified within the VBScript folder |
|
|
Save Workspace |
Saves a selected set of tests and stores them for future use |
|
|
Load Workspace |
Selects tests that were previously saved |
|
|
Load Reset Lists |
Loads a set of Configuration Test Files |
|
|
Repeat a Test |
Specifies the number of times a test is executed |
The workspace looks like this:
Test Profiles
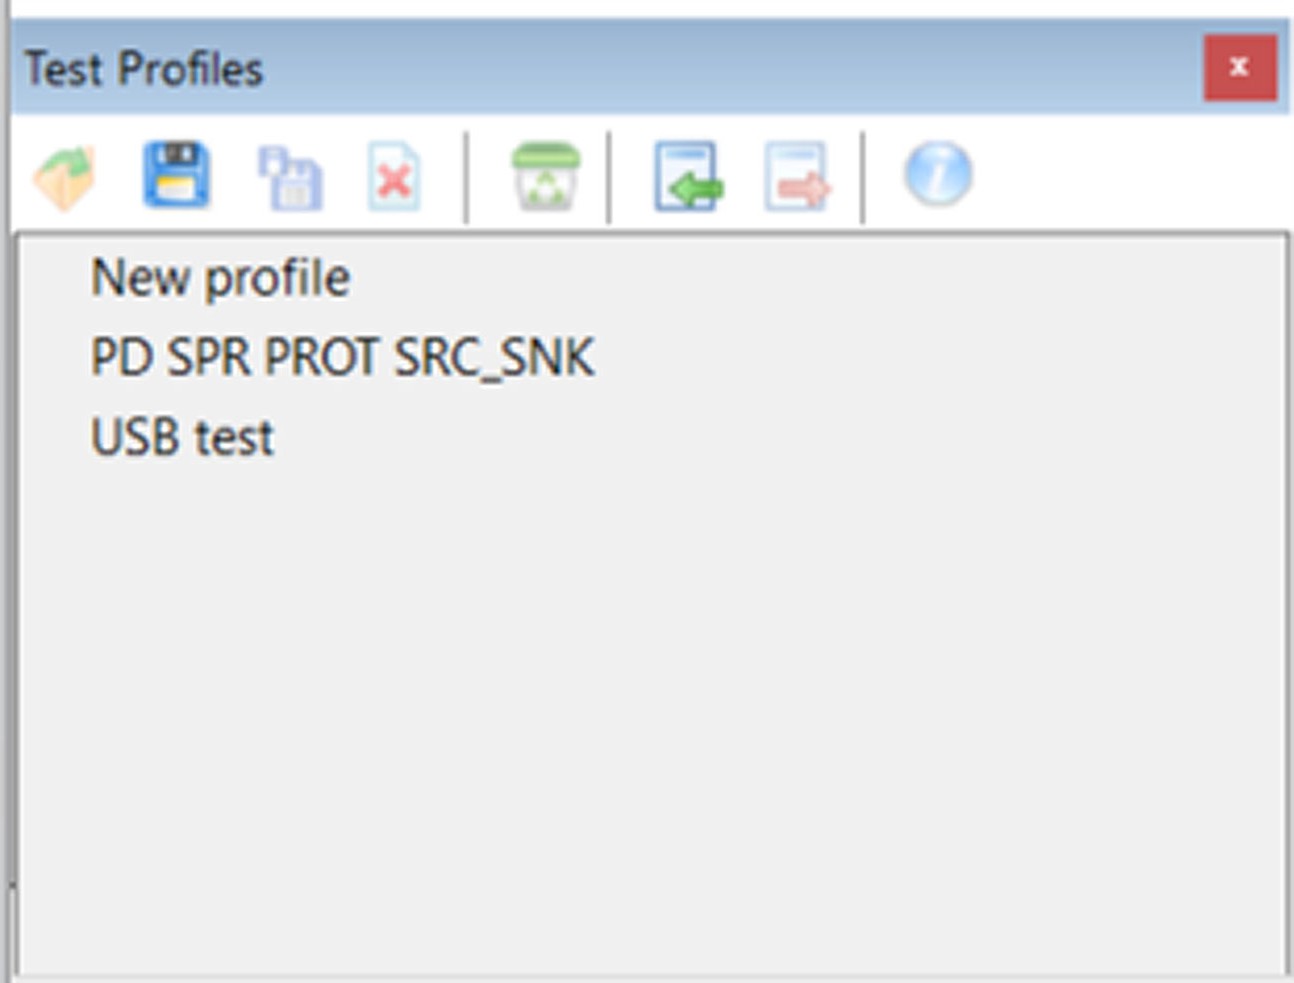
Test Profiles allow users to quickly save and load custom test environments. Profiles include Settings, the path to the current Vendor Information File (VIF), and a list of selected tests from the Workspace. They can be loaded with one click when you are ready to initiate a test.
Test Profiles Tools & Controls
|
Icon |
Tool/Control |
Description |
|
|
Load Profile |
Select and load an existing Test Profile |
|
|
Save Profile |
Saves changes to the selected Test Profile |
|
|
Save as Profile |
Saves the current Workspace, Settings, and VIF information into a new Test Profile |
|
|
Remove Profile |
Deletes the selected profile |
|
|
Clear Out Profile |
Clears test results and deselects a profile |
|
|
Import Profile |
Imports a Test Profile from your computer’s file system |
|
|
Export Profile |
Exports a Test Profile to the empty folder of your choice |
|
|
Profile Information |
Displays information about the currently selected profile 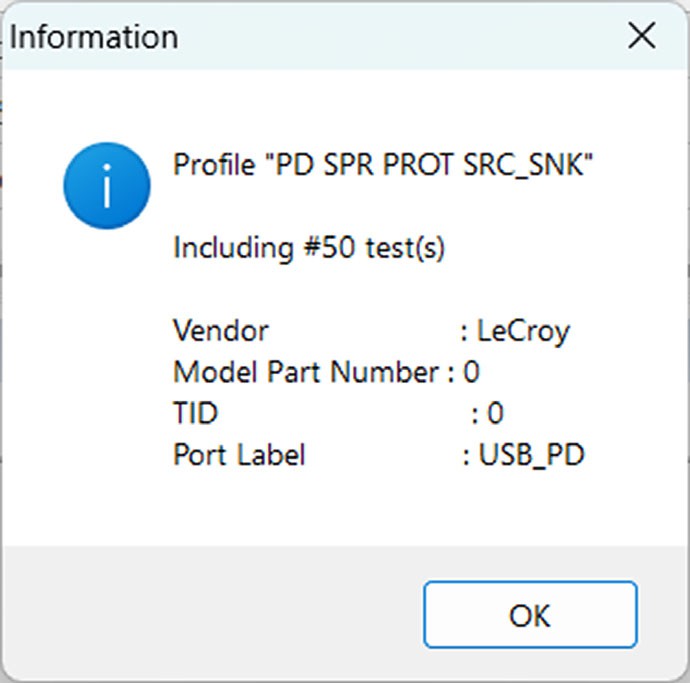
|
The test profiles section looks like this:
Test Monitoring Console
The test monitoring console shows individual tests selected for execution. The table below contains a list of the tools and controls available in the Monitoring Console. Instructions for use are in View a Selected Test Script.
Test Monitoring Console Tools & Controls
|
Label/ Button |
Type/Name |
Description |
|
Compliance Test |
Field |
List of compliance tests that have been selected for execution. |
|
Result |
Field |
Status of test upon completion. The Result field may display Passed, Failed, or N/A. When the test passes, Pass is shown on a green background. When the test fails, Fail is shown on a red background. When the test executes and the verification process is unable to confirm the expected behavior or the test not applicable, N/A is shown on a gray background (rarely occurs). When the test is unable to capture a valid trace file, the software displays a message, “Error during recording; No trace file created”. |
|
Description |
Field |
If the test fails, error codes are displayed in this field. |
|
|
Run |
Starts execution, in sequential order, of all tests in the monitoring window. |
|
|
Stop |
Stops execution of the current test run. |
|
|
Retry |
Runs the failed test cases again. |
|
|
Run Selected |
Runs the selected test cases. Use ctrl + right-click to select multiple rows. |
|
|
Repeat |
Sets how many times you want to repeat a test. This button gets the number of repeats and applies it to all tests selected for execution. |
|
|
Stop Repeat |
Cancels the Repeat setting. This applies to all tests selected for execution. |
|
|
Repeat Selected |
Sets how many times you want to repeat a selected test(s). |
|
|
Stop Repeat for Selected Tests |
Cancels the Repeat setting for selected tests. |
|
|
Remove |
Removes selected tests from the list. You can select multiple rows using Ctrl + click or Shift + click. |
|
|
Remove All |
Removes all tests from the running queue. |
|
|
Expand All |
Expands all Header Rows. |
|
|
Collapse All |
Collapses All Header Rows. |
|
|
Scroll |
Scrolls to a Running Test. |
|
|
Open Trace File(s) |
Opens the captured trace of a completed test. If multiple traces were captured, the file location is opened instead. Alternately, you can double-click on a completed test to view its trace file. |
|
|
View HTML Summary Report |
Generates a summary report of the latest completed Test Runs. The HTML report summarizes the test results including the result, suspected error code, and test execution details. If individual test cases generate a fail result, hyperlinks are added to navigate directly to the error point in the trace file. |
|
|
View XML Report of Latest Run |
Generates an XML summary of the latest Test Run. |
|
|
Force ‘Read Device Descriptors’ in the Next Run |
Forces the 'Read Device Descriptors' in the next run. |
|
|
Vendor Information File |
Opens the Vendor Information File window (see below). |
|
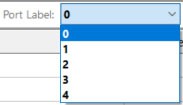
Port Label |
If you are testing a product, use this to select the port you’re testing. |
|
|
Cable End |
If you’re testing a cable, select which end you’re using. |
Test Progress Indicators
Test progress indicators that might appear in the Test Monitoring Console are described below.
|
INDICATOR |
ACTION |
|
Monitoring Console |
|
|
Pass, Fail, or N/A |
These appear in Results column. |
|
Error code(s) |
These appear in Description column. |
The Test Monitoring Console looks like this:
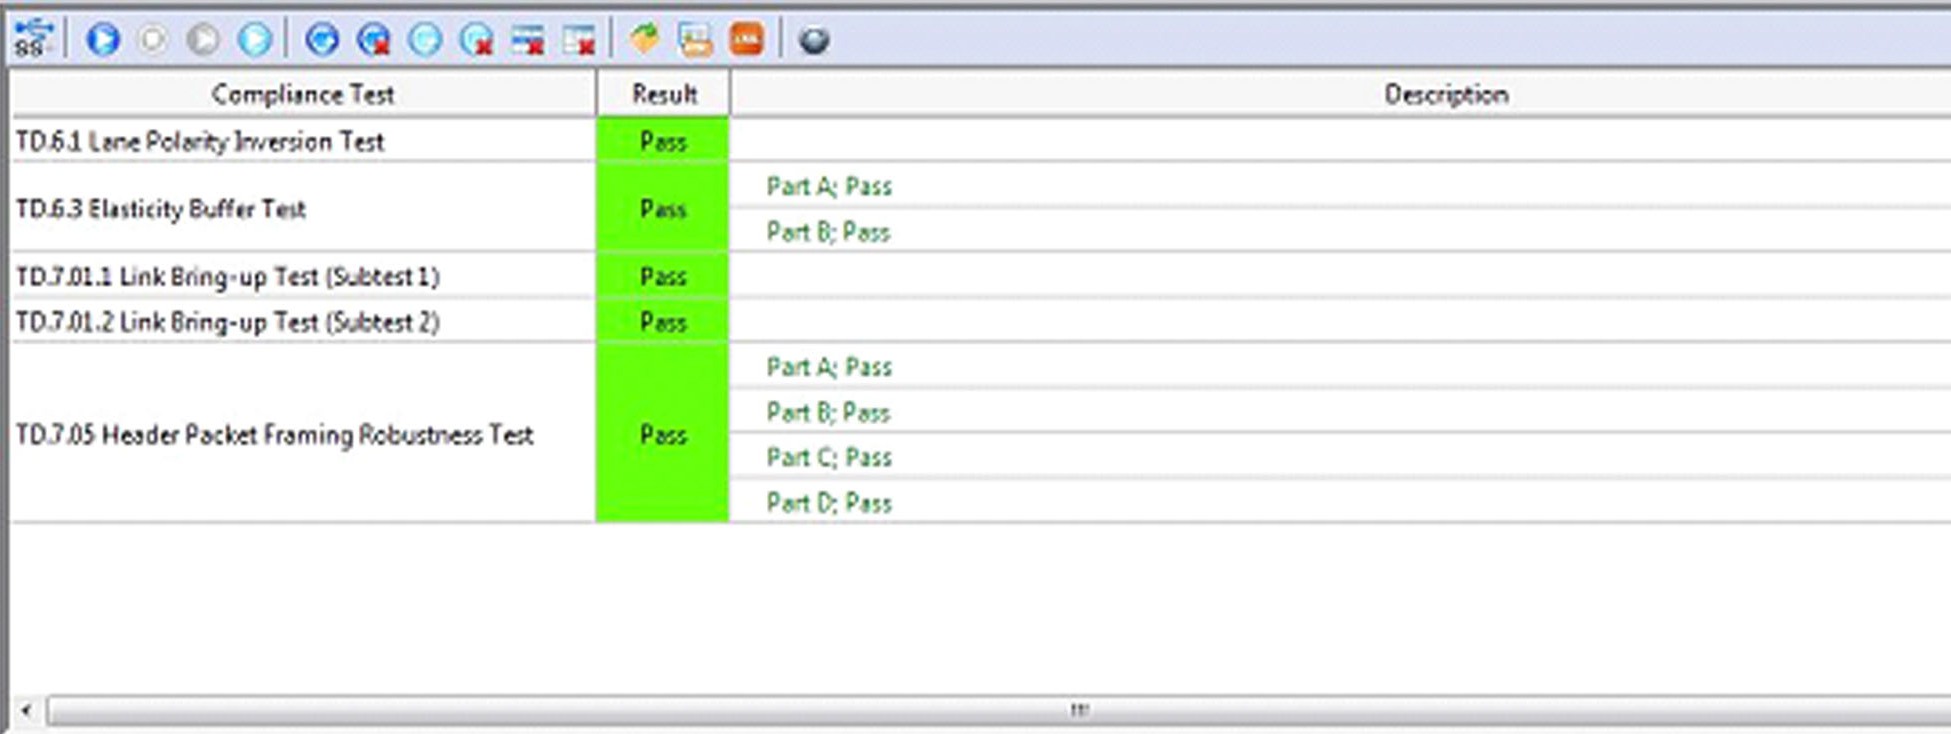
Vendor Information File Window
VIF Window Tools & Functions
|
Icon |
Label |
Description |
|
|
View |
|
|
|
Open |
|
|
|
Save |
|
|
|
Edit/Save As |
|
|
|
Number of components |
|
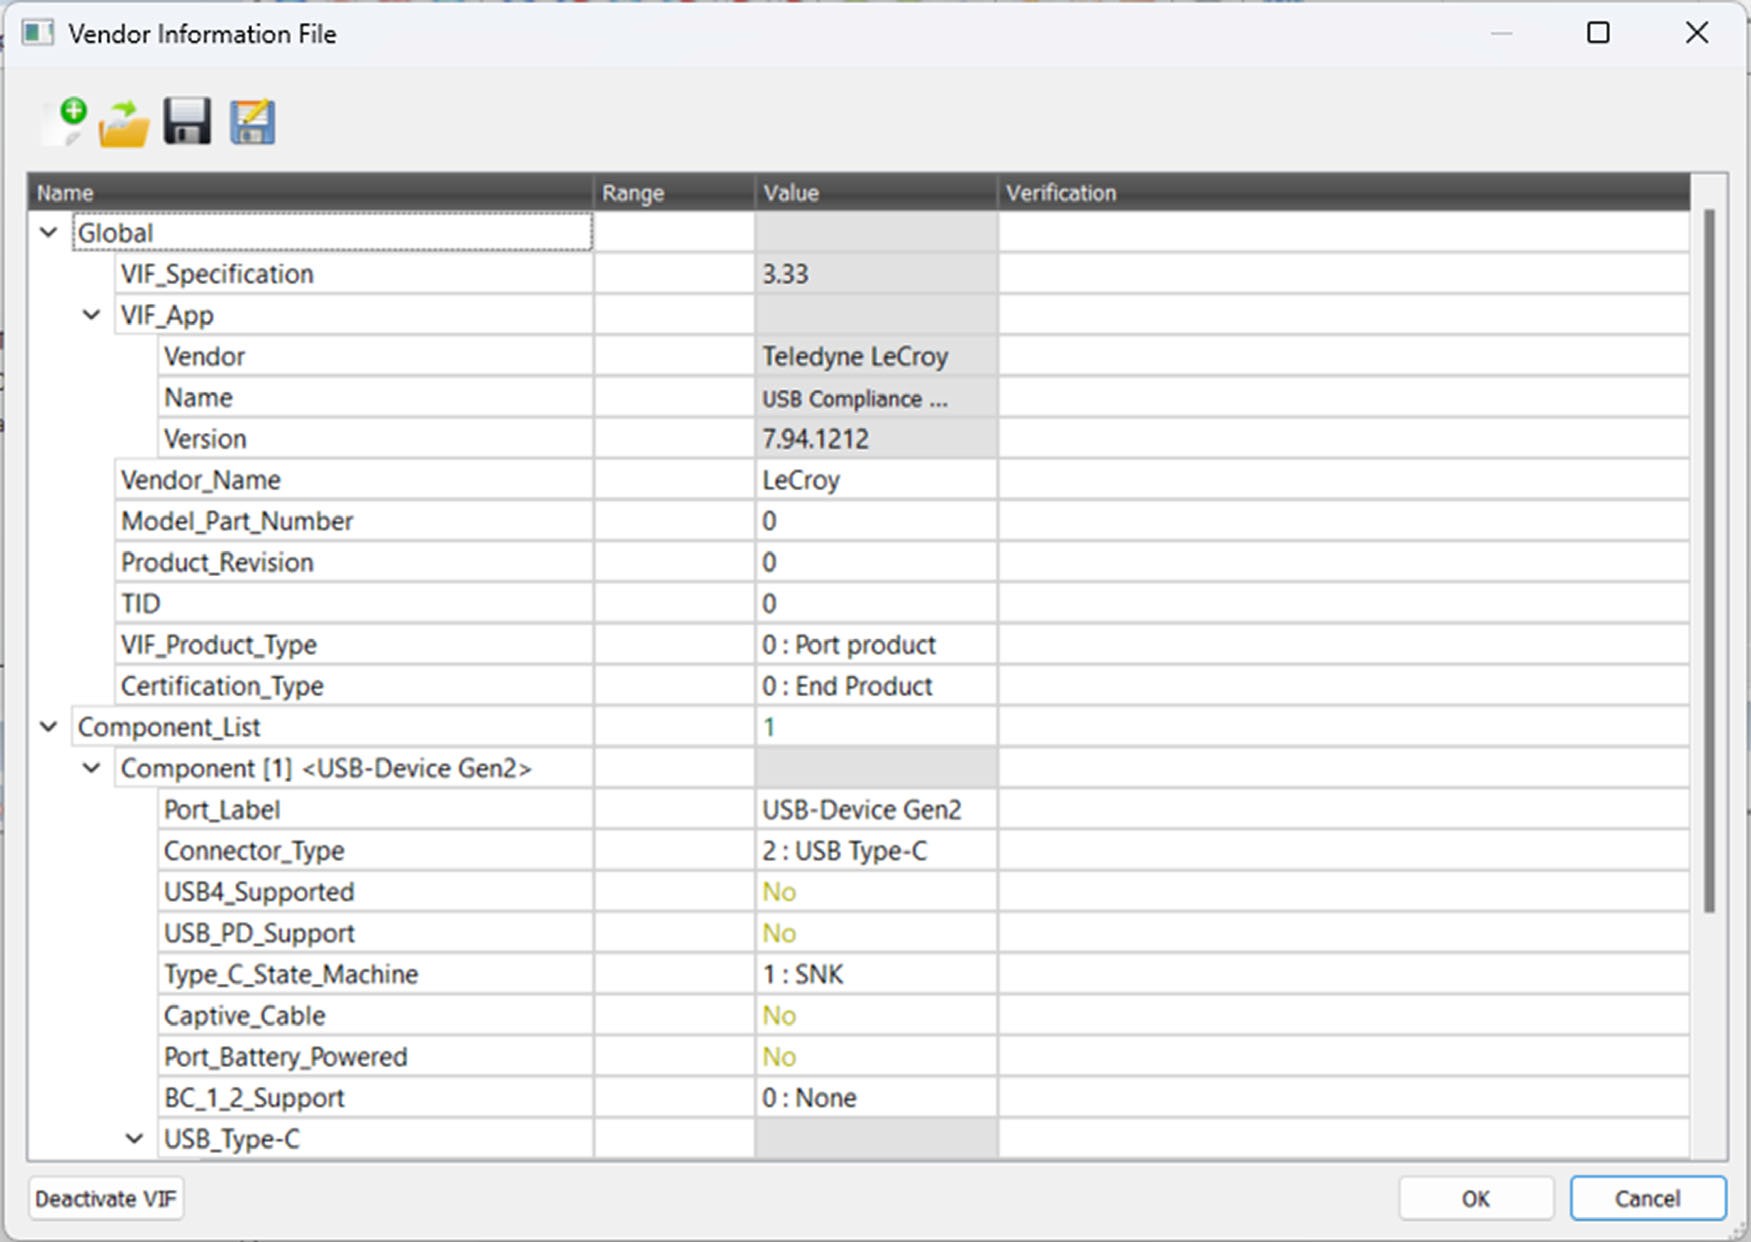
The Vendor Information File window looks like this:
Output Window
The Output Window provides a real time test log in text format. The software generates a text-based report during execution of the test run and appends the report to the Output Window as each test completes. The Output Window has two tabs:
Output Log Window
The log summarizes the status of each test and alerts you to possible test operation problems as they are detected.
Common Checks Window
Common checks operate differently from regular tests (i.e., they cannot be run on their own). To view the common checks test results, click the Common Checks tab at the bottom left of the main window.
Test Progress Indicators
Test progress indicators that might appear in the Output Log Window are described below.
|
INDICATOR |
ACTION |
|
Output Window |
|
|
Start Recording |
The analyzer has loaded the designated Recording Options file and has begun recording traffic from the PUT. |
|
Start Generation |
The Exerciser starts running the test script. |
|
Waiting |
Displays while the test is running. |
|
Stop Generation |
Displays when the test script has finished. |
|
Stop Recording |
Displays when the analyzer has stopped capturing data and automatically begins uploading the trace file. |
|
Run Verification Script |
Indicates the appropriate verification script has been retrieved and is automatically analyzing the results of the test. |
|
Passed or Failed |
One of these displays based on the test result. |
|
Finished |
Displays once the test is updated in the Monitoring window. |
|
Retry |
Displays when Fail is logged for a given test and the automatically re-run test option is enabled in the Settings dialog. |